
Assessment of Walker-assisted Human Interaction from LRF
and Wearable Wireless Inertial Sensors
Maria Martins
1
, Carlos Cifuentes
2
, Arlindo Elias
2
, Valmir Schneider
2
,
Anselmo Frizera
2
and Cristina Santos
1
1
Industrial Electronics Department, Minho University, Guimarães, Portugal
2
Electrical Engineering & Biotechnology Departments, Federal University of Espirito Santo, Vitória-ES, Brazil
Keywords: Man-machine Interaction, Assisted Ambulation, Gait Analysis.
Abstract: This paper describes the assessment of basic walker-assisted human interaction based on a laser range finder
(LRF) sensor and two inertial wearable sensors. Thirteen osteoarthritis patients and thirteen healthy subjects
were selected to be part of this pilot experiment, which intends to acquire and calculate spatiotemporal and
human-interaction parameters from walker-assisted ambulation. A comparison is made between the
spatiotemporal parameters of healthy subjects and the ones of patients with osteoarthritis. Moreover, it is
made an analysis of the effect that change of direction in walker-assisted ambulation can have on
spatiotemporal parameters. Results have shown that 1) velocity, step length and distance to the walker are
significantly affected by the change of direction, and 2) distance to the walker and step length can
distinguish between healthy subjects and patients with osteoarthritis. In terms of human-interaction
parameters, results show that a LRF sensor can correctly describe the trajectory and velocity of the user in
relation to the walker. However, just the wearable sensors can characterize changes in direction. These
results will be further used in the development of a robotic control that intends to detect the user's intention
through LRF and inertial sensors, and respond accordingly.
1 INTRODUCTION
The increase of human average lifespan demands the
need for patient-care technologies. Patient-care
facilities and nursing homes provide a supporting
environment for those elderly and other patients with
motor disability but are labour intensive and hence
expensive and limited.
Currently, canes and wheelchairs are the most
used assistive devices. However, canes do not
provide enough support for the muscles and the use
of the wheelchairs may lead to lower limb muscle
atrophy (Martins et al., 2011). Therefore, research
started to focus on walkers, which are devices that
improve mobility and independent performance of
mobility-related tasks.
Individuals requiring walkers have a reduced
ability to provide the supporting, stabilizing,
propulsion or restraining forces necessary for
forward progression. By decreasing the weight
bearing on one or both lower limbs, walkers may
help these individuals, alleviating pain from injury
or clinical pathology such as osteoarthritis
(Martins et al., 2011).
However, some problems have been reported in
the literature (Bateni and Maki, 2005) regarding
such devices, related to the lack of security and the
cognitive demands. Users must take overly cautious
steps not to push it out too far forward and they are
unsafe to use on uneven/slope terrain.
Thus, researchers on the robotics field started to
investigate how to promote safe mobility, and tried
to standardize and create an effective way to assess
and evaluate human-robot interaction in assisted-
walker gait. In this context, the Smart walkers
emerged (Martins et al., 2011), conventional walkers
adequately instrumented for control purposes, such
as the inference of the walker’s user intent in order
to control its speed, direction and distance
accordingly.
Research often addresses the study of interfaces
that try to recognize the user’s movement and/or
intent without requiring exhaustive manual
operations. Examples include recognition using
cameras (Martins et al., 2011), detection of human
gait using force sensors (Frizera et al., 2010) and
143
Martins M., Cifuentes C., Elias A., Schneider V., Frizera A. and Santos C..
Assessment of Walker-assisted Human Interaction from LRF and Wearable Wireless Inertial Sensors.
DOI: 10.5220/0004624201430151
In Proceedings of the International Congress on Neurotechnology, Electronics and Informatics (SensoryFusion-2013), pages 143-151
ISBN: 978-989-8565-80-8
Copyright
c
2013 SCITEPRESS (Science and Technology Publications, Lda.)

ultrasonic sensors (Kuan et al., 2010).
JaRoW (Lee et al., 2011) was developed to
provide potential users with sufficient ambulatory
capability in all directions and easy-to-use features.
This walker was integrated with laser range finder
(LRF) sensors to detect the location of user’s lower
limbs in real time (Lee et al., 2011). A Kalman and
particle filters were applied to estimate and predict
the locations of the user’s lower limbs and body, in
real time. A PID controller was used that, despite the
good results, it is not certain to be effective when
tested with elderly people, whose behavior has
unpredictable changes, affecting the Jarow
dynamics. In addition, the rotation detection
algorithm, that detects when the user wants to curve,
is based on pre-defined limits that could not be
respected when dealing with elder people, thus
generating false decisions.
In (Ochi et al., 2011), it is proposed a walking
assist system for a body weight support walker
NILTWAMOR to track the walking trajectory of the
user. By using the LRF range sensor, the body center
point (BCP) of the user is estimated and used to
control both the gait velocity and the direction of the
user. The relationships between the facing direction
of the body and the inclination angles of both legs
are taken into account to control the walker’s
direction. However, the manuscript does not discuss
in detail the obtained results. Besides that, tests were
performed with normal healthy subjects.
Despite these studies, no attention has been given
to a quantitative evaluation of human-robot
interaction, i.e. to infer which signals related with
posture orientation and gait pattern can detect user’s
intentions while guiding the walker. Moreover, this
evaluation should be made with target users, like the
elder and other patients with motor disabilities.
So, the challenge to find a more reliable manner
to control the walker remains. As a first step, it is
necessary to access and analyse in detail the signals
of user-walker interaction to infer which ones are
better suited to indicate velocity and orientation
intentions of the user. Afterwards, it is possible to
develop a natural user interface between the walker
and patients and to employ a simple closed-loop
control without requiring any demanding cognitive-
effort from the patient.
In this context, this paper intends to access, study
and analyse basic walker-assisted human interaction
parameters of a walker model with forearm support
with knee osteoarthritis (OA) patients. For this, it
was used a LRF sensor placed on the walker-lower
base and two wearable inertial sensors: one mounted
on the walker and the other placed on the patient’s
body. Specifically, this paper aims to specify and
justify which interaction parameters are better to
interpret user’s velocity and orientation intention, to
then advance, in the next studies, for the
development of a robotic control. The human-walker
interaction measurements consist on the acquisition
of the: Distance between the user body center point
(BCP) and the walker; Angle of BCP orientation
relatively to the walker; Angle between linear
velocity vector and human-walker interaction line;
Angular velocity of the user and Linear velocity of
the user.
It will also be presented a gait evaluation based
on spatiotemporal parameters extracted from the
built-in LRF sensor. This evaluation intends to
detect the effect that a change in direction (making a
curve) has on spatiotemporal parameters. The
calculated spatiotemporal parameters were the gait
cycle, identification of stance and swing phases,
cadence and step length. These parameters were
chosen with base on previous studies (Debi et al.,
2009; Debi et al., 2011; Elbaz et al., 2011) that
compared knee OA subjects with healthy ones
walking without assistance. In those studies it was
suggested that an objective measurement tool such
as spatiotemporal parameters can help in evaluating
knee OA severity, effectiveness of treatment and
might help in disease management. Thus, the
calculation of these parameters with LRF sensor can
be a useful tool in the future to diagnose this type of
patients in assistance gait.
Results were derived from thirteen knee OA
subjects and thirteen normal subjects (control
samples). It is noteworthy that this study was done
with the motors shut down, to enable the evaluation
of the real interaction between the user and the
walker without the interference of any control
strategy.
This paper is organized as follows. Section 2
describes the methodology of this work, where it is
presented the walker and sensors system, the
experimental procedure and the human-walker
interaction parameters. Section 3 presents the
acquired results patients and normal subjects, and
provides for a discussion. Finally, conclusions are
presented in Section 4.
2 METHODS
2.1 Participants
For this study, 40 patients were chosen for inclusion
of individuals of both sexes over 55 years of age,
NEUROTECHNIX2013-InternationalCongressonNeurotechnology,ElectronicsandInformatics
144

able to walk unaided for at least 25 meters, not
having done any rehabilitation treatment for at least
2 months and not be making use of painkillers in the
last 7 days. Diagnosis of Osteoarthritis (OA) was
based on clinical and radiographic criteria of the
American College of Rheumatology, which confer
91% sensitivity and 86% specificity for the
diagnosis (Altman et al., 1986)performed by an
orthopedic surgeon with over 30 years' of experience
in evaluating patients with osteoarthritis and surgery
Total Knee Arthroplasty (TKA), aided by a physical
therapist with 10 years of experience in manual
therapy and functional assessment.
Exclusion criteria of subjects during the selection
process were: recent traumas; history of previous
surgery of the lower limbs, pelvis or lumbar spine;
neuromuscular diseases, other pathological forms of
arthritis, presence of neurologic sequel; and
cardiovascular diseases that contraindicate the
performance of experiments.
At the end of recruitment, 13 participants met all
inclusion criteria (Figure 1).
The control group consisted on 13 healthy
volunteers without any dysfunction on the lower
limbs.
Subjects read and signed an information and
consent form, which was approved by the Federal
University of Espirito Santo’s Health Science Center
Ethics Board.
Figure 1: Diagram of selection and exclusion of study
knee OA patients.
2.2 Protocol
2.2.1 Walker and Data Acquisition Systems
The Smart Walker is presented in Figure 2. This new
robotic walker consists basically of a mechanical
structure with an adaptable height to support the user
in the forearms.
The developed acquisition system consists of a
ZigBee Health Care (ZHC) network that has two
types of devices: three ZigBee End Devices (ZED)
and one ZigBee Coordinator, which is connected to
the PC and receives patient´s signal data from ZEDs
(Cifuentes,2010). The sensors are shown in Figure 2.
One ZED (C) is used to acquire and transmit
signals from the LRF sensor (scanning sensor
Hokuyo URG-04lx) (A) that is connected to a
system microcontroller (B) that performs legs’ path
detection (position and orientation). Specification of
LRF performance and the leg’s path detection
algorithm can be found in (Lee et al., 2011).
The other two ZEDs are integrated with IMU
sensors (ZIMUED) developed in previous research
(Cifuentes et al., 2010). One ZIMUED is located in
the trunk of the patient (D) and the other one is over
the walker (E). These sensors record orientation and
angular velocity of the user and walker.
The IMU signals are obtained every 50 Hz and
the LRF signals every 10 Hz.
Figure 2: Smart Walker hardware architecture.
2.2.2 Experimental Procedure
First, it was established that the walker should have
the motors shut down and the user should walk with
a self-selected speed, during assisted-ambulation.
This was important to obtain the preferred gait speed
of the subject while using the walker without
inducing any artificial motion patterns that could
bias the final results.
Height of the forearm-support is the other
parameter that has been established. It should be
equal to height measured between the elbow of the
user and the ground, trying to force an upright
posture.
All subjects (thirteen osteoarthritis patients and
thirteen normal subjects) were barefoot and asked to
walk three times along a pre-defined 8.9 meters path
(see Figure 3).
Figure 3: Trajectory that user’s performed with the walker.
AssessmentofWalker-assistedHumanInteractionfromLRFandWearableWirelessInertialSensors
145

2.2.3 Human-Walker Interaction
and Temporal Distance Parameters
Calculation
The parameters described in this section are
presented in Figure 4 and surveyed in Table 1.
The human-walker interaction parameters consist
on: Distance between the user body center point
(BCP) and the walker (d), Angle of BCP orientation
relatively to the walker (
), Angle between linear
velocity vector and human-walker interaction line
(
), Angular velocity of the user (wh), Linear
velocity of the user (vh) (Table 1).
Spatiotemporal parameters of gait were also
determined, which reflect the dynamic activity
during human walking: gait cycle (G), identification
of stance (ST) and swing phases (SW), steps length
(SL) and cadence (CAD). The selection of these
parameters was based on previous studies (Debi,
2009;Debi,2011;Elbaz,2011)that compared knee OA
subjects with healthy ones walking without
assistance. In those studies it was suggested that
spatiotemporal parameters are sufficient to evaluate
and manage the knee OA disease. Results of these
studies state that patients with knee OA walk slower;
have a shorter step length; shorter swing phase and
consequent longer stance phase.
Table 1: Human-walker interaction and spatiotemporal
parameters.
Variable Sensor
Human-Walker
Interaction
Parameters
Distance between
the BCP and the
walker
d LRF
Angle of BCP
orientation in
relation to the
walker
θ LRF
Angle between
linear velocity
vector and human-
walker interaction
line
Φ
LRF +
IMU
Angular velocity
of the user
wh IMU
Linear velocity of
the user*
Vh LRF
Spatiotemporal
Parameter
Gait cycle G LRF
Stance Phase ST LRF
Swing Phase SW LRF
Step Length SL LRF
Cadence CAD LRF
* Linear velocity of the user will be also considered as
Spatiotemporal parameter.
The detection and calculation methods of these
parameters are described in the next subsections.
i. Distance between the user’s BCP and the
walker (d) and Angle of BCP orientation in relation
to the walker (θ): The applied detection method of
the legs to calculate the position of the BCP, is based
on the work developed in (Lee et al., 2011). The
detection algorithm is divided into four basic tasks:
pre-processing of data, detection of transitions,
pattern’s extraction and estimation of the
coordinates of the legs. In the pre-processing phase
it is performed the delimitation of the region of
interaction. Then, in the detection of transitions
phase it is analyzed the performed laser scanning
and seeks to identify transitions that exceed a certain
threshold. In Figure 5a it is presented a situation
where four transitions are found (indicated by
arrows). These transitions are then stored. Finally,
the coordinates of each leg are estimated and the
algorithm starts to estimate the BCP. This, in turn, is
accomplished by taking the midpoint of the segment
that joins the coordinates of the legs, as illustrated in
In Figure 5b by the cross.
Thus, this algorithm detects the two legs, and the
midpoint of the segment that joins the coordinates of
Figure 4: Scheme of the interaction parameters. Variables
are defined in Table I. Black circle represents user’s BCP
and the yellow box represents the LRF sensor.
a) b)
Figure 5: a) Detection of transitions: 4 transitions; b)
Illustration of the CoM estimation (its location (x,y),
distance between user-walker (d) and orientation (θ)).
the legs is calculated as the BCP position. With this
information, one can know the coordinates (x,y) of
NEUROTECHNIX2013-InternationalCongressonNeurotechnology,ElectronicsandInformatics
146
the BCP, and consequently the distance (d)
orientation (θ) that the user is from the walker.
ii. Angle between linear velocity vector and human-
walker interaction line (ϕ), Angular velocity of the
user (wh): The IMU placed on the user’s CoM
provides for the user’s orientation (ψ). The IMU
placed on the walker provides for the walker’s
orientation (ψ’). From these two angles and θ one
determines (ϕ). Finally, the angular velocity (wh) is
obtained from the gyroscope located in the user’s
IMU.
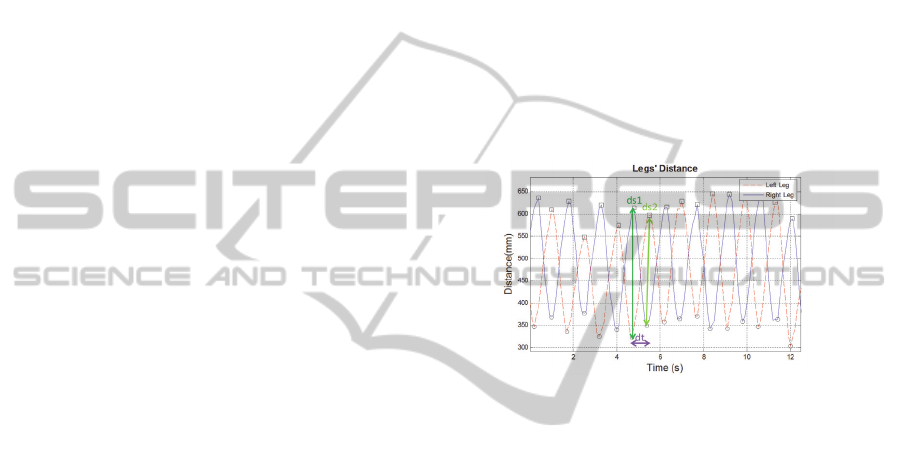
iii. Linear velocity of the user (vh): This
parameter is the rate of change of the position of a
leg detected by the LRF and is given by:
vh = (ds1+ds2)/dt, (1)
where ds1 and ds2 are the peak-to-peak
amplitudes between two legs of the acquired LRF
sensor signal and dt is gait cycle time. Figure 6
illustrates these variables.
iv. Spatiotemporal parameters: Stance phase
(ST) (swing phase (SW)) begins (ends) when the
foot contacts with the ground and ends (begins)
when the same foot leaves the ground. Gait cycle
consists on the sum of stance and swing phases time.
In order to estimate these two parameters, it is
necessary to detect the foot strike moments during
each cycle. For the LRF signals, these correspond to
the minimum values (dots in Figure 6). In a step
cycle, the stance phase corresponds to the signal
going from the minima to the maxima. The swing
phase is the rest of the cycle.
The step length is the distance (in meters)
between a specific point of one foot and the same
point of the other foot. For the LRF signal, this is
calculated as the difference between the maximum
of one leg and the minimum of the other leg in the
same instant of time, i.e, it corresponds to ‘ds1’, for
example, in Figure 6.
The cadence is defined as the rhythm of a
person’s walk and is expressed in steps per minute
(step/min).
2.2.4 Statistical Methods
The spatiotemporal parameters were considered for
repeated measures ANOVA to test for significance.
A mixed design was used, with within-subjects of
direction (Forward/Curve) and a between-subjects
factor of type of subject (Healthy/Patient). The level
of significance was set at 5%.
3 RESULTS AND DISCUSSION
The values summarized in Table 2 represent the
average value of the calculated Spatiotemporal
parameters of each individual, as well as the distance
(d) human-walker interaction parameter. For the
patients (PTs), the values were calculated based on
the signal of the leg that suffers the most with
osteoarthritis. In the case of healthy individuals
(HIs), the right leg was the one analyzed (no criteria
of choice was used, since they are considered
symmetrical).
In both groups (PTs and HIs) the parameters
were separated by direction. This separation gives
the information of how they can be affected when
the user is changing his direction, by performing a
curve after going forward.
Figure 6: LRF sensor signal of the user’s distance to the
walker. The dots indicate the minimum points that
correspond to foot strike events.
Figure 7 shows the acquired LRF and IMU signals,
while one of the PTs (PT #3) walks with the walker
following the pre-defined path. ‘ψ Angle’ and
‘Angular Velocity’ represent the signals read by
IMUs placed both on the walker and PT. ‘Legs
Distance’ graph illustrates the distance of both PT
legs from the walker and ‘Legs Orientation’ shows
the orientation of each leg relatively to the walker.
‘Human linear velocity (vh)’, ‘Human and
Walker Orientation’ and ‘θ and ϕ’ graphs depict data
calculated from the previous graphs only when the
legs of the PT crossed (this event is represented by
circles in the previous graphs) and they are
represented in strides and steps to better analyze
them. It is noteworthy that these graphs present
discontinuities since they are calculated in the
specific event of crossing legs.
In the following subsections it will be presented
and discussed these results in detail.
3.1 Spatiotemporal Parameters
In the ‘Legs Distance’ graph in Figure 7, the
diamonds and crosses identify the beginning and end
AssessmentofWalker-assistedHumanInteractionfromLRFandWearableWirelessInertialSensors
147

of stance, respectively. These instants allowed
calculating spatiotemporal parameters, as shown in
Figure 6 an
d explained in section 2.2.3.
By analysing Table 2, it is possible to verify that
PTs present longer duration of stance, slower
velocity and shorter step length than HIs. This is in
accordance with the results presented in (Debi et al.,
2009; Debi et al., 2011; Elbaz et al., 2011), where a
complete evaluation and comparison of
spatiotemporal parameters was made between knee
OA patients and healthy subjects without assistance.
In addition, PTs tend to be closer to the walker
than HIs. This happens since PTs tend to be more
supported on the walker, in order to feel more
comfortable, safe and to alleviate knee pain. HIs
tend to be more deviated from the walker since they
do not need an extra support to walk.
Since this study intends to compare the
spatiotemporal parameters between the two types of
subjects, PTs and HIs, and between two types of
direction, forward and curve, it was made a repeated
measures ANOVA to test for significance.
Gait cycle (G) does not present main changes
due to direction (p=0.252) and type of subject
(p=0.655) and no significant interactions between
direction and type of subject (p=0.222). However, it
tends to increase in HIs and decrease in PTs. This
happens because, when HIs perform a curve they
prolong their step; and PTs tend to reduce their time
with the feet on the ground, increasing the number
of steps.
Stance (ST) and Swing (SW) also do not present
main changes due to direction (p=0.644/p=0.640)
and type of subject (p=0.935/p=0.931) and no
significant interactions between direction and type
of subject (p=0.316/p=0.317).
Despite the lack of statistical significance, one
can observe that PTs present lower ST duration and
higher SW duration when compared with HIs. This
was expected since in (Debi et al., 2009; Debi et al.,
2011; Elbaz et al., 2011)the SW was highlighted as
an objective parameter in the comprehensive
evaluation of a PT. They referred that SW may serve
as a simple follow-up measurement in patients with
OA. This importance is given because a knee OA
patient attemptstoavoidpainwhilewalkingby
decreasingloadsfromtheaffectedjoint.However,
SW parameter has no statistical significance in the
current study with assisted gait. This means that as
PT is better supported with the walker, he feels less
pain when loading the affected joint, achieving to
spend more time with the feet on the ground. This
explains the little difference of SW that exists
between PTs and HIs.
One can also observe that PTs tend to have lower
ST and higher SW when performing a curve in
comparison with the forward direction. These events
are opposite to what happens with HIs and can be
related to the confidence and sense of security HIs
have when manoeuvring the walker. So, this
decrease of ST (and consequent increase of SW) in
PTs can be related to the difficulty that PTs have
when performing a curve. Some of them complained
to feel more pain on the knee and some confusion.
Thus, they tend to support less time the foot on the
ground, becoming more suspended on the walker
(this was also observed in the gait cycle parameter).
Cadence (CAD) is a parameter that also presents
no main changes due to direction (p=0.415) and type
of subject (p=0.519) and no significant interactions
between direction and type of subject (p=0.174).
However, this parameter tends to decrease in HIs
cases, and increase, in PTs cases, when performing a
curve. As it was already discussed, when performing
a curve, PTs tend to increase the number of steps
and decrease their length.
The velocity parameter (vh) shows to be affected
by direction (p=0.010), but not to type of subject
(p=0.264). It also does not present significant
interactions between direction and type of subject
(p=0.140). So, this means that all subjects reduced
their vh when performing a curve. Since it is a
change in the path and more difficult to perform than
to walk in straight line, it is understandable that
subjects tend to reduce their velocity.
Step length (SL) is affected by within-subjects
factor (p=0.014) and between-subjects factor
(p=0.000), as well as their interaction (p=0.016).
The distance to the walker (d) is affected by the type
of subject (p=0.017) and by the interaction between
direction and type of subject (p=0.036). However, it
does not present main changes due to direction
(p=0.477).
PTs tend to observe before walk when a curve
appears, i.e. first they turn the walker and then they
follow it. This causes an increased deviation from
the walker (increases d) and a consequent increase
of SL.
So, these spatiotemporal parameters, vh, SL and
d, are important to be analyzed in these two
situations. They can objectively inform about the
level of difficulty and sense of security that PTs with
osteoarthritis sense when maneuvering the walker,
and this will depend on: comfort to guide the walker;
pain on the knee, which influences the type of curve
(close or open curve); and security and confidence
on the device.
It can also be possible to differentiate between
PTs and HIs by analyzing d and SL.
This is not in accordance with previous studies
(Debi et al., 2009; Debi et al., 2011; Elbaz et al.,
2011)where SW was recommended as an objective
parameter to evaluate the degree of knee pain. Since
the current study evaluated OA patients walking
NEUROTECHNIX2013-InternationalCongressonNeurotechnology,ElectronicsandInformatics
148

with assistance, the conditions changed as the
patient has now an extra support that helps in
alleviating pain. By this SW values do not differ
significantly from the healthy subjects.
Table 2: Spatiotemporal parameters of walker-assisted
gait. Average±Standard Deviation values.
Subj.
PT HI
Direction Forward Curve Forward Curve
G (s) 1,52±0,160 1,51±0,256 1,51±0,028 1,63±0,057
ST (%) 58,06±6,535 56,72±7,395 55,33±2,350 58,89±1,922
SW (%) 41,92±6,531 43,24±7,388 44,67±2,354 41,11±1,922
SL (m) 0,22±0,046 0,21±0,032 0,37±0,062 0,31±0,0455
vh (m/s) 0,32±0,158 0,3±0,147 0,44±0,061 0,39±0,047
CAD
(step/min)
79,54±7,895 81,01±13,146 79,13±0,01 73,15±2,547
d (m) 0,44±0,052 0,46±0,053 0,55±0,067 0,53±0,051
3.2 Human-walker Interaction
Parameters
In the ‘ψ Angle’ graph of Figure 7, one can see that
the IMU’s signals provide information about the PT
movement. He is going in straight line and then at
t=1s, he begins to make a curve. Then, at t=3s, he
goes again straight and makes a curve, at t=5s, for
the other side until t=8s. From t=8s to t=10s, he
continues to walk forward and straight.
The ‘Angular Velocity’ graph (Figure 7)
indicates that he increases (in absolute) its angular
velocity (wh) when he starts to curve, by analyzing
the same instants of time as previously.
Therefore, these two parameters can be used to
correctly detect the path that the user is following. In
‘Legs Distance’ graph (Figure 7), one can see that is
hard to distinguish between going forward and
making a curve. However, it can be noticed that
maximum values of right leg are reduced when PT
makes the first curve (t=1s to t=3s). However, this
change is not perceptible or significant in the second
curve.
After observing ‘Legs Distance’ signals from all
the patients, it was concluded that there is a great
variability on this signal. Which means that PTs can
perform a curve in different manners: some hide one
leg; others fend off the legs, or bring them together.
‘Legs Orientation’ (Figure 7) also presents small
changes during the time PT is performing a curve
(t=[3 4]s and t=[5 8] s). Once again, this signal
presents a great variability through PTs.
A possible solution to increase the effects of
making a curve on the LRF signal would be to put
the LRF up to the foot’s height, to detect their
direction. However, this is not possible to detect
with LRF sensor, because the signal becomes
distorted and poor of information. So, the utilization
of a camera, for example, could be a good solution
to detect the feet’s direction.
Thus, LRF sensor is good to detect
spatiotemporal parameters, as it was analyzed
before, but not too good to detect intention of
changing direction.
Moreover, LRF sensor is essential to detect when
legs are crossing with each other (identified by
circles on the graphs). This is an important event to
detect BCP position, since in these instants it is the
midpoint between the legs.
So, Human-Walker Interaction parameters can be
calculated every time the legs cross and are
represented in Figure 7.Distance between the user
and the walker (d) is acquired by the ‘Legs
Distance’ signal and it is marked with circles. Angle
of BCP orientation in relation to the walker (θ) is
acquired by the ‘Legs Orientation’ signal, being the
midpoint between each leg orientation, and is
represented in ‘θ and ϕ’ graph. Angle between linear
velocity vector and human-walker interaction line
(ϕ) is calculated by the sum of ϕ angle of walker and
ψ angle of human, both represented in ‘ψ Angle’
graph and θ. This angle is represented in ‘θ and ϕ’
graph by the designated signal ‘ϕ’. Angular velocity
of the user (wh) are the points marked with a circle
in the ‘Angular Velocity’ graph . Linear velocity of
the user (vh) depends on the time that the user takes
to complete a stride (two steps) and is shown in
‘Human Linear Velocity’ graph.
Looking at ‘Human Linear Velocity’ graph
(Figure 7), one can see that vh decreases when
making a curve, which is in accordance with
previous discussion.
Through ‘Human and Walker Orientation (ψ)’
(Figure 7), one can see that the walker turns first
than the human. This could indicate that the
intention of command is transmitted by the upper
limbs. This needs to be further studied by placing a
rotating handlebar with integrated IMU or force
sensors.
In ‘θ and ϕ’ graph (Figure 7), one can see that ϕ
is better to identify, with significant variability, the
orientation of the subject when compared with θ.
In conclusion, the Human-Walker Interaction
parameters, in the overall are correctly detected and
can describe the interaction between the PT and the
walker.
AssessmentofWalker-assistedHumanInteractionfromLRFandWearableWirelessInertialSensors
149
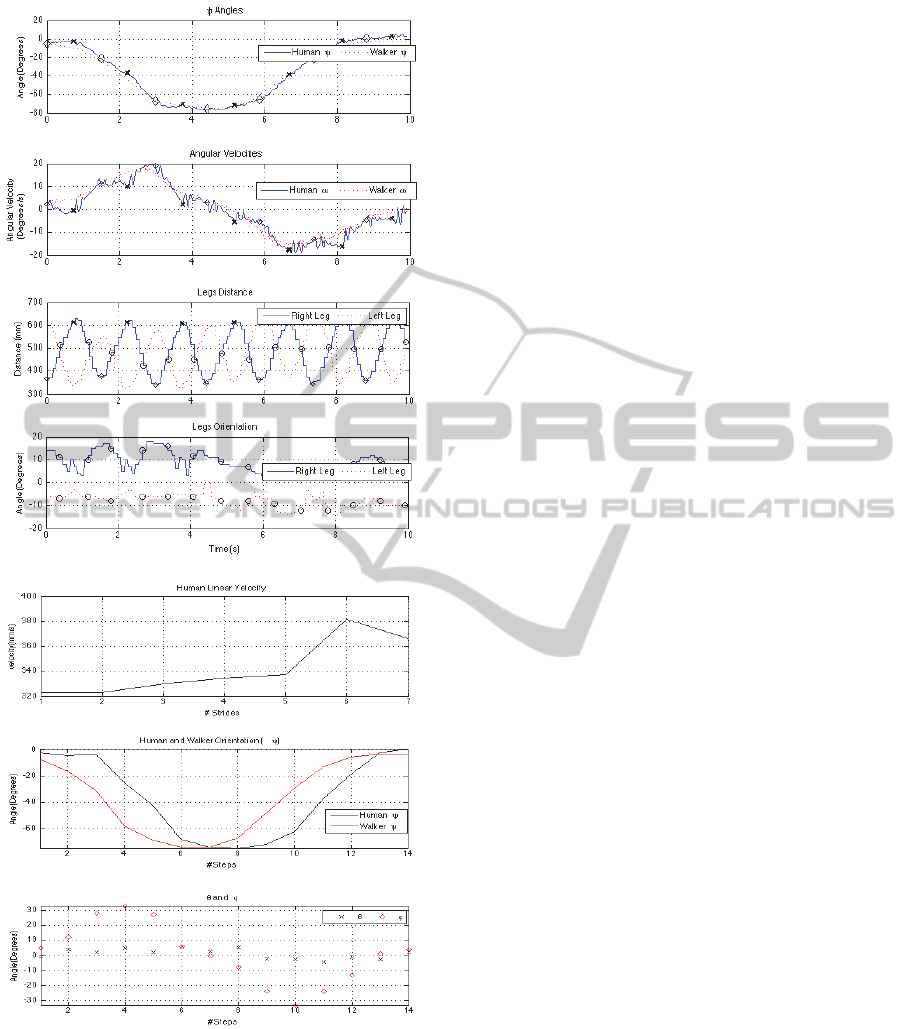
Figure 7: Human-Walker Interaction measurements with
data acquisition systems.
4 CONCLUSIONS
In the literature there are few studies of walker-
assisted biomechanics, especially regarding walkers
with forearm supports, and there are none describing
human-walker interaction nor gait evaluation
regarding type of direction In relation to
spatiotemporal parameters, the analysis has shown
that 1) velocity, step length and distance to the
walker are significantly affected by the change of
direction, and 2) distance to the walker nd step
length can distinguish between healthy subjects and
patients with osteoarthritis. The Human-Walker
Interaction parameters were correctly detected. LRF
signals can detect the necessary event (when legs are
crossing) to calculate them. However, is necessary,
in further studies, to develop an algorithm, like the
one in (Lee et al., 2011), to track the PT’s legs.
Afterwards, it is intended to advance for the
development of a control strategy with these
parameters and based on the cinematic of the walker
illustrated in Figure 4.
The difficulty in human commands acquisition
for the development of a control strategy is to find a
parameter that can give the information of user’s
orientation, to then detect the orientation commands
(go to the left/right).
Hence, this control should be based on the
minimization of ϕ (should tend to zero), since it was
concluded that this parameter can detect PT’s
orientation. However the authors are not sure if it is
the correct parameter to estimate a change of
direction, since PTs demonstrate to first use the
upper limbs to transmit that command. This problem
will be analysed in further studies.
ACKNOWLEDGEMENTS
This work is financed by FEDER Funds and through
Programa Operacional Fatores de Competitividade
– COMPETE and by National Funds through FCT -
Fundação para a Ciência e Tecnologia under the
Project: FCOMP-01-0124-FEDER-022674. Work
supported by Portuguese Science Foundation (grant
SFRH/BD/76097/2011). The Brazilian National
Council for Scientific and Technological
Development (CNPq) supported this work (Process
# 471804/2012-6).
REFERENCES
Altman R., Asch E, Bloch D., Bole G, Borenstein D,
Brandt K., Christy W., Cooke T. D., Greenwald R.,
Hochberg M, et al. Development of criteria for the
classification and reporting of osteoarthritis.
Classification of osteoarthritis of the knee. Diagnostic
and Therapeutic Criteria Committee of the American
NEUROTECHNIX2013-InternationalCongressonNeurotechnology,ElectronicsandInformatics
150

Rheumatism Association. Arthritis Rheum. 1986
Aug;29(8):1039-49.
Bateni, H., Maki B: Assistive devices for balance and
mobility: benefits, demands and adverse
consequences. Arch Phys Med Rehabil vol 86, jan
2005. Pp 134-144.
Cifuentes, C., Gentiletti, G., Suarez, M. J., Rodríguez, L.
E., “Development of a Zigbee platform for
bioinstrumentation,” in Proceedings of the 2010
Annual International Conference of the IEEE
Engineering in Medicine and Biology Society, 2010,
pp. 390-393.
Debi R., Mor A., Segal O., Segal G., Debbi E., Agar G.,
Halperin N, Haim A, Elbaz A. Differences in gait
patterns, pain, function and quality of life between
males and females with knee osteoarthritis: a clinical
trial. BMC Musculoskelet Disord. 2009 Oct 13;10:127.
doi: 10.1186/1471-2474-10-127.
Debi R., Mor A., Segal G., Segal O., Agar G., Debbi E.,
Halperin N, Haim A, Elbaz A. Correlation between
single limb support phase and self-evaluation
questionnaires in knee osteoarthritis populations.
Disabil Rehabil. 2011;33(13-14):1103-9. doi:
10.3109/09638288.2010.520805. Epub 2011 Jan 5.
Elbaz A., Mor A., Segal O., Agar G., Halperin N., Haim
A, Debbi E, Segal G, Debi R. Can single limb support
objectively assess the functional severity of knee
osteoarthritis?. Knee. 2012 Jan;19(1):32-5. doi:
10.1016/j.knee.2010.12.004. Epub 2011 Jan 26.
Frizera A., Gallego J. A., Rocon E., Pons J. L, Ceres R.:
Extraction of user’s navigation commands from upper
body force interaction in walker assisted gait.
Biomedical Engineering Online 2010, 9(1):37.
Kuan-Ting Yu; Chi-Pang Lam; Ming-Fang Chang; Wei-
Hao Mou.; Shi-Huan Tseng; Li-Chen Fu. An
Interactive Robotic Walker for Assisting Elderly
Mobility in Senior Care Unit, 2010.
Lee, G., Jung, E., Ohnuma, T., Chong ,N., Yi, B. JAIST
Robotic Walker Control Based on a Two-layered
Kalman Filter. IEEE International Conference on
Robotics and Automation, Shangai, China, 2011, pp.
3682–3687.
Martins, M., Frizera, A., Santos, C., Ceres, R..
(2011).Assistive Mobility Devices focusing on Smart
Walkers: Classification and Review. Robotics and
Autonomous Systems. DOI: 10.1016/j.robot.
2011.11.015.
Ochi, Y.; Terashima, K.; Kubo, K.; Miyoshi, T.Tracking
control to human gait of lift-type walking assist robot
using range sensor. Proceedings of the 14th
International Conference on Climbing and Walking
Robots and the Support Technologies for Mobile
Machines, 2011.
AssessmentofWalker-assistedHumanInteractionfromLRFandWearableWirelessInertialSensors
151
