
Experimental Study of the Magnetohydrodynamic (MHD) Effect with
Respect to Intracardiac ECG Signals
W. B. Buchenberg
1
, G. Hoppe
1
, R. Lorenz
1
, W. Mader
2
, P. Laudy
3
, C. Bieneck
4
and B. Jung
1
1
Dept. of Radiology, Medical Physics, University Medical Center, Freiburg, Germany
2
Freiburg Center for Data Analysis and Modeling, Albert-Ludwigs-University, Freiburg, Germany
3
CardioTek B.V., Maastricht-Airport, Netherlands
4
R&D, Schwarzer GmbH, Heilbronn, Germany
1 OBJECTIVES
To assess the status of the cardiac electrical system
for diagnosis and therapy, electro-physiologic (EP)
studies are an important tool for diagnosis and
therapy in patients with electrophysiological
disorders (Josephson, 2008); (Schneider, 2005).
Electrode catheters are inserted into the heart and
guided to the location of interest using X-ray
fluoroscopic images. Hence, the patient and the
investigator are exposed to X-rays and might
accumulate a high radiation dose. Therefore, it is of
great interest to use different imaging modalities
such as Magnetic Resonance Imaging (MRI) for
catheter guidance. However, the surface
electrocardiogram (ECG) signal is strongly affected
by the magnetohydrodynamic (MHD) effect
(Tenforde et al., 1983), (Tenforde, 2005); (Gupta et
al., 2008). Charged particles of an electrical
conductive fluid such as blood with a velocity
component v
z
perpendicular to the external magnetic
field B
0
are deflected by the Lorentz force F
L
. This
charge separation gives rise to a potential across the
great vessels. At the level of intracardiac catheter
use, the potential can be defined as U
MHD
= v
z
·d B
0
,
where d denotes the electrode distance. However,
only limited knowledge is available for intracardiac
ECG signals with respect to the MHD effect. A
recent animal experiment reported altered EP signals
inside the MR scanner (Tse et al., 2012). Therefore,
intracardiac signals acquired in a MR environment
have to be investigated in detail to characterize the
alteration caused by the MHD effect in order to
provide diagnostically valuable data.
The aim of this work is to establish an
experimental setup with common EP equipment to
simulate the MHD effect in a model system and to
analyse the pure MHD signal.
2 METHODS
All measurements were performed on a 1.5 T MR
scanner (Symphony, Siemens/Erlangen, Germany).
A closed flow circuit was established at the MR
scanner table (Figure 1b) and filled with a distilled
water-sodium-chloride mixture (electrical
conductivity at 23±1°C: 5.33±0.18 mS/cm) to
simulate the electrical conductivity of blood. A MR-
compatible Ventricular Assist Device (VAD)
(MEDOS, Stolberg, Germany) connected to a u-
shaped tube phantom (inner diameter: 22.1 mm) was
used for mimicking the pulsatile flow of the beating
heart (50 bpm). The tube was constructed using a
rapid prototyping method. A standard sized 6F EP
catheter (St. Jude Medical, Minnesota, USA) was
placed into a slit in the phantom wall (Figure 1a).
The slit allows for reproducible positioning of the
catheter as well as assuring the electrodes are
stationary. As shown in the upper schematics of
Figure 1a, d between the first two electrode pairs
(1/10, 2/9) are about equal, whereas d decreases
continuously from pairing 3/8 to 5/6. The EP
catheter is connected to a pre-amplifier (EP-Tracer,
CardioTek B. V., Netherlands) for measuring
potentials in the mV-range. A laptop was connected
for data registration. The electrodes of the surface
ECG were connected to the liquid as well as to the
ground to provide a reference for the pre-amplifier.
Bipolar measurements were carried out using the
lowest cut-off frequency (0.05 Hz) of the high-pass
hardware filters of the EP-Tracer.
3 RESULTS
Figure 2 shows representative curves of the MHD-
effect during pulsatile flow in a 1.5 T MR scanner.
The signal of electrodes 1/10 is smaller than the one
B. Buchenberg W., Hoppe G., Lorenz R., Mader W., Laudy P., Bieneck C. and Jung B..
Experimental Study of the Magnetohydrodynamic (MHD) Effect with Respect to Intracardiac ECG Signals.
Copyright
c
2013 SCITEPRESS (Science and Technology Publications, Lda.)
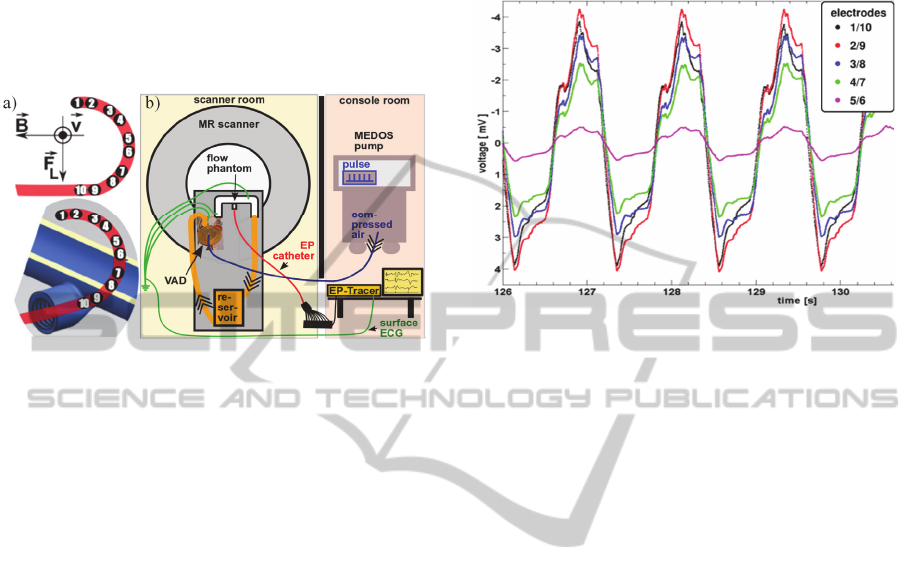
between the electrodes 2/9. However, this deviation
is within the limits of the experimental accuracy. A
linear decrease of the potential with a decrease in d
is observed (not shown). Additionally, it is important
to note the underlying unknown shift and scaling of
the voltage signal in the vertical direction. This is
due to the impact of the high pass filter of the pre-
amplifier on the MHD signal.
Figure 1: EP catheter positioning in the phantom and its
orientation with respect to the flow velocity v, the external
magnetic field B, and the Lorentz force F
L
(a), and
experimental setup (b).
4 DISCUSSION
The investigation of MHD potentials detected with
common EP equipment is important for developing
EP exam procedures in a MR environment.
Therefore, a MRI compatible flow circuit was
successfully established. The linear dependency
between the measured potential and d (as well as B
0
,
both not shown) predicted by theory was clearly
observed and validates the model system. Typical
electrode distances as between the electrodes 5/6
revealed a significant MHD potential which cannot
be neglected. The non-conductive walls of the flow
phantom are not expected to bias the outcome of the
measurement significantly since studies revealed
that vessel wall conductivity may be neglected
(Abdallah et al., 2008). Further investigations will
analyse the impact of different recording modalities
such as hardware filters on the detection of the MHD
signal. Furthermore, glycerol will be added to the
saltwater for simulating the viscosity and the density
of blood.
The time course of MR velocity data at the
catheter position (not shown) agrees very well with
the EP-Tracer data (apart from filter effects). Hence,
additional simple and quick MR flow measurements
at the location of interest during an EP exam may be
used to remove the MHD related potential from
intracardiac ECG signals representing an essential
step towards diagnostically valuable data.
Additionally, in vivo data, e.g. from animal models,
is required for the validation of these methods.
Figure 2: MHD potential time course.
ACKNOWLEDGEMENTS
EUROSTARS Program Grant #01QE1004D.
REFERENCES
Abdallah, D. A., Drochon, A., Robin, V., Fokapu, O.,
2008. Magnetohydrodynamic flow of blood: Influence
of the simplifying assumptions in calculations. J. of
Biomechanics 41 (S1), S269.
Gupta, A., Weeks, A. R., Richie, S. M., 2008. Simulation
of elevated T-waves of an ECG inside a static
magnetic field (MRI). IEEE transactions on
biomedical engineering 55 (7), 1890-96.
Josephson, M. E., 2008. Clinical cardiac electro-
physiology techniques and interpretations, Lippincott
Williams & Wilkins. Philadelphia, 4
th
edition.
Schneider, Ch., 2005. Das EPU-Labor, Steinkopff Verlag.
Würzburg.
Tenforde, T. S., Gaffey, C. T., Moyer, B. R., Budinger, T.
F., 1983. Cardiovascular alterations in Macaca
monkeys exposed to stationary magnetic fields:
Experimental observations and theoretical analysis.
Bioelectromagnetics 4, 1-9.
Tenforde, T. S., 2005. Magnetically induced electric fields
and currents in the circulatory system. Progress in
Biophysics & Molecular Biology 87, 279-288.
Tse, Z. T. H., Dumoulin, C. L., Watkins, R., Byrd, I.,
Schweitzer, J., Kwong, R. Y., Michaud, G. F.,
Stevenson, W. G., Schmidt, E. J., 2012. MRI-
compatible voltage-based electro-anatomic mapping
system for cardiac electrophysiological interventions.
In 20
th
ISMRM, oral presentation #206.
