
TURNING ARTIFICIAL NEURAL NETWORKS
INTO A MARKETING SCIENCE TOOL
Modelling and Forecasting the Impact of Sales Promotions
Ibrahim Zafar Qureshi
Institute Risk Analyst, Allied Bank Limited, Karachi, Pakistan
Marwan Khammash, Konstantinos Nikolopoulos
Division of Business Studies, Bangor Business School, Bangor, Gwynedd, U.K.
Keywords: Forecasting, Promotions, Marketing, Artificial neural networks.
Abstract: In this study we model the effect of promotions in time-series data and we consequently forecast that
extraordinary effect via Artificial Neural Networks (ANN) as implemented from the Expert Method of a
popular Artificial Intelligence software. We simulate data considering five factors as to determine the actual
impact of each individual promotion. We consider additive and multiplicative models, with the later
presenting both linear and non-linear relationships between those five factors; in addition, we superimpose
either low or high levels of noise. Our empirical findings suggest that, for nonlinear models with high level
of noise, ANN outperform all benchmarks. Standard ANN topologies work well for models with up to two
factors while the Expert method provided by the software works well for higher number of factors.
1 INTRODUCTION
Marketing modelling has used over the years many
techniques, methods and applications derived from
management science and psychology among other
sciences. However, the complexity and richness of
marketing science data make them an ideal
candidate for analysis on the hands of Artificial
Intelligence techniques, especially in the 21
st
century
where computational power made such an exercise
feasible.
In this preliminary study we first model the
additive effect of promotions in time-series data
considering five factors: Budget, Duration, Media,
Perceived Benefit and Price Change, while the order
of the factors does no indicate any hierarchy of
importance. Consequently we forecast that
extraordinary effect via Artificial Neural Networks
(ANN) is implemented from the Standard and
Expert Method of a popular Artificial Intelligence
software. We simulate data considering both
additive and multiplicative models, with the later
presenting both linear and non-linear relationships
between those five factors; in addition, we
superimpose either low or high levels of noise.
We believe this is a realistic representation of
field-data for promotional activity and aspire in
further research to replicate and corroborate the
findings of this study via empirical evidence on real
data.
The rest of the study is as follows: a short
description of the problem under consideration is
provided, followed by the presentation of the
simulated data. Section four provides the empirical
findings while the last section communicates the
main findings of this research.
2 THE PROBLEM
Sales promotions are short-term incentives used to
increase sales of products. Spending on promotions
represents a major share of marketing budgets for
most consumer goods. Many products are sold today
with a percent of sales volume focused on ‘deals’.
Moreover, the use of promotions is spreading to
other marketing situations. Pharmaceutical
companies often offer drug stores discounts and free
goods; durable manufacturers (automobiles, TV sets,
phones, etc) use discounts and industrial
698
Qureshi I., Khammash M. and Nikolopoulos K..
TURNING ARTIFICIAL NEURAL NETWORKS INTO A MARKETING SCIENCE TOOL - Modelling and Forecasting the Impact of Sales Promotions.
DOI: 10.5220/0003292306980702
In Proceedings of the 3rd International Conference on Agents and Artificial Intelligence (ICAART-2011), pages 698-702
ISBN: 978-989-8425-40-9
Copyright
c
2011 SCITEPRESS (Science and Technology Publications, Lda.)

manufacturers offer temporary price reductions to
their distributors.
A wide body of literature has focused on
understanding consumer response to the retailers’
promotion. Some researchers developed individual
choice models to measure the impact of promotions
on consumer choice (Kuehn and Rohloff 1967,
Ehrenberg 1972, Guadagni and Little 1983). Some
research has dealt with consumer stockpiling and
purchase acceleration to explain promotion sales
patterns (Shoemaket 1979, Battberg, Eppen and
Lieberman 1981).
Other researchers have considered brand
switching and the impact of promotions on repeat
purchases (Shoemaker and Shoaf 1977, Dodson,
Tybout and Sternthan 1978). A number of studies
looked at promotion response as consumer
segmentation variables (Blattberg and Sen 1976,
Blattberg, Buesing, Peacock and Sen, 1978)
3 THE DATA
In this study we used simulated data, constructed in
such a way so as to be as close as possible to real-
life data in respect for promotions of durable
products. We have followed the promotion profiles
described by Blattberg (1995) and Blattberg et al.
(1995).
3.1 Factors
For the productions of the simulated data in this
paper, five factors that influence the promotional
impact on sales such as Budget, Duration, Media,
Perceived Benefit and Price Change are being
considered. The order of the variables at this
moment does no indicate any level of importance.
The ranges used for each of the factors are the
following:
- Budget (B) ranges from 50 to 150 with each unit
to be equivalent to 1000€.
- Duration (D) ranges from 1 to 14 days.
- Media (M) is a categorical variable ranging from
1 to 4, where:
Table 1: Media factor.
Value Media Used
1 Newspaper
2 Newspaper + Radio
3 Newspaper + Radio + Internet
4 Newspaper + Radio + Internet + TV
- Perceived Benefit (PB): it is assumed that one of
the factors on which the success of the marketing
campaign is dependent is customer perception of the
product. This variable/factor is a gauge of the level
of benefit that the customers think he/she will get
from buying the product. Perceived Benefit is a
categorical variable ranging from 0 to 5, where 0
indicates that the customer does not think of any
benefit from buying the product, while 5 represents a
strong perceived benefit from buying the product.
- Price Change (PC): one of the main incentives
given to customers in a marketing campaign is a
reduction of the product price. This increases its
demand and subsequently its related sales. Price
Change varies from -20 to 15. This is a percentage
change. A negative value represents a decrease in
price and a positive value represents an increase in
price. It is assumed that the price will decrease by up
to 20% giving a value of -20 and increase by up to
15% giving a value of 15. A decrease in price will
increase demand and an increase in price may
decrease demand. The negative effect of increasing
the price can be countered by an advertising effort.
3.2 The Models
Different models have been developed. The criteria
are listed below:
• A model must use all 5 variables with ranges as
defined for each of the variables.
• A model must give a final output for the impact
of the promotion in the range of -20 to 120 for all
possible values of the (explanatory) variables.
• A complete model will be composed of two sub-
models, one being the linear model and the other
being the non-linear model.
• The linear model can only use the “+” and the “-
” operators while the non-linear model can only use
any combination of “+”, “-” and “*”, “/” operators.
For situations were a variable is raised to a power of
s, this will be considered equivalent to the
multiplication by s times.
• The importance rating for each of the 5 variables
must be the same for both the linear and nonlinear
model i.e. when variables are ranked in order of
importance, both models must have the same order
allowing for a meaningful comparison of the sub-
models when the number of factors increases.
The final models that have been used for running
200 instances (combinations of
factors_to_be_included x Level_of_Noise x
Level_of_Linearity) – each simulated with different
TURNING ARTIFICIAL NEURAL NETWORKS INTO A MARKETING SCIENCE TOOL - Modelling and Forecasting
the Impact of Sales Promotions
699
seed 15 times via random number generations within
each factor’s range, resulting in 3000 simulations,
are as follows:
- Linear
PBDBMPC 65.13.116.072.065.1
with a range from -8.25 to 112.25
- Nonlinear
2
3
4.75
( (0.18 ) *(0.0118 0.035 ) 1.7 ) * 0.7 4
8
M
PC B D PB
with a range from -8.25 to 112.25
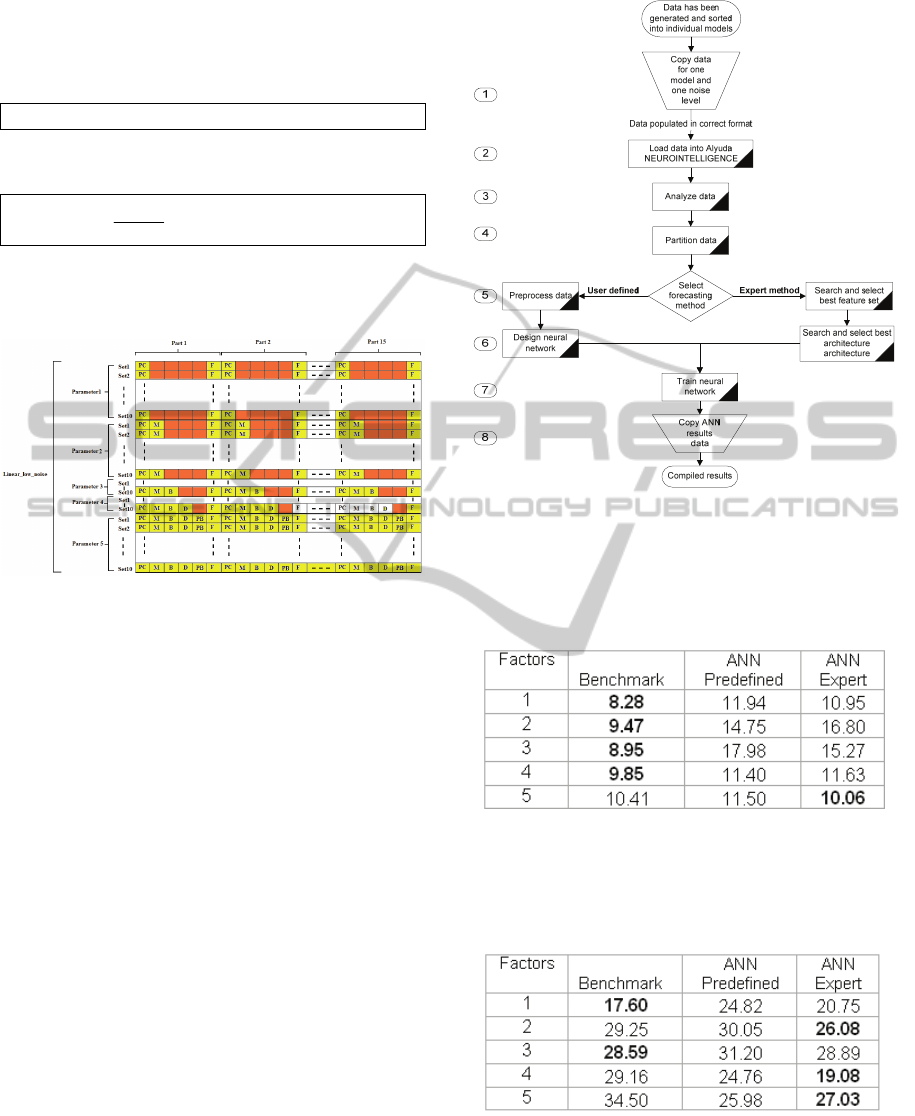
An example of the simulated data is given in the
following Figure 1:
Figure 1: Linear model - low noise.
4 RESULTS
Alyuda NeuroIntelligence software (www.alyuda.
com) has been used for the experiments. We used
the free evaluation version of the software that was
user-friendly and provided full automation, and fast
processing times. The software was used as
described in the following flow chart (figure 2).
We used the Mean Absolute Percentage Error -
MAPE (Makridakis et al 1998) and the Mean
Absolute Relative Percentage Error (MARPE) for
the evaluation of the provided forecasts. The
advantage MARPE has over MAPE is that it is not
affected by small actual values as the error is
measured relative to the maximum range of the
output function based on a certain number of
parameters. So the range of the output function and
the noise level both depend on the number of
parameters in the equation.
As a benchmark forecasting methods we used a
Multiple Linear Regression model (Makridakis et al
1998, chapter 6) including all the exploratory
variables.
Figure 2: Forecasting and analysing Data with the ANN
software.
4.1 Linear Function - Low Noise
Table 2: Results for Linear Function + Low Noise.
ANN is performing worse than the benchmark.
4.2 Linear Function - High Noise
Table 3: Results for Linear Function + High Noise.
Increasing the level of noise for a linear function
increases the uncertainty in the values and adds an
unexplained component. For 1 to 3 parameters there
is no clear better method. For larger number of
ICAART 2011 - 3rd International Conference on Agents and Artificial Intelligence
700
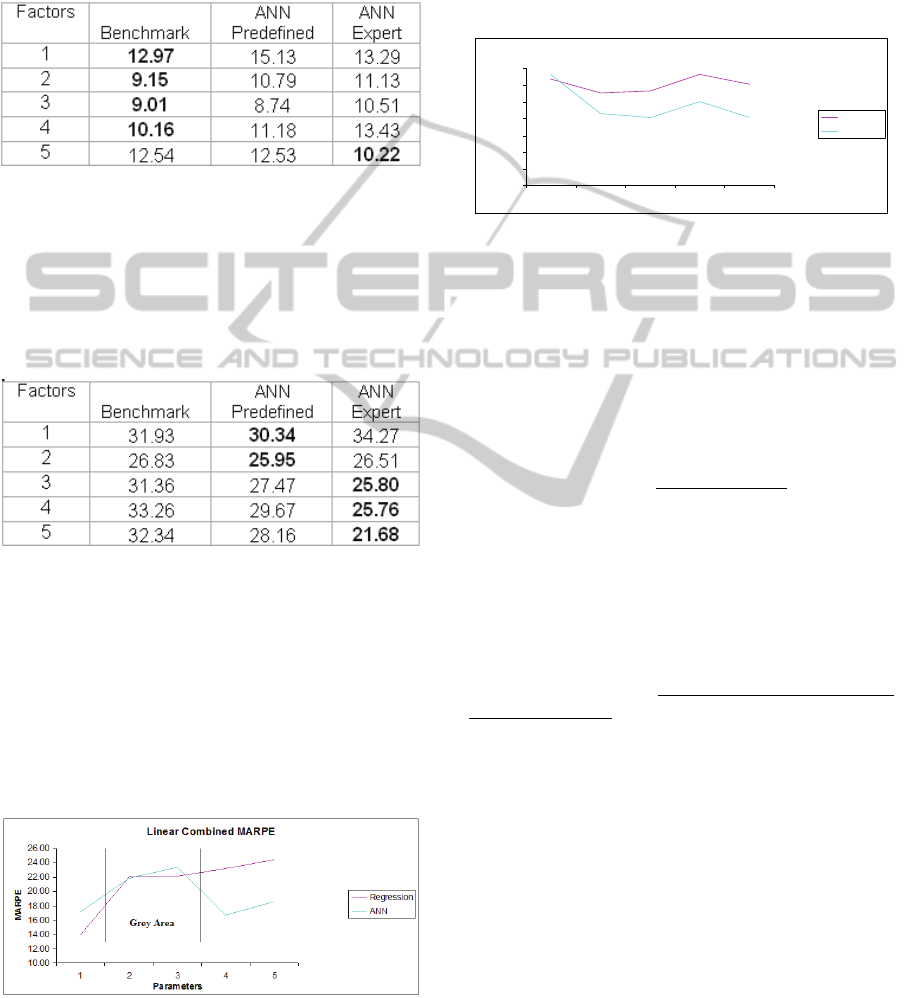
parameters i.e. 4 and 5, Alyuda expert method
performs the best.
4.3 Non-linear Function - Low Noise
Table 4: Results for Non-Linear Function + Low Noise.
The Benchmark performs better than all other
methods up to 4 parameters and Ayuda expert
method perform the best for equations with 5
parameters.
4.4 Non-linear Function - High Noise
Table 5: Results for Non-Linear Function + High Noise.
By increasing the noise for nonlinear functions,
the error has increased for all methods due to the
increased uncertainty involved with the original
data. For non-linear models, ANN methods
outperform all other methods. For models with up to
2 parameters, predefined ANN’s perform best and
for equations with 3 to 5 parameters, Alyuda Expert
method outperforms all other methods.
4.5 Linear Function
Figure 3: Effect of Linearity.
For linear models with 2 and 3 parameters, there
is no obvious best performing method. For linear
models with one parameter, regression is the best
method and for 4 and 5 parameters, ANN’s are the
best set of forecasting tools.
4.6 Non-linear Function
NonLinear Combined MARPE
10.00
12.00
14.00
16.00
18.00
20.00
22.00
24.00
12345
Parameters
MARP E
Regression
ANN
Figure 4: Effect of Non-Linearity.
For nonlinear models, the regression only
outperforms ANN’s for 1 parameter. For nonlinear
models with 2 to 5 parameters, ANN’s are clearly
the best forecasting tool.
5 CONCLUSIONS
Our empirical findings suggest strongly that:
For linear models, regression approaches
perform better for smaller number of parameters i.e.
between 1 and 3, while Alyuda expert method
performs better for larger number of parameters
between 2 and 5. This indicated a grey zone where
any one method could outperform the other between
parameters 2 and 3.
For nonlinear models – that is the most difficult
and complex problem, ANN approaches outperform
all other methods. Predefined ANN’s work well for
up to two parameters and Alyuda Expert method
works well for higher number of parameters.
REFERENCES
Blattberg, R. C., Briesch, R. and Fox, E. J., 1995. How
Promotions Work, Marketing Science 14(3): 122-132.
Blattberg, R. C., 1995. Sales Promotion: Concepts,
Methods, and Strategies, Prentice Hall.
Makridakis, S., Wheelwright, S. C. and Hyndman, R. J.,
1998. Forecasting Methods and Applications, Wiley:
New York, 3
rd
Edition.
Kuehn, A. A. and A. C. Rohloff (1967), “Evaluating
Promotions Using A Brand Switching Model,” in
Promotional Decisions Using Mathematical Models.
TURNING ARTIFICIAL NEURAL NETWORKS INTO A MARKETING SCIENCE TOOL - Modelling and Forecasting
the Impact of Sales Promotions
701

Patrick Robinson (Ed.), Boston: Allyn & Bacon, Inc.,
50-85.
Ehrenberg, A. S. C. (1972), Repeat Buying: Theory and
Applications. Amsterdam: North-Holland.
Guadagni, P. and J. Little (1983), “A Logit Model of
Coffee Choice Calibrated on Scanner Data” Marketing
Science, (Summer), 203-238.
Shoemaker, R. (1979), “An Analysis of Consumer
Reactions to Product Promotions” Proceedings of the
American Marketing Association, 246-248.
Battberg, G. Eppen and J. Lieberman (1981), “A
Theoretical and Empirical Evaluation of Price Deals
for Consumer Nondurables,’ Journal of Marketing, 45
(Winter), 116-129.
Shoemaker and F. R. Shoaf (1977), “Repeat Rates for
Deal Purchases,” Journal of Advertising Research, 17
(April), 47-53.
Dodson, J. A., A. M. Tybout and B. Sternthal (1978),
“Impact of Deals and Deal Retractions on Brand
Switching,’ Journal of Marketing Research, 15
(February), 72-81.
Blattberg, R. and S. K. Sen (1976), “Market Segments and
Stochastic Brand Choice Models,” Journal of
Marketing Research, 13 (February), 34-45.
Blattberg, T. Buesing, P. Peacock and S. Sen, (1978),
“Identifying the Deal Prone Segment,” Journal of
Marketing Research, 15 (August), 369-377.
ICAART 2011 - 3rd International Conference on Agents and Artificial Intelligence
702
