
NETWORK SECURITY EVALUATION
BASED ON SIMULATION OF MALFACTOR’S BEHAVIOR
Igor Kotenko, Mikhail Stepashkin
St. Petersburg Institute for Informatics and Automation, 39, 14 Liniya, St.-Petersburg, 199178, Russia
Keywords: Network attacks, Vulnerability Assessment, Risk Assessment, Security Metrics.
Abstract: The approach to computer network security analysis intended for using both at design and exploitation
stages is suggested. This approach is based on simulation of malefactor’s behavior, generating common
attack graphs and calculating different security metrics. The graph represents possible attack scenarios
taking into account network configuration, security policy, malefactor’s locations, knowledge level and
strategy. The security metrics describe computer network security at different levels of detail and take into
account various aspects of security. Attack scenarios model, common attack graph building procedures,
used security metrics, and general security level evaluation are defined. The implemented version of the
security analysis system is described, and examples of express-evaluations of security level are considered.
1 INTRODUCTION
Malefactors can use different vulnerabilities and
bottlenecks of network configuration and security
policy and perform various penetration strategies.
These strategies are directed to different network
resources and include a great number of assault
actions chains. Malefactors can step-by-step
compromise network hosts and realize diverse
security threats.
Therefore, during computer network design and
maintenance, designer or administrator should check
whether network configuration parameters and
security procedures provide necessary security level.
Moreover, at exploitation stage, the configuration of
computer networks can be changed, and it is also
necessary to perform network monitoring, analyze
available vulnerabilities and evaluate security level.
At design stage the specifications of network
configuration and security policies are the main
input for security analysis. At exploitation stage the
main input are the actual parameters of network
configuration and security policy.
The complexity of computer network security
management causes the necessity to develop
powerful automated security analysis systems. These
systems should allow to find and correct errors in
network configuration, reveal possible assault
actions for different security threats, determine
critical network resources and choose effective
security policy appropriate to threats.
At design stages, different approaches to security
analysis and evaluation of general security level can
be used, for example, based on qualitative and
quantitative techniques of risk analysis. We think the
perspective directions in evaluating security of
large-scaled networks consist in simulating possible
malefactor’s actions, building the representation of
these actions as attack graphs, the subsequent
checking of various properties of these graphs, and
determining security metrics which can explain
possible ways to increase network security level.
At exploitation stages, passive and active
methods of vulnerability assessment are used. The
passive methods do not allow estimating the possible
routes of malefactor’s penetration. The active
methods can not be applied in all situations, as lead
to operability violation of network services or the
system as a whole. The combination of passive
obtaining appropriate data about network
configuration and security policy, attack modeling
and simulation, attack graph construction, and
automatic reasoning can be satisfactory approach to
solve these problems.
There are a lot of papers which consider different
approaches to security analysis. For example,
various methods for representing attack scenarios
are used: attack trees (Schneier, 1999), formal
grammars (Gorodetski, Kotenko, 2002), cause-effect
339
Kotenko I. and Stepashkin M. (2006).
NETWORK SECURITY EVALUATION BASED ON SIMULATION OF MALFACTOR’S BEHAVIOR.
In Proceedings of the International Conference on Security and Cryptography, pages 339-344
DOI: 10.5220/0002102803390344
Copyright
c
SciTePress

model of attacks (Cohen, 1999), etc. (Ritchey,
Ammann, 2000) proposes model checking technique
for network vulnerability analysis. (Jha, Sheyner,
Wing, 2002) suggests the technique of attack graph
evaluation based on model checking, Bayesian and
probabilistic analysis. (Sheyner, Haines, Jha, etc.,
2002) presents algorithms for generating scenario
graphs based on symbolic and explicit-state model
checking. These algorithms ensure producing
counterexamples for determining safety and liveness
properties. (Rothmaier, Krumm, 2005) proposes an
approach for analyzing different attack scenarios.
The approach is based on high-level specification
language, a translation from this language to the
constructs of model checker SPIN, applying
optimization techniques and model checking for
automated attack scenario analysis. In (Lye, Wing,
2005) the game theory based method of evaluating
security is suggested. The authors view the
interactions between an attacker and the
administrator as a two-player stochastic game and
construct the game model. (Hariri, Qu,
Dharmagadda, etc., 2003) describes global metrics
which can be used to analyze and proactively
manage the effects of complex network faults and
attacks, and recover accordingly. (Rieke, 2004)
offers a methodology and a tool for vulnerability
analysis which can automatically compute possible
attack paths and verify some security properties.
(Dantu, Loper, Kolan, 2004) proposes approach to
estimate the risk level of critical network resources
using behavior based attack graphs and Bayesian
technique. (Ou, Govindavajhala, Appel, 2005)
suggests the logic programming approach to
automatically fulfill network vulnerability analysis.
In (Noel, Jajodia, 2005) the common approach,
attack graph visualization and the tool for
topological vulnerability analysis are considered.
In the paper we try to develop a new approach to
security evaluation based on comprehensive
simulation of malefactor’s actions, construction of
attack graphs and computation of different security
metrics. The main difference of offered approach
from examined ones consists in the way of
simulating attacks (we use a multi-level model of
attack scenarios) and applying constructed attack
graphs (for different locations of malefactors) for
determining a family of security metrics and
comprehensive evaluation of security properties.
Security analysis system (SAS) based on the offered
approach is intended for usage at different stages of
computer network life cycle. The results of security
analysis are as follows: (1) vulnerabilities detected;
(2) routes (graphs) of possible attacks; (3)
bottlenecks in network; (4) different security
metrics, which can be used for general security level
evaluation of computer network (system) and its
components. Obtained results allow producing the
valid recommendations for elimination of detected
bottlenecks and strengthening common security
level. After modification, if it is necessary, the user
repeats the process of security evaluation. The work
is organized as follows. Section 2 defines the model
of attack scenarios and considers the common attack
graph generated. Section 3 specifies security metrics
and the procedure for evaluating a common security
level. Section 4 presents the security analysis system
implemented. Conclusion surveys main work results
and future research.
2 ATTACK GRAPH
Our model of attack scenarios is hierarchical and
contains three levels: integrated, script and actions.
Integrated level determines high-level purposes
(threats) of the security analysis and attack objects.
Integrated level allows to coordinate several
scenarios performed by one or several malefactors.
Script level takes into account initial malefactor’s
qualification and knowledge about computer
network, defines attack object and attack purpose
(for example, “OS determining”, “denial of service”,
etc.). Script level sets script stages used, including
reconnaissance, penetration (initial access to the
host), privileges escalation, threat realization, traces
hiding and backdoors creation. The lower scenario
elements serve for detailing of these phases.
The low level of attack model describes low-
level malefactor’s actions and exploits.
The algorithm of generating the common attack
graph is based on the attack scenarios model
developed. It is intended for creation of attack graph
which describes all possible routes of attack actions
in view of malefactor’s initial position, skill level,
network configuration and used security policy. The
algorithm of generating common attack graph is
based on realization of the following action
sequence: (1) actions which are intended for
malefactor’s movement from one host to another;
(2) reconnaissance actions for detection of “live”
hosts; (3) reconnaissance scenarios for detected
hosts; (4) attack actions based on vulnerabilities and
actions of ordinary users.
All objects of attack graph are divided into two
groups: base objects and combined objects. Base
objects define the graph vertexes. They are linked to
each other by edges for forming different sequences
SECRYPT 2006 - INTERNATIONAL CONFERENCE ON SECURITY AND CRYPTOGRAPHY
340

of malefactor’s actions. Combined objects are built
on the basis of linking the elementary objects by
arcs. Objects of types “host” and “attack action” are
base (elementary) objects. Set of objects “hosts”
includes all hosts discovered and attacked by
malefactor. Set of objects “attack action” contains
all distinguishable actions of malefactor.
All attack actions are divided into the following
classes: Reconnaissance actions; Preparatory actions
(within the limits of malefactor’s privileges) used for
creation of conditions needed for other attack
actions; Actions to gain the privileges of local user
and of administrator; Confidentiality, Integrity and
Availability violation.
Objects of types “route”, “threat” and “graph”
are combined objects. Route is a collection of linked
vertexes of general attack graph (hosts and attack
actions), first of which represents a host (initial
malefactor’s position) and last has no outgoing arcs.
Threat is a set of various attack routes having
identical initial and final vertexes. We classify
threats as follows: (1) Primary threats – threats of
confidentiality, integrity and availability violation;
(2) Additional threats – threats of gaining
information about host or network, gaining
privileges of local user and of administrator. Graph
is integration of all threats.
3 METRICS
About 150 different metrics were constructed on the
basis of common attack graph. According to division
of attack graph objects the security metrics can be
divided into metrics of base objects (hosts and attack
actions) and ones of combined objects (routes;
threats; attack graph). According to the order of
calculation we differentiate primary and secondary
metrics. Primary metrics are defined from attack
graph; secondary ones are calculated on the basis of
primary. All security metrics are divided into basic
and auxiliary according to whether they are used for
evaluating a common security level. Basic security
metrics are directly used for the evaluation.
Auxiliary security metrics serve for building detailed
picture of network security and are required, for
example, for detecting bottlenecks and generating
instructions on security strengthening.
We define the following metrics as basic ones:
Criticality level of host h (Criticality(h)); criticality
level of attack action a (Severity(a)); Damage level
caused by attack action and taking into account the
criticality level of host (Mortality(a,h)); damage
level of route S and threat T (Mortality(S) and
Mortality(T)); “Access complexity” of attack action
a, route S and threat T (AccessComplexity(a),
AccessComplexity(S), AccessComplexity(T));
Admissibility of threat realization (Realization(T));
Risk level of threat T (RiskLevel(T)); General
security level of computer network (SecurityLevel).
Some security metrics are calculated on the basis
of standard Common Vulnerability Scoring System
(CVSS, 2006). CVSS metrics are divided into base,
temporal and environmental. Base indexes define
criticality of vulnerability. Temporal indexes
determine urgency of vulnerability at the given time.
Environmental indexes should be used for priorities
arrangement at time of generating plans of
vulnerabilities elimination. CVSS metrics of attack
actions can be obtained from external databases of
vulnerabilities, for example, NVD (NVD, 2006).
The offered technique for qualitative express-
assessment of security level contains the following
stages: (1) Calculation of security metrics of basic
and combined objects; (2) Estimation of qualitative
assessments of risk level for all threats; (3) Security
level evaluation on basis of risk levels of all threats.
Criticality(h) is determined by designer (or
administrator) using three level scale (High,
Medium, Low) according to the purpose of given
host and its functions. Criticality(h) is determined in
dependence from the security policy used. For
example, if accessibility is the main factor, the
maximum criticality level is defined for those hosts,
incorrect functioning of which leads to impossibility
of using network resources by legitimate users.
Severity(a) is calculated with usage of CVSS
index “BaseScore” (NVD-Severity, 2006) also by
applying three level scale (High, Medium, Low).
Mortality(a,h) is calculated taking into account
the criticality levels of host and action.
Mortality(T) is defined by the damage level of
the latest attack action of one of the threat routes.
The values of Mortality(T) are as follows: High –
stopping of critical subdivisions of organization
which leads to essential financial losses; Medium –
short-term stopping of critical processes or systems
which leads to limited financial losses in one
subdivision of organization; Low – the damage do
not cause the essential financial losses.
However, it is possible that a malefactor at threat
realization causes the greater damage than damage
calculated by latest attack action of the threat. Then
it is necessary to define the following metrics:
maximum damage level of route S and threat T.
These metrics can be calculated as follows:
Mortality
max
(S)=max
i
(Mortality(a
i
,h
i
)),i∈[1,N
S
],a
i
∈S,
Mortality
max
(T)=max
i
(Mortality(S
i
)), i∈[1,N
T
], S
i
∈T,
NETWORK SECURITY EVALUATION BASED ON SIMULATION OF MALFACTOR’S BEHAVIOR
341

where N
S
– length of route (quantity of attack actions
in the route); N
T
– quantity of routes in the threat T.
For calculation of threat risk level it is necessary
to evaluate the threat realization admissibility
(Realization(T)) and to use the FRAP technique
(FRAPб 2006) taking into account threat damage
level Mortality(T) obtained earlier.
“Access Complexity” index of CVSS
(AccessComplexity(a), where a – attack action) is
used for computation of threat realization
admissibility. This index belongs to a group of base
indexes and is specified for each attack action. The
possible values of this index are: High – there are
specific conditions for vulnerability usage (attack
action realization), for example a specific time or
network service configuration, interaction with
human, etc; Low – there are no specific conditions,
i.e. the vulnerability is always exploitable.
Then, AccessComplexity(S) is High if ∃k∈[1,N]:
Access Complexity(a
k
)=High and is Low if
∀k∈[1,N]: Access Complexity(a
k
)=Low, where
{}
1
N
i
i
Sa
=
=
– attack scenario (route); N – length of
route (quantity of attack actions).
AccessComplexity(T) (threat T represented as a
set of various attack routes having the same initial
and final vertexes) is Low if ∃k∈[1,N
S
]: Access
Complexity(S
k
)= Low and is High if ∀k∈[1,N
S
]:
Access Complexity(S
k
)=High, where
{}
1
S
N
k
k
TS
=
=
–
threat; N
S
– quantity of different routes of threat T;
{}
1
k
N
ki
i
Sa
=
=
– attack scenario (route); N
k
– quantity
of attack actions in the route.
Then admissibility of threat T realization is High
if AccessComplexity(T)=Low and is Low if
AccessComplexity(T)=High.
Threat risk level (RiskLevel(T)) can be evaluated
according to
Realization(T) and Severity(T). Threat risk
level can be interpreted as follows: Level А – the
actions concerned with risk (for example, using a
new security software or eliminating detected
vulnerabilities) should be fulfilled immediately;
Level B – the actions concerned with risk should be
undertaken; Level C – monitoring a situation is
required (possibly, it is not required to undertake
additional actions); Level D – additional actions are
not required.
SecurityLevel is defined in the following way:
[
]
(
)
[]
()
[]
()
[]
()
,1,
,1,
,
,1,
,1,:
Ti
Ti
Ti
Ti
Green i N RiskLevel T D
Yellow i N RiskLevel T C
SecurityLevel
Orange i N RiskLevel T B
Red i N RiskLevel T A
⎧
∀∈ =
⎪
∀∈ ≤
⎪
=
⎨
∀∈ ≤
⎪
⎪
∃∈ =
⎩
where D<C<B<A, N
T
– the quantity of all threats.
4 IMPLEMENTATION
Based on the suggested approach the security
analysis system (SAS) has been implemented. The
network model which SAS uses at the design stage
is based on network configuration expressed in
System Description Language (SDL) and security
policy in Security Policy Language (SPL) (Positif,
2006). At the exploitation stage the network model
is created on the basis of data collected from
network. Let us consider the main SAS components.
Data Repository contains the data base (DB) of
network configuration and security policy
(NetworkModel), DB of malefactor’s conception on
configuration and security policy, and the database
of actions (Attacks). The component NetworkModel
contains information about network architecture and
its parameters (for example, types and versions of
operating systems, applications, opened ports, etc.)
and rules which describe the security policy. The
component Attacks consists of DB of actions which
uses vulnerabilities and DB of usual user actions.
ModelInitializator converts the information
about network configuration and security policy into
internal representation. DataControl detects
incorrect or undefined data which are necessary for
evaluating security level. For example, the user can
make a mistake in the name of a service or specify
that port 21 is opened, but do not specify what
application serves the requests on this port.
GraphBuilder builds attack graph by simulating
malefactor’s actions on the base of information
about available attack actions, network configuration
and used security policy. This module sets up
security metrics of elementary objects in attack
graph vertexes. On the basis of these metrics,
GraphAnalyzer calculates the metrics of combined
objects. ReportGenerator shows vulnerabilities
detected by SAS, represents bottlenecks and
recommendations on strengthening security level.
InformCollector is used for collection of information
derived from host software agents, representation of
derived information using SDL and SPL and
transfering this data to the ModelInitializator.
DataUpdater downloads the XML specifications of
vulnerabilities from open vulnerability database and
translates them into the database of attack actions.
Figure 1 shows the SAS user interface. It is
divided into four basic parts: (1) The SAS main
menu; (2) The top area of the main window with the
following tabs: “Analyzed Network Model” –
representation of network model; “Malefactor's
Network Model” – malefactor’s conception on
configuration and security policy at the given attack
SECRYPT 2006 - INTERNATIONAL CONFERENCE ON SECURITY AND CRYPTOGRAPHY
342
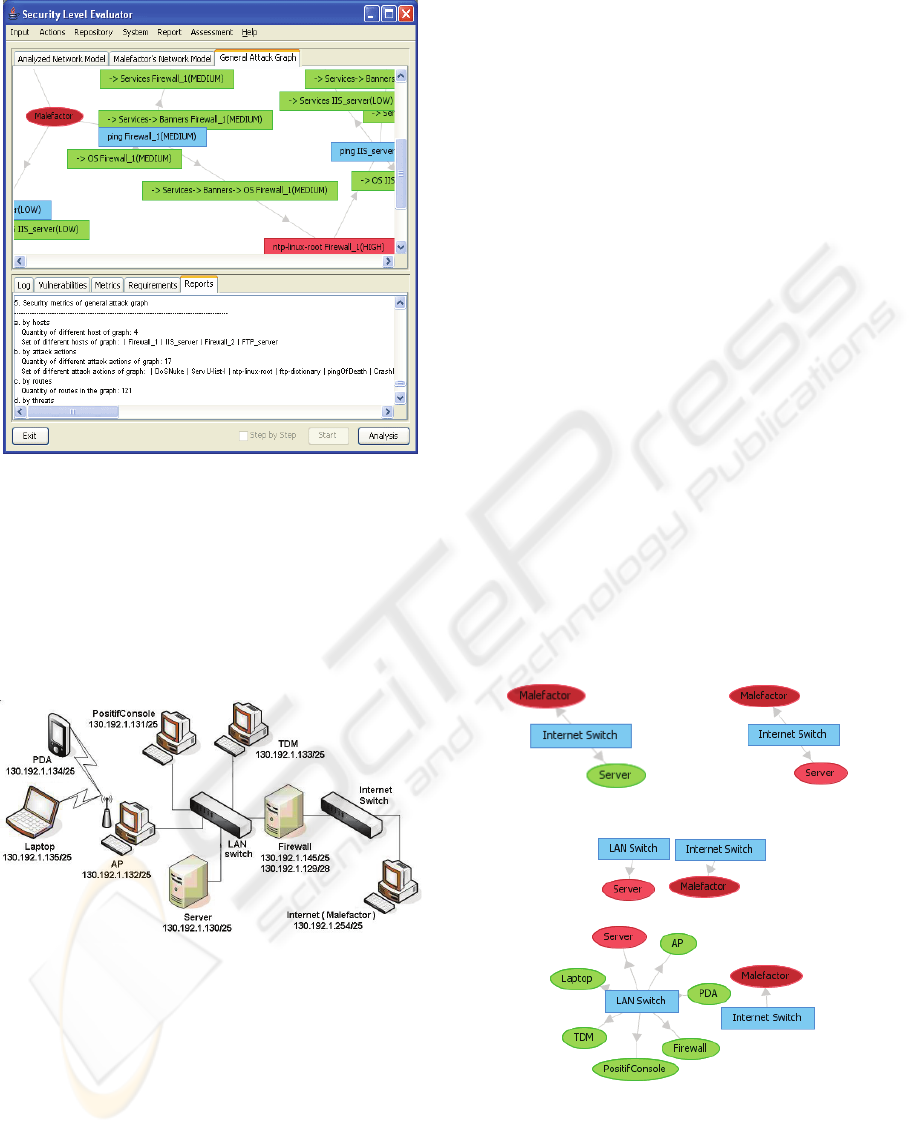
stage; “General Attack Graph” – general attack
graph representation; (3) The bottom area of the
main window which displays the SAS log,
vulnerable hosts and revealed vulnerabilities,
security metrics, requirements and reports; (4)
Management buttons area.
Let us consider SAS operation for the simple test
network depicted in Figure 2.
Figure 2: Structure of test network.
During construction of attack graph there are the
following main changes in malefactor’s conception
about network (depicted in step-by-step mode – see
Figure 3):
(1) After executing the “ping” attack (according
to rules of traffic routing), malefactor gets to know
about host “Server” (Figure 3,a);
(2) Malefactor executes attack action which uses
the vulnerability in ftp service and allows to gain
administrator privileges (host “Server” is highlighted
by red) (Figure 3,b);
(3) Malefactor uses gained privileges to get all
information about “Server”. This information allows
him to understand that “Server” is connected to
another switch (the port forwarding is used in the
network). Hence, it is advantageous for malefactor
to change location since he gets the access to other
network segment. Figure 3,c shows a breach
between hosts which appears because malefactor
does not know through what host (router) the
network packets move from his host (“Malefactor”)
to host “Server”;
(4) Malefactor moves to the host “Server”,
executes the “ping” action and gets to know about a
set of hosts which he tries to attack sequentially
(Figure 3,d).
The main results of security analysis for this
example are as follows: (1) detected vulnerabilities;
(2) values of security metrics (for example, quantity
of attack routes which are passing through
“Server”); (3) reports on the status of basic security
aspects including instructions on security level
increase.
Security analysis showed that the network
security level is red. Next actions of user are as
follows: (1) elimination of detected vulnerabilities
and bottlenecks by updating network configuration
and security policy; (2) repeated security analysis.
(a)
(b)
(c)
(d)
Figure 3: Malefactor’s representations about the network.
Figure 1: SAS user interface.
NETWORK SECURITY EVALUATION BASED ON SIMULATION OF MALFACTOR’S BEHAVIOR
343

5 CONCLUSION
The paper offered the approach and software tool for
security analysis of computer networks. The
approach possesses the following peculiarities: (1)
Usage of integrated family of different models based
on expert knowledge, including malefactor’s
models, multilevel models of attack scenarios,
building attack graph, security metrics computation
and security level evaluation; (2) Taking into
account diversity of malefactor’s positions,
intentions and experience levels; (3) Usage (during
construction of common attack graph) not only of
the parameters of computer network configuration,
but the rules of security policy used; possibility of
estimating the influence of different configuration
and policy data on the security level value; (4)
Taking into account not only attack actions (which
use vulnerabilities), but the common actions of
legitimate users and reconnaissance actions; (5)
Possibility of investigating various threats for
different network resources; (6) Possibility of
detection of bottlenecks (hosts and applications
responsible for the most serious attack actions,
routes and threats); (7) Possibility of querying the
system in the “what-if” way, for example, how the
general security level will change if the certain
parameter of network configuration or security
policy is changed or information about new
vulnerability is added; (8) Usage of updated
vulnerabilities databases (for example, Open Source
Vulnerability Database (OSVDB 2006); (9) Usage
of widespread CVSS approach (CVSS, 2006); (10)
Usage of qualitative techniques of risk analysis (in
particular, modified techniques of evaluating attack
criticality of SANS/GIAC and FRAP (FRAP, 2006).
The future research will be devoted to
comprehensive experimental assessment of offered
approach and improving the models of computer
attacks and security level evaluation.
This research is being supported by grant of
Russian Foundation of Basic Research (№ 04-01-
00167), grant of the Department for Informational
Technologies and Computation Systems of the
Russian Academy of Sciences (contract №3.2/03)
and partly funded by the EC as part of the POSITIF
project (contract IST-2002-002314).
REFERENCES
Cohen, F., 1999. Simulating Cyber Attacks, Defenses, and
Consequences. In IEEE Symposium on Security and
Privacy, Berkeley, CA.
CVSS, 2006. Common Vulnerability Scoring System.
Retrieved April 14, 2006, from
http://www.first.org/cvss/
Dantu, R., Loper, K., Kolan, P., 2004. Risk Management
using Behavior based Attack Graphs. In International
Conference on Information Technology: Coding and
Computing.
FRAP, 2006. Facilitated Risk Analysis Process. Retrieved
April 1, 2006, from http://www.peltierassociates.com/
Gorodetski, V., Kotenko, I., 2002. Attacks against
Computer Network: Formal Grammar-based
Framework and Simulation Tool. LNCS, V.2516.
Hariri, S., Qu, G., Dharmagadda, T., Ramkishore, M.,
Raghavendra, C. S., 2003. Impact Analysis of Faults
and Attacks in Large-Scale Networks. In IEEE
Security&Privacy, September/October.
Jha, S., Sheyner, O., Wing, J., 2002. Minimization and
reliability analysis of attack graphs. Technical Report
CMU-CS-02-109, Carnegie Mellon University.
Lye, K., Wing, J., 2005. Game Strategies in Network
Security. International Journal of Information
Security, February.
McNab, C., 2004. Network Security Assessment. O’Reilly
Media, Inc.
Noel, S., Jajodia, S., 2005. Understanding complex
network attack graphs through clustered adjacency
matrices. In Proc. 21st Annual Computer Security
Conference (ACSAC).
Netfilter, 2006. Netfilter/iptables documentation.
Retrieved April 14, 2006, from
http://www.netfilter.org/documentation/
NVD, 2006. National Vulnerability Database. Retrieved
April 14, 2006, from http://nvd.nist.gov/
NVD-Severity, 2006. National Vulnerability Database
Severity Ranking. Retrieved April 14, 2006, from
http://nvd.nist.gov/cvss.cfm
OSVDB, 2006. The Open Source Vulnerability Database.
Retrieved April 14, 2006, from http://www.osvdb.org/
Ou, X., Govindavajhala, S., Appel, A.W., 2005. MulVAL:
A Logic-based Network Security Analyzer. In 14th
Usenix Security Symposium.
Peltier, T.R., Peltier, J., Blackley, J.A., 2003. Managing a
Network Vulnerability Assessment. Auerbach Publ.
Positif, 2006. Positif Project. Retrieved June 8, 2006, from
http://www.positif.org/
Rieke, R., 2004. Tool based formal Modelling, Analysis
and Visualisation of Enterprise Network
Vulnerabilities utilising Attack Graph Exploration. In
Proceedings EICAR.
Ritchey, R. W., Ammann, P., 2000. Using model checking
to analyze network vulnerabilities. In
IEEE Symposium
on Security and Privacy.
Rothmaier, G., Krumm, H., 2005. A Framework Based
Approach for Formal Modeling and Analysis of Multi-
level Attacks in Computer Networks. LNCS, Vol.3731.
Sheyner, O., Haines, J., Jha, S., etc., 2002. Automated
generation and analysis of attack graphs. In IEEE
Symposium on Security and Privacy.
Schneier, B., 1999. Attack Trees. Dr. Dobb’s Journal,
Vol.12.
SECRYPT 2006 - INTERNATIONAL CONFERENCE ON SECURITY AND CRYPTOGRAPHY
344
