
COMPARATIVE STUDY BETWEEN BAYESIAN NETWORK
AND POSSIBILISTIC NETWORK IN INTRUSION DETECTION
Najla Arfaoui, Farah Jemili, Montaceur Zaghdoud
Mohamed Ben Ahmed
RIADI Laboratory, ENSI, Manouba University, Manouba 2010, Tunisia
Keywords: Intrusion Detection, Bayesian Network, Possibilistic Network, learning algorithm, junction tree.
Abstract: Intrusion detection parameters are numerous and in many cases they present uncertain and imprecise causal
relationship which can affect attack types. Bayesian Network (BN) is known as causal graphical model
which can learn from data and after that it can be used to deduce conclusion about a fact based on causal
relations with other prior facts. Causal relationships in BN are modeled by conditional probabilities.
Recently, Possibilistic Network (PN) is being a complementary or sometimes concurrently model of BN and
demonstrated superiority in computing imprecise and/or incomplete data. PN is based on the same principle
as BN but it uses conditional possibilities rather than conditional probabilities to modal causal relationships.
Several researchers worked on comparison between BN and PN in many domains. But, in this paper we are
interested by comparison between BN and PN network in Intrusion Detection. Comparison criteria covered
detection rate and false alarms rate. Experimentation process used DARPA’99 data set. Comparison results
show a global superiority of PN versus BN when detecting intrusion. The main outcome of this research
work is to develop an Intrusion Detection System (IDS) based on BN and/or PN network depending
comparison results.
1 INTRODUCTION
Intrusion detection can be defined as the process of
identifying malicious behavior that targets a network
and its resources (Kruegel et al., 2003). Malicious
behavior is defined as a system or individual action
which tries to use or access to computer system
without authorization (i.e., crackers) and the
privilege excess of those who have legitimate access
to the system (i.e., the insider threat).
Completely protect a network from attacks is a
very hard task and even heavily protected networks
are sometimes penetrated. In fact, an Intrusion
Detection (IDS) seems to be vital for information
insurance and it becomes key component of
information system and network security. An
intruder can use some features to attack system.
Each attack type is characterized by the use of
system vulnerabilities based on some feature values.
Usually, there are associations between attack types
and computer system characteristics used by
intruder. If we are able to reveal those hidden
relationships we will also be able to predict the
attack type. To do so, using Bayesian network has
been already confirmed by several researches.
The main goal of this paper is to highlight
performance of each of two tools in modeling causal
relationships in an intrusion detection application:
Bayesian Network and Possibilistic Network.
The comparison is done based on a set of
comparison criteria which covered network learning,
structure and inference. In this comparison work we
had chosen K2 learning algorithm to learn Bayesian
Network and HCS algorithm to learn possibilistic
network. This algorithm choice is justified by a
literature review conducted by authors (Sanguesa ,
1988 and Sanguesa , 1997).
Brief Presentation of intrusion detection system
and theory foundation of Bayesian and possibilistic
networks seems to be important. In this comparison
study, we consider detection rate and false alarms
rate as two major comparison criteria.
24
Zaghdoud M. and Ben Ahmed M. (2006).
COMPARATIVE STUDY BETWEEN BAYESIAN NETWORK AND POSSIBILISTIC NETWORK IN INTRUSION DETECTION.
In Proceedings of the International Conference on Security and Cryptography, pages 24-31
DOI: 10.5220/0002101200240031
Copyright
c
SciTePress

2 INTRUSION DETECTION
SYSTEM
There are two general methods of detecting
intrusions into computer and network systems:
anomaly detection and signature recognition
(Rudzonis , 2003). Anomaly detection techniques
establish a profile of the subject’s normal behavior
(norm profile), compare the observed behavior of
the subject with its norm profile, and signal
intrusions when the subject’s observed behavior
differs significantly from its norm profile. Signature
recognition techniques recognize signatures of
known attacks, match the observed behavior with
those known signatures, and signal intrusions when
there is a match.
An IDS installed on a network is like a burglar
alarm system installed in a house. Through various
methods, both detect when an intruder/burglar is
present. Both systems issue some type of warning in
case of detection of presence of intrusion/burglar.
Systems which use misuse-based techniques
contain a number of attack descriptions, or
‘signatures’, that are matched against a stream of
audit data looking for evidence of the modeled
attacks. The audit data can be gathered from the
network, from the operating system, or from
application log files (Rudzonis, 2003).
Experimentation conducted in this research work is
based on DARPA KDD’99 data set.
3 KDD’99 DARPA DATA SET
MIT Lincoln Lab’s DARPA intrusion detection
evaluation data sets have been employed to design
and test intrusion detection systems. The KDD’99
intrusion detection datasets are based on the 1998
DARPA initiative, which provides designers of
intrusion detection systems (IDS) with a benchmark
on which to evaluate different methodologies
(DARPA, 1999, ISTG, 1998 , Kayacik and Zincir-
Heywood , 2005).
To do so, a simulation is made of a factitious
military network consisting of three ‘target’
machines running various operating systems and
services. Additional three machines are then used to
spoof different IP addresses to generate traffic.
Finally, there is a sniffer that records all network
traffic using the TCP dump format. The total
simulated period is seven weeks (Kayacik and
Zincir-Heywood , 2005). Packet information in the
TCP dump file is summarized into connections.
Specifically, “a connection is a sequence of TCP
packets starting and ending at some well defined
times, between which data flows from a source IP
address to a target IP address under some well
defined protocol” (Kayacik and Zincir-Heywood,
2005).
DARPA KDD'99 data set represents data as rows
of TCP/IP dump where each row consists of
computer connection which is characterized by 41
features.
Features are grouped into four categories:
Basic Features: Basic features can be
derived from packet headers without
inspecting the payload.
Content Features: Domain knowledge is
used to assess the payload of the original TCP
packets. This includes features such as the
number of failed login attempts;
Time-based Traffic Features: These features
are designed to capture properties that mature
over a 2 second temporal window. One
example of such a feature would be the
number of connections to the same host over
the 2 second interval;
Host-based Traffic Features: Utilize a
historical window estimated over the number
of connections – in this case 100 – instead of
time. Host based features are therefore
designed to assess attacks, which span
intervals longer than 2 seconds.
In this comparative study, we used KDD' 99 base
which is counting almost 494019 of training
connections. Based upon a discriminate analysis, we
used data about only important features (the 9
th
first
features):
Protocol type: type of the protocol, e.g. tcp,
udp, etc.
Service: network service on the destination,
e.g., http, telnet, etc.
Land: 1 if connection is from/to the same
host/port; 0 otherwise.
Wrong fragment: number of ``wrong''
fragments.
Num_failed_logins: number of failed login
attempts.
Logged_in: 1 if successfully logged in; 0
otherwise.
Root_shell: 1 if root shell is obtained; 0
otherwise.
Is_guest_login: 1 if the login is a ``guest''
login; 0 otherwise.
To these features, we added the
"attack_type". Indeed each training connection
COMPARATIVE STUDY BETWEEN BAYESIAN NETWORK AND POSSIBILISTIC NETWORK IN INTRUSION
DETECTION
25
is labelled as either normal, or as an attack
with specific type.
DARPA' 99 base counts 38 attacks which can be
gathered in four main categories:
Denial of Service (dos): Attacker tries to
prevent legitimate users from using a service.
Remote to Local (r2l): Attacker does not
have an account on the victim machine, hence
tries to gain access.
User to Root (u2r): Attacker has local access
to the victim machine and tries to gain super
user privileges.
Probe: Attacker tries to gain information
about the target host.
4 BAYESIAN NETWORK
A Bayesian network is a graphical modeling tool
used to model decision problems containing
uncertainty. It is a directed acyclic graph where each
node represents a discrete random variable of
interest. Each node contains the states of the random
variable that it represents and a conditional
probability table (CPT) which give conditional
probabilities of this variable such as realization of
other connected variables, based upon Bayes rule:
)(
)()/(
)/(
AP
BPBAP
ABP =
The CPT of a node contains probabilities of the node
being in a specific state given the states of its
parents. The parent-child relationship between nodes
in a Bayesian network indicates the direction of
causality between the corresponding variables. That
is, the variable represented by the child node is
causally dependent on the ones represented by its
parents (Dubois and Prade, 1998, Gebhardt and
Kruse, 1995, DARPA, 1999, Jensen, 2001 and
Jensen 1994).
Several researchers have been interested by using
Bayesian network to develop intrusion detection
systems. Axelsson in (Axelsson, 1999) wrote a well-
known paper that uses the Bayesian rule of
conditional probability to point out the implications
of the base-rate fallacy for intrusion detection. It
clearly demonstrates the difficulty and necessity of
dealing with false alerts.
Kruegel in (Kruegel et al., 2003) presented a
model that simulates an intelligent attacker using
Bayesian techniques to create a plan of goal-directed
actions. An event classification scheme is proposed
based on Bayesian networks. Bayesian networks
improve the aggregation of different model outputs
and allow one to seamlessly incorporate additional
information.
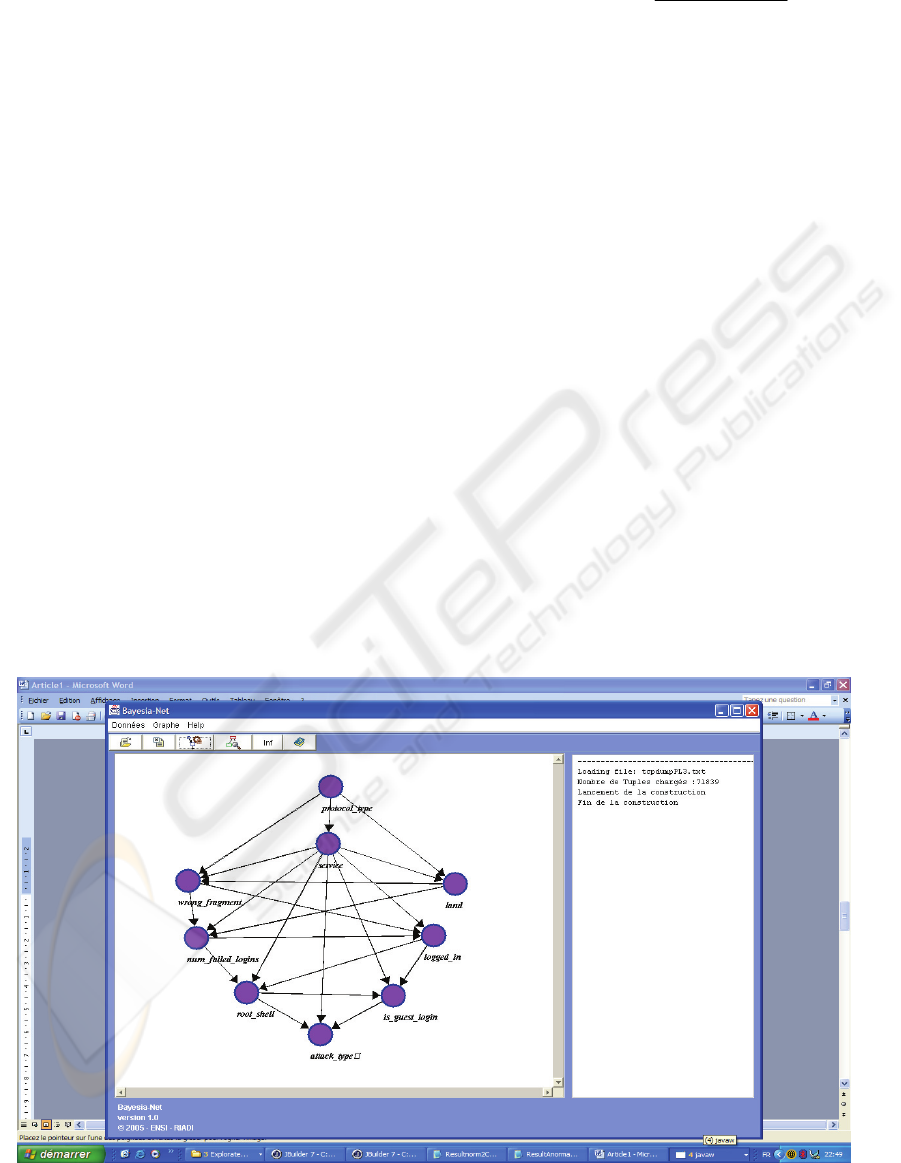
Figure 1: K2 Bayesian Network.
SECRYPT 2006 - INTERNATIONAL CONFERENCE ON SECURITY AND CRYPTOGRAPHY
26

Johansen in (Johansen and Lee, 2003)
suggested that a Bayesian system which provides a
solid mathematical foundation for simplifying a
seemingly difficult and monstrous problem that
today’s Network IDS fail to solve. He added that
Bayesian Network IDS should differentiate between
attacks and the normal network activity by
comparing metrics of each network traffic sample.
5 BAYESIAN NETWORK
LEARNING ALGORITHM
K2 learning algorithm showed high performance in
many research works. The principle of K2
algorithm, proposed by Cooper and Herskovits, is to
define a database of variables: X1,..., Xn, and to
build an acyclic graph directed (DAG) based on the
calculation of local score (Sanguesa, 1997).
Variables constitute network nodes. Arcs represent
“causal” relationships between variables.
Algorithm K2 used in learning step needs :
A given order between variables
and the number of parents, u of the node.
K2 algorithm proceeds by starting with a single
node (the first variable in the defined order) and then
incrementally adds connection with other nodes
which can increase the whole probability of network
structure, calculated using the g function. A
requested new parent which does not increase node
probability can not be added to the node parent set.
ri
k
ijk
qi
j
iij
i
iii
N
rN
r
xpaxg
11
!
)!1(
)!1(
))(,(
==
∏
−+
−
=
where, for each variable xi; ri is the number of
possible instantiations; N is the number of cases in
the database; wij is the j-th instantiation of pai in the
database; qi is the number of possible instantiations
for pai; Nijk is the number of cases in D for which xi
takes the value xik with pai instantiated to wij ; Nij is
the sum of Nijk for all values of k.
Execution time is in the order O(Nu
2
n
2
r) with r
being the maximum value for ri (Sanguesa, 1997).
K2 Algorithm
Input: a set of variables x
1
,…, x
n
;
a given order among them;
an upper limit u on the number
of parents for a node;
a database on x
1
,…, x
n
Output: a DAG with oriented arcs.
For i := 1 to n do
pa
i
(x
i
) = Ø ; OK : = true ;
P
old
:= g(x
i
, pa
i
(x
i
)) ;
While OK and |pa
i
(x
i
)| < u do
Let z be the node in the set of predecessors
of xi that does not belong to pa
i
(x
i
) which
maximizes g(x
i
, pa
i
(x
i
) ∪ {z}) ;
P
new
:= g(xi, pai(xi)
∪
{z});
If P
new
> P
old
Then
P
old
:= P
new
;
pa
i
(x
i
) := pa
i
(x
i
)
∪
{z};
Else OK := false ;
We ordered network variables as follows:
protocole_type, sevice, land, wrong_fragment,
num_failed_logins, logged_in, root_shell,
is_guest_login, attack_type.
We had chosen the number 8 (9-1) as the upper
limit of node parents. Bayesian network structure,
the result of learning step is shown in Figure1.
6 POSSIBILISTIC NETWORKS
Possibilistic networks are directed acyclic graphs
(DAG), where each node encodes a variable and
every edge represents a “causal” relationship
between two variables. Uncertainty is expressed by
conditional possibility distributions for each node in
the context of its parents (Benferhat and Smaoui,
2005, Kruse Rudolf and Borgelt, 2001).
A possibility distribution
π
is a mapping from a
reference set
Ω
to the unit interval. For each
element
ω
of
Ω
,
)
ω
π
(
denotes a compatibility
degree of an interpretation
ω
with available pieces
of information. By convention:
0
=
)
ω
π
( means that ω is impossible.
=
) 1(
ω
π
means that ω is totally possible.
In contrast to a probability distribution where the
sum of event probabilities is compulsory equal to
one, the sum of event possibilities doesn’t need to be
equal to one (it can be great than one).
A possibilistic network represents a decomposition
of a multi-variant possibility distribution according
to
π
function:
))parents(Aj| (Aj min An), . . . (A1,
n1,j
π
π
=
=
where parents(Aj) is the set of parents of Aj.
Several researchers were recently interested in
Possibilistic networks. Rudolf Kruse and Christian
Borgelt in (Kruse and Borgelt, 2001) wrote that the
COMPARATIVE STUDY BETWEEN BAYESIAN NETWORK AND POSSIBILISTIC NETWORK IN INTRUSION
DETECTION
27

main advantage of the possibilistic networks over
the probabilistic networks is that they can handle
directly imprecise, i.e. set-valued, information. They
indicated that this is especially useful, if an inference
network is to be learned from data and the used
database contains a considerable amount of missing
values. Whereas in order to learn a probabilistic
network these tuples have to be discarded or treated
in some complicated manner, possibilistic network
learning can easily take them into account and can
thus, without problem, make use of all available
information.
7 POSSIBILISTIC NETWORK
LEARNIN ALGORITHM
Possibilistic learning algorithms aim to build
possibilistic networks from data. The most known
algorithms for causal networks construction are HCS
and POSSCAUSE. The first one is used to recover
simple DAGs and the second one to recover general
DAGs (Gebhardt and Kruse, 1995.). Possibilistic
network learning is conducted using the HCS
algorithm, a hybrid algorithm proposed by Sangüsa
et al. (Klir and Folger, 1988, Kayacik and Zincir-
Heywood, 2005). It is based on Huete and Campos’
CH algorithm; it uses a measure of non-specificity to
choose among possible subgraphs. Klir in (Klir and
Folger, 1988) and (Higashi and Klir,1983) defined a
measure called U-uncertainty for the non-specificity
associated with a possibility distribution.
Given a variable X with domain {X
1
,…,X
n
} and an
associated possibility distribution π
x
(x
i
), the U-
uncertainty for π(x) is :
U(π(x)) =
∫
1
0
d )(X card lg2
ρρ
Where X
ρ
is the ρ-cut for X, That is, X
ρ
= {x
i
such
that π (x
i
) ≥ ρ}.
U-uncertainty can be extended for joint and
conditional distributions (Klir and Folger, 1988,
Higashi and Klir,1983).
CH algorithm is devised to recover a special case
of network, a causal polytree. Causal polytrees can
be seen as simple DAGs, where only a single path
exists between any two nodes. A polytree as defined
in (Sanguesa and Cortes, 1997) is a kind of DAG
where all nodes with common ancestors do not share
common descendants. The name “polytree” stems
from the fact that these structures can be seen as a
collection of several causal trees merged together
where arrows converge head to head. Singly
connected graphs are graphs that allow a certain
kind of cycles: simple cycles. Execution time of
HCS algorithm is in the order of θ(n
2
) where n is the
number of variables in the data base.
HCS algorithm creates the sheaths corresponding
to each variable in the domain, orients them by using
the U-uncertainty measure and then merges the
resulting subgraphs to obtain the final DAG, which
is a singly connected graph. A sheath Ψ
xi
for variable
x
i
is the subgraph corresponding to those other
variables in U that are direct causes and effects of x
i
.
Sheaths are obtained by repeatedly expanding the set
of variables that are marginally dependent with
respect to x
i
,
those y
i
in U for which I(x
i
|Ф|y
i
) holds.
This set is called
Λ
xi
(Sanguesa et al., 1988.).
HCS Algorithm
1. For each xi in U
a) Calculate Λ
xi
b) Calculate Ψ
xi
c) For each y in Ψ
xi
i. Calculate the set of possible neighbours N
xi
(y)
ii. If N
xi
(y)=Ø then eliminate y from Ψ
xi
d) Create G
xi
For each y in Ψ
xi
.
If there exists no link between xi and y Then
If x
i
is a root node Then
Create graph G1 by adding to G1 the link y → x
Calculate U (G1)
Create graph G2 by adding to G2 the link x → y
Calculate U (G2)
If U (G1) < U(G2) then Gx
i
=G1 else Gx
i
=G2
If x
i
is not a root node Then add the link x → y
2. Merge all Gx
i
to obtain G.
3. If resulting graph is not simple then FAIL
SECRYPT 2006 - INTERNATIONAL CONFERENCE ON SECURITY AND CRYPTOGRAPHY
28
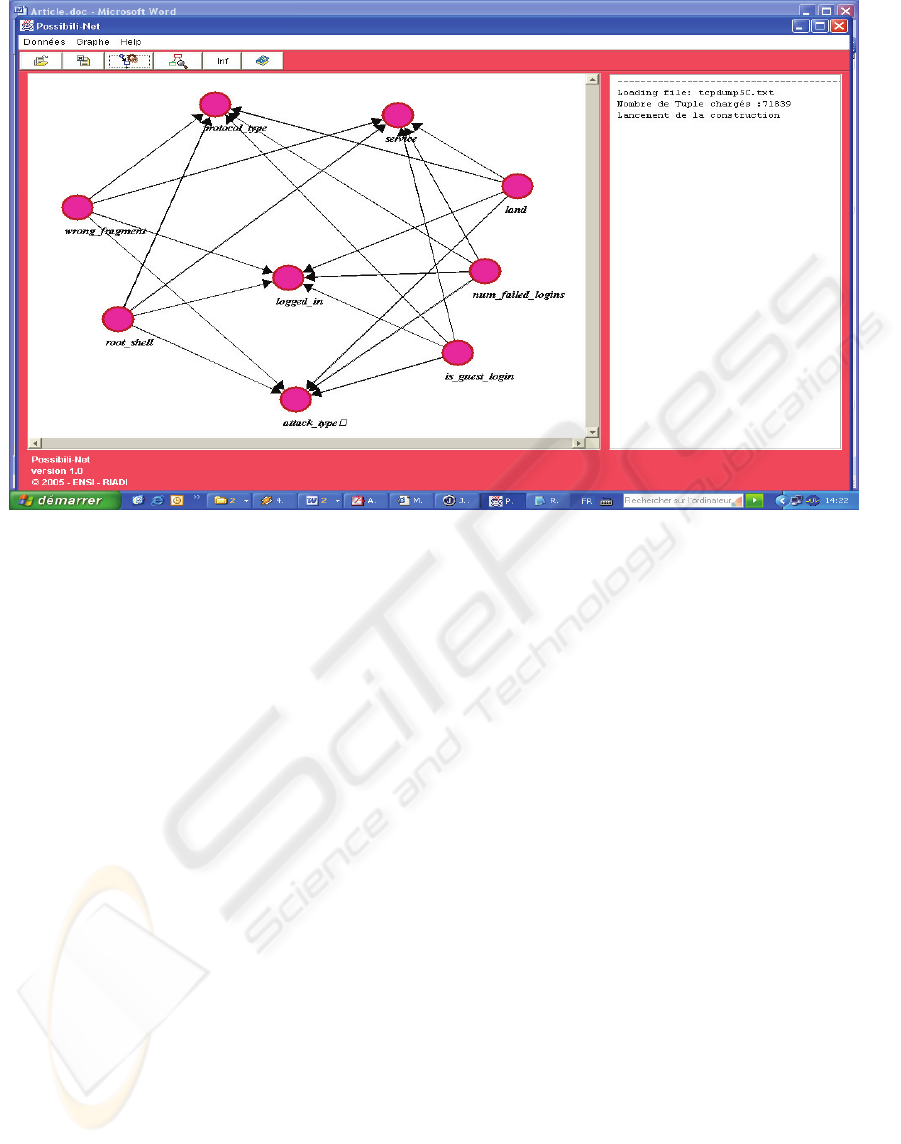
Figure 2 : HCS Possibilistic Network.
Figure 2 shows the Possibilistic Network
constructed by using HCS algorithm applied to the
same DARPA’99 experimentation data used when
constructing Bayesian network.
8 JUNCTION TREE INFERENCE
ALGORITHM
The most common method to perform discrete exact
inference is the Junction Tree algorithm developed
by Jensen (Jensen Frank et al.,1994)
The idea of this procedure is to construct a data
structure called a junction tree which can be used to
calculate any query through message passing on the
tree.
For Bayesian and possibilistic networks, we used
junction tree algorithm (JT). The first step of JT
algorithm creates an undirected graph from an input
DAG through a procedure called moralization.
Moralization keeps the same edges, but drops the
direction, and then connects the parents of every
child. Junction tree construction follows four steps:
JT Inference Step1: Choose a node
ordering. Note that node ordering will make a
difference in the topology of the generated
tree. An optimal node ordering with respect to
the junction tree is NP-hard to find.
JT Inference Step2: Loop through the nodes
in the ordering. For each node Xi, create a set
Si of all its neighbours. Delete the node Xi
from the moralized graph.
JT Inference Step3: Build a graph by letting
each Si be a node. Connect the nodes with
weighted undirected edges. The weight of an
edge going from Si to Sj is |Si ∩ Sj |.
JT Inference Step4: Let the junction tree be
the maximal-weight spanning tree of the
cluster graph.
9 EXPERIMENTATION
RESULTS
After training both networks, as like as any data
mining tools, they have been tested in order to know
the gap between system results and reality. Two
main criteria have been used when comparing
Bayesian and possibilistic networks: detection rate
and false alarms rate.
9.1 Detection Rate
Detection rate is defined as the number of examples
correctly classified by network (Bayesian or
possibilistic) divided by the total number of test
COMPARATIVE STUDY BETWEEN BAYESIAN NETWORK AND POSSIBILISTIC NETWORK IN INTRUSION
DETECTION
29
examples, when comparing network inference
results to DARPA KDD’99 data set.
In the case of five-classes of connections,
training connexions are used to be labelled as either
normal or attack with a specific type : DOS,
Probing, R2L, U2R (U2R only in Possibilistic case)
by both Bayesian and Possibilistic Networks.
Whereas R2L and U2R connections (U2R only in
Bayesian case) are less classified, their low detection
rates can be explained by the weak proportion of
R2L and U2R training connexions. Indeed training
data base contains only 0.23% of R2L connexions
and 0.01% of U2R connexions.
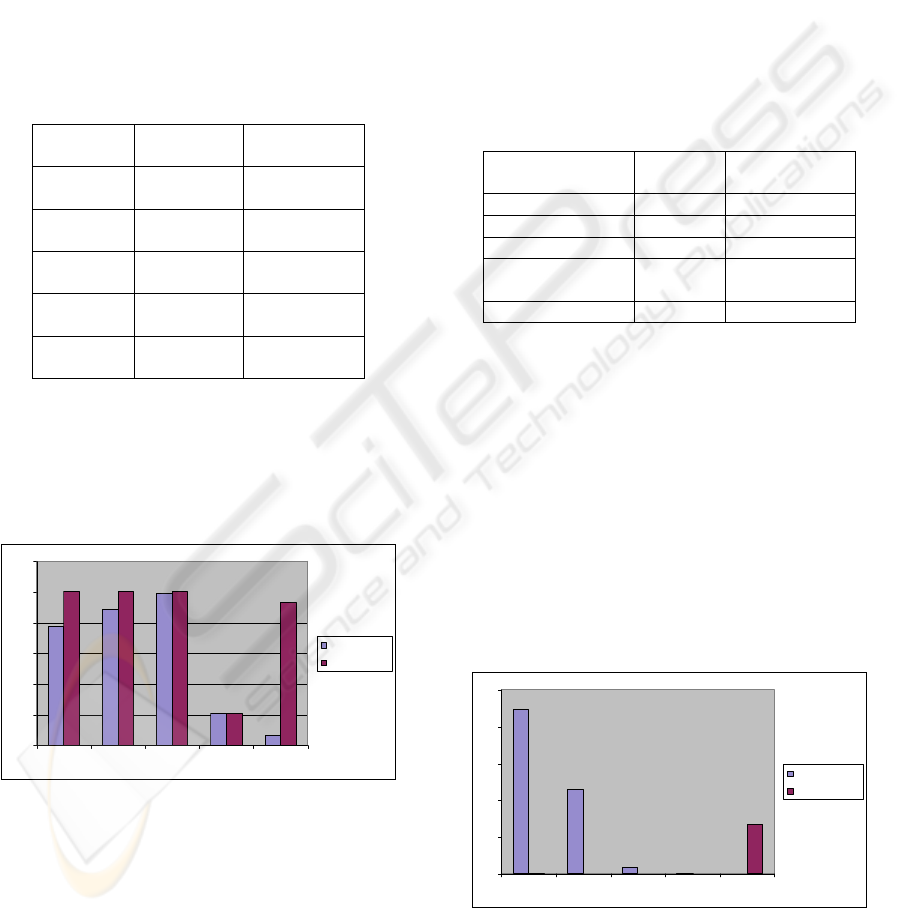
Table 1: Detection Rate Comparison.
Bayesian
Network
Possibilistic
Network
Normal
(58714)
77.68 % 99.92 %
DOS
(61960)
88.64% 100%
Probing
(827)
99.15% 100%
R2L
(3046)
20.88 % 20.91 %
U2R
(15)
6.66% 93.33%
Table 1 shows a performance of Possibilistic
network in detection of Normal, DOS, Probing and
U2R connexions. As figure 3 shows, in most cases,
possibilistic network provides the highest rates in
detection rate comparison study.
0
20
40
60
80
100
120
Normal DOS Probing R2L U2R
Bayesia-Net
Possibili-Net
Figure 3: Detection Rate Comparison.
From another viewpoint of comparison, we tried
to know the rate of bad intrusion detection in each
class when confusion was made between two
intrusion detection classes. Table2 presents the
classification rates of each class into the four others
classes.
9.2 False Alerts
Bayesian and Possibilistic networks can generate
two types of false alerts: False negative and false
positive alarms. False negative describe an event
that the IDS fails to identify as an intrusion when
one has in fact occurred. False positive describe an
event, incorrectly identified by the IDS as being an
intrusion when none has occurred.
In possibilistic case, we consider a false negative
when possibilistic network gives a possibility
Π(Normal) equal to 1.0 for an attack class and we
consider a false positive when it gives a possibility
П(Normal) equal to 0 for Normal class.
Table 2: False alerts rate comparison.
Bayesian
Network
Possibilistic
Network
Normal (58714) 22.32% 8.35 E-2%
DOS (61960) 11.36% 0%
Probing (827) 0.85% 0%
R2L (3046)
6.5659
E-2 %
3.2829 E-2 %
U2R (15) 0.00% 6.66%
As figure 4 shows, Table 2 describes the gap
between false alerts results given by two networks
for three first classes Normal, DOS and Probing.
Possibilistic Network is more efficient in these three
classes of intrusion detection and gives very small
false alerts rates.
For R2L and U2R classes, Possibilistic Network
gives more important false alerts rates than Bayesian
Network. All U2R connexions are identified as
intrusion by Bayesian classifier but with a low rate
equal to 6.66%. Possibilistic Network detects
93.33% positively and gives 6.66% connections as
false negative.
0
5
10
15
20
25
Normal DOS Probi ng R2L U2R
Bayesian-Net
Possibili-Net
Figure 4: False alerts rate comparison.
Table 3 shows a synthetic summary view of
comparative study conducted in this paper.
SECRYPT 2006 - INTERNATIONAL CONFERENCE ON SECURITY AND CRYPTOGRAPHY
30

Possibilistic Network showed superiority compared
to Bayesian network: it has the high intrusion
detection rate and a less false alerts.
Table 3: Summary of Comparison.
Bayesian
Network
Possibilistic
Network
Detection
Rate
81 .88 % 98.03 %
False
alerts
16.18 %
4.09 E-2%
10 CONCLUSION
Results of this paper comparison study demonstrated
that Possibilistic Network is globally net superior
than Bayesian Network when detecting intrusion
with a high detection rate and very accepted false
alarms rate.
We considered this study as global comparison
and we have to do local comparison which can show
performance of each network when detecting a
specific cluster of attack types.
Local comparison can be used to develop an
intelligent predictor selector. This new intelligent
module can acts in tow manners: If there is a net
superiority of each of tow networks BN and PN then
only one of two network prediction results will be
selected. In the other case, when, combination of
two networks prediction results can be done.
REFERENCES
Axelsson S., 1999. The Base-Rate Fallacy and its
Implications for the Difficulty of Intrusion Detection.
In 6th ACM Conference on Computer and
Communications Security.
Benferhat S. and Smaoui S., 2005. Possibilistic networks
with locally weighted knowledge bases. 4th
International Symposium on Imprecise Probabilities
and Their Applications, Pittsburgh, Pennsylvania.
DARPA, 1999. Knowledge discovery in databases
DARPA archive. Task Description
http://www.kdd.ics.uci.edu/databases/kddcup99/task.h
tml .
Dubois D. and Prade H., 1998. Possibility theory: An
approach to computerized processing of uncertainty.
Plenum Press, New York.
Gebhardt J. and Kruse R., 1995. Learning possibilistic
networks from data, in: Proceedings of the Fifth
International Workshop on Artificial Intelligence and
Statistics, Fort Lauderdale, FL.
Higashi M., Klir G.,1983. Measures of uncertainty and
information based on possibility distributions,
International Journal of General Systems 9, 103:115.
ISTG, 1998. The 1998 intrusion detection off-line
evaluation plan. MIT Lincoln Lab., Information
Systems Technology Group.
http://www.11.mit.edu/IST/ideval/docs/1998/id98-
eval-11.txt .
Jensen F., 2001. Bayesian Networks and Decision Graphs.
Springer, New York, USA.
Jensen Frank, Jensen Finn V. and Dittmer Soren L,1994.
From influence diagrams to junction trees.
Proceedings of UAI.
Johansen Krister and Lee Stephen, 2003. Network
Security: Bayesian Network Intrusion Detection
(BNIDS) May 3.
Kayacik, G. H., Zincir-Heywood, A. N., 2005. Analysis of
Three Intrusion Detection System Benchmark Datasets
Using Machine Learning Algorithms, Proceedings of
the IEEE ISI 2005 Atlanta, USA.
Klir G. and Folger T., 1988. Fuzzy Sets, Uncertainty and
Information, Prentice-Hall, Englewood Cliffs, NJ.
Kruegel Christopher, Darren Mutz William, Robertson
Fredrik Valeur, 2003. Bayesian Event Classification
for Intrusion Detection Reliable Software Group
University of California, Santa Barbara.
Kruse Rudolf and Borgelt Christian, 2001. Possibilistic
Networks: Data Mining Applications. Dept. of
Knowledge Processing and Language Engineering.
Otto-von-Guericke University of Magdeburg
Universität splatz 2, D-39106 Magdeburg, Germany.
Pearl J., 1997. Probabilistic Reasoning in Intelligent
Systems: Networks of Plausible Inference. Morgan
Kaufmann
Rudzonis C. Brian, 2003. Intrusion Prevention: Does it
Measure up to the Hype? SANS GSEC Practical
v1.4b.
Sanguesa R., Cabos J., Cortes U., 1988. Possibilistic
conditional independence: A similarity-based measure
and its application to causal network learning.
International Journal of Approximate Reasoning 18,
145-167.
Sanguesa R., Cortes U., 1997. Learning causal networks
from data: a survey and a new algorithm for
recovering possibilistic causal networks. AI
Communications 10, 31–61.
COMPARATIVE STUDY BETWEEN BAYESIAN NETWORK AND POSSIBILISTIC NETWORK IN INTRUSION
DETECTION
31
