
ON THE SELF-SIMILARITY OF THE 1999 DARPA/LINCOLN
LABORATORY EVALUATION DATA
Kun Huang
1
, Dafang Zhang
2
1
School of Computer and Communication,
2
School of Software,Hunan University, Changsha, Hunan 410082, P.R. China
Keywords: Intrusion detection, Evaluation data, Network traffic, Self-similarity.
Abstract: While intrusion detection systems (IDSs) are becoming ubiquitous defence, no comprehensive and
scientifically rigorous benchmark is available to evaluate their performances. In 1998 and again in 1999, the
Lincoln Laboratory of MIT conducted a comprehensive evaluation of IDSs and produced the DARPA
off-line evaluation data to train and test IDSs. However, there is the lack of detailed characteristics of the
DARPA/Lincoln Laboratory evaluation data. This paper examines the self-similarity of the 1999
DARPA/Lincoln Laboratory evaluation data sets for training and indicates that the evaluation data clearly
exhibits self-similarity during preceding tens of hours period, while not during other time periods. Also the
likely causes failing self-similarity are explored. These finding results can help evaluators to understand and
use the 1999 DARPA/Lincoln Laboratory evaluation data well to evaluate IDSs.
1 INTRODUCTION
Intrusion detection systems (IDSs) are an important
component of defensive measures protecting
computer systems and networks from rapidly
growing unauthorized intrusion (Denning, 1987).
Numerous different intrusion detection technologies
have been developed and deployed in realistic
environment.
While IDSs are becoming ubiquitous defence, no
comprehensive and scientifically rigorous
benchmark is available to evaluate their
performances. Current evaluation data for IDSs
(Puketza, 1996) can’t be shared publicly due to
privacy and security concerns. In 1998 and again in
1999, the Lincoln Laboratory of MIT conducted a
comprehensive evaluation of IDSs and released the
DARPA off-line evaluation data. The DARPA
evaluation data has been a widespread public
benchmark available to test both host-based and
network-based IDSs, and both signature-based and
anomaly-based IDSs.
IDSs under test are ultimately intended for use in
real network, so it is required that the evaluation data
for IDSs should be realistic. However, the DARPA
evaluation data is only claimed to be similar to real
network traffic, but not validated in literatures
(Richard, 2000; Lippmann, 2000). Since it is shown
that real network traffic captured from Local Area
Networks and Wide Area Networks statistically
exhibits the property of self-similarity (Leland, 1994;
Paxson, 1995; Beran, 1995), the 1999 DARPA
evaluation data which is attack-free network traffic
data for training should also exhibit self-similarity.
McHugh (McHung, 2001) criticizes many
aspects of the 1998 and 1999 DARPA/Lincoln
Laboratory evaluations, including questionable
collected evaluation data, attacks taxonomy, and
evaluation criteria. It is criticized that there is the
lack of statistical characteristics of the DARPA
evaluation data and no validation of similarity to real
network traffic. But the critique doesn’t quantify the
statistical characteristics of the synthetic evaluation
data and deeply explore the raised flaws and likely
causes.
This paper quantifies the statistical property of
self-similarity of the 1999 DARPA/Lincoln
Laboratory evaluation data and explores the likely
causes failing self-similarity. Our contribution will
help evaluators to understand and use the synthetic
evaluation data to train and test IDSs well.
The rest of this paper is organized as follows.
Section 2 overviews the 1999 DARPA evaluation
data. Section 3 gives a brief background of
self-similarity. In Section 4, the self-similarity of the
1999 DARPA evaluation data is explored. Finally,
Section 5 draws conclusions.
75
Huang K. and Zhang D. (2006).
ON THE SELF-SIMILARITY OF THE 1999 DARPA/LINCOLN LABORATORY EVALUATION DATA.
In Proceedings of the International Conference on Security and Cryptography, pages 75-80
DOI: 10.5220/0002096900750080
Copyright
c
SciTePress

2 SUMMARY OF 1999 DARPA
EVALUATION DATA
In 1998 and 1999, the Lincoln Laboratory of MIT
conducted a large-scale quantitative evaluation of
IDSs and publicly released the DARPA evaluation
data that would be a comprehensive benchmark
available through the Lincoln Laboratory website.
To sanitize privacy and security information and
eliminate impact of the operation of real network,
the Lincoln Laboratory developed a real network
traffic model, and then synthesized the normal
behaviours and attack scenarios in an isolated test
bed network (Lippmann, 2000).
The 1999 DARPA evaluation data includes three
weeks of training data with background traffic and
labeled attacks for tuning IDSs, and two weeks of
test data with background traffic and unlabeled
attacks. Every week of the evaluation data has five
weekdays and every day has about 22 hours from 8
AM to 6 AM of the next day, except for Thursday of
week 3 stopping at about 4 AM and Friday in week 3
ending at about 1 AM. Of the five weeks, only
weeks 1 and 3 are attack-free network traffic data
and the rest have been mixed with background traffic
(attack-free traffic) and injected attack traffic. So this
paper focuses on the attack-free background traffic
of weeks 1 and 3.
In week 1 and 3, the network traffic
predominantly occurred during between 8 AM to 6
PM every weekday, while hardly during the rest time.
Over IP layer, TCP and UDP packets dominate the
overall network traffic per day, while other protocols
packets are also generated. It’s noted that the inside
network traffic is nearly the same with the outside
network traffic.
3 BRIEF BACKGROUND OF
SELF-SIMILARITY
3.1 Definition and Properties of
Self-similarity
The most common way that a stochastic process is
called self-similarity with self-similarity parameter
(that is, Hurst parameter
H
), if the rescaled process,
with an appropriate rescaling factor, and the original
process have identical finite-dimensional
distributions (Leland, 1994).
Let
{, 0,1,2,}
t
XXt=="
be wide-sense stationary
stochastic process with mean
μ
, variance
2
σ
, and
autocorrelation function
(), 0rk k≥
and let
() ()
{,1,2,3,}
mm
k
XXk=="
denote the aggregated time series
process obtained by averaging the original time
series
X
over adjacent, non-overlapping blocks of
size
,( 1,2, )mm= "
, i.e.
()m
X
is given by
()
(1) 1
()/
m
kkm km
XX Xm
−−
=++"
. The process
X
is called
self-similarity if the distribution of each of the
corresponding aggregated process
()
,1
m
Xm≥
is equal
or approximately equal to that of the original
process
X
(Leland, 1994).
There are four main properties of self-similarity
process: Hurst effect, slowly decaying variance,
long-range dependence, and
f
/1
noise (Rose, 1996).
3.2 Estimating the Hurst Parameter
Various estimators of the Hurst parameter
H
are used
to examine whether a stochastic process exhibits
self-similarity and/or long-range dependence. There
are the following estimation methods (Rose, 1996).
Variance-time Plots The variance of aggregated
time series process
()
,1
m
Xm≥
is given by
()
var( ) ~
m
Xcm
β
−
,
or
()
log( ) ~ log( ) log( )
m
Xmc
β
−+
as
m →∞
, where c is some
positive constant and
10 <
<
β
. In the log-log plot
of the sample variance versus the aggregation level,
a straight line with slope
β
−
would be estimated,
thus since
1/2H
β
=−
,
H
can be estimated.
R/S Analysis The R/S statistics are shown
by
[()/()]~
H
ERm Sm cm
, or
([()/()])~ log() log()logERm Sm H m c+
as
m →∞
, where
0.5 1H
<
<
. In the log-log plot of the
R/S statistics versus the number of points of the
aggregated series, the slope of the straight line would
be an estimation of the Hurst parameter
H
.
Periodogram Method This method plots the
logarithm of the spectral density of a time series
process versus the logarithm of the frequencies, that
is
log( ( )) ~ ( ) log( ) log( )
f
c
λ
γλ
−
+
as
0
λ
→
, where
01
γ
<
<
,
(1 ) / 2H
γ
=
+
and
c
is some positive constant, and the
slope of the straight line is estimated for Hurst
parameter. The periodogram is given
by
2
1
() | () |/(2 )
N
ij
j
I
Xje N
λ
λπ
=
=
∑
, where
λ
is the frequency,
N
is the length of the time series and
X
is the actual
time series. The periodogram
()
I
λ
is an
asymptotically unbiased estimate of the spectral
density
()f
λ
.
Whittle’s Maximum Likelihood Estimator
(MLE) Since the periodogram is not appropriate to
estimate the spectral density, the Whittle’s MLE is
SECRYPT 2006 - INTERNATIONAL CONFERENCE ON SECURITY AND CRYPTOGRAPHY
76

used to estimate the spectral density by minimizing
an approximate log-likelihood function applied to
the spectral density, thus to obtain the estimation of
Hurst parameter and produce the confidence interval.
The more detailed description of MLE is seen in
(Rose, 1996). However, it is noted that Whittle’s
MLE only make a accurate estimation if it is known
that the process is self-similar.
Abry-Veitch Wavelet-based Analysis This
method computes the Discrete Wavelet Transform,
averages the sequences of the coefficients of the
transform, and then performs a linear regression on
the logarithm of the average, versus the log of
j
, the
scale parameter of the transform. The result should
be directly proportional to
H
. The more detailed
description is seen in (Rose, 1996).
4 EXPERIMENTAL RESULTS
Self-similarity of attack-free training data of the
1999 DARPA/Lincoln evaluation data set is
examined using above five estimation methods of
Hurst parameters. Since the last two methods are
used to provide an accurate estimate if the process is
self-similar, the preceding three methods are used to
check whether the process is self-similar or not and
the last two methods are used to estimate Hurst
parameter accurately.
It is assumed that H
var
, H
R/S
, H
Whittle
, and H
Abry-Veith
represent the estimated Hurst parameter by
respectively using variance-time plots, R/S analysis,
periodogram method, Whittle’s MLE and
Abry-Veitch Wavelet-based analysis, and H
avg
represents the average of estimated Hurst parameters.
If 0.5<( H
var
+ H
R/S
+ H
Whittle
)/3<1, H
avg
is the average
of above five estimated Hurst parameters; otherwise
H
avg
=( H
var
+ H
R/S
+ H
Whittle
)/3.
4.1 Examining Self-similarity
The total counts of frame arrival are recorded in each
0.3-second interval. Thus above five estimation
methods are used to estimate the Hurst parameters
and compute the average values during each 1 hour
with 12 000 sample points. The Hurst estimates of
frame counts arrival process of week 1 on the inside
and outside network are shown in Figure 1 (a) and (b)
respectively. Similarly, Figure 2 shows the Hurst
estimates of frame counts arrival process of week 3
on the inside and outside network.
It is denoted by Figure 1 that the evaluation data
clearly exhibits self-similarity during all of 08 AM to
09 PM periods every weekday of week 1 on the both
inside and outside network. Figure 2 also shows that
the evaluation data clearly exhibits self-similarity
during all of 08 AM to 07 PM periods every
weekday of week 3 on the inside network and during
all of 08 AM to 10 PM periods every weekday of
week 3 on the outside network. During the other
time of week 1 and 3, the 1999 DARPA evaluation
data can’t clearly exhibits the property of
self-similarity, and especially the Hurst parameter
values are undulated, which means that sometimes
the evaluation data exhibits self-similarity and
sometimes it fails. Table 1 shows these periods of
week 1 and 3 when the evaluation data fails
self-similarity.
At the same time, Figure 1, Figure 2 and Table 1
show that except on Monday of week 1, and on
Tuesday and Wednesday of week 3, the evaluation
data on the inside network exhibits different
self-similarity from that on the outside network,
although synthetic traffic is generated to
intercommunicate and pass through both the inside
and outside network.
4.2 Investigating the Likely Causes
Failing Self-similarity
For those periods listed by Table 1, which fail to
exhibit self-similarity, the likely causes are
investigated as follows.
Second, certain application layer protocol (i.e.,
HTTP) generated by Poisson model absolutely
dominates the whole traffic packet distribution of the
evaluation data failing self-similarity. Figure 3 (b)
shows that during from 03 AM to 04 AM period on
Wednesday of week 3 HTTP packets dominate the
TCP services. Since HTTP activities are generated
by Poisson model, the whole packets trend to exhibit
Poisson model and fails self-similarity.
Final, UDP dominates the whole traffic and
dilutes the effect of TCP that maintains the property
of self-similarity. Figure 3 (c) shows that during
from 00 AM to 06 AM on Monday of week 1, UDP
dominates the whole traffic on the inside network.
Since it is indicated by Park (Park, 1996) that the
reliable TCP serve to maintain the self-similarity and
the unreliable and no-flow-controlled UDP results in
showing little self-similarity. So UDP dominates the
whole traffic and dilutes the effect of TCP, which
results in failing self-similarity.
ON THE SELF-SIMILARITY OF THE 1999 DARPA/LINCOLN LABORATORY EVALUATION DATA
77
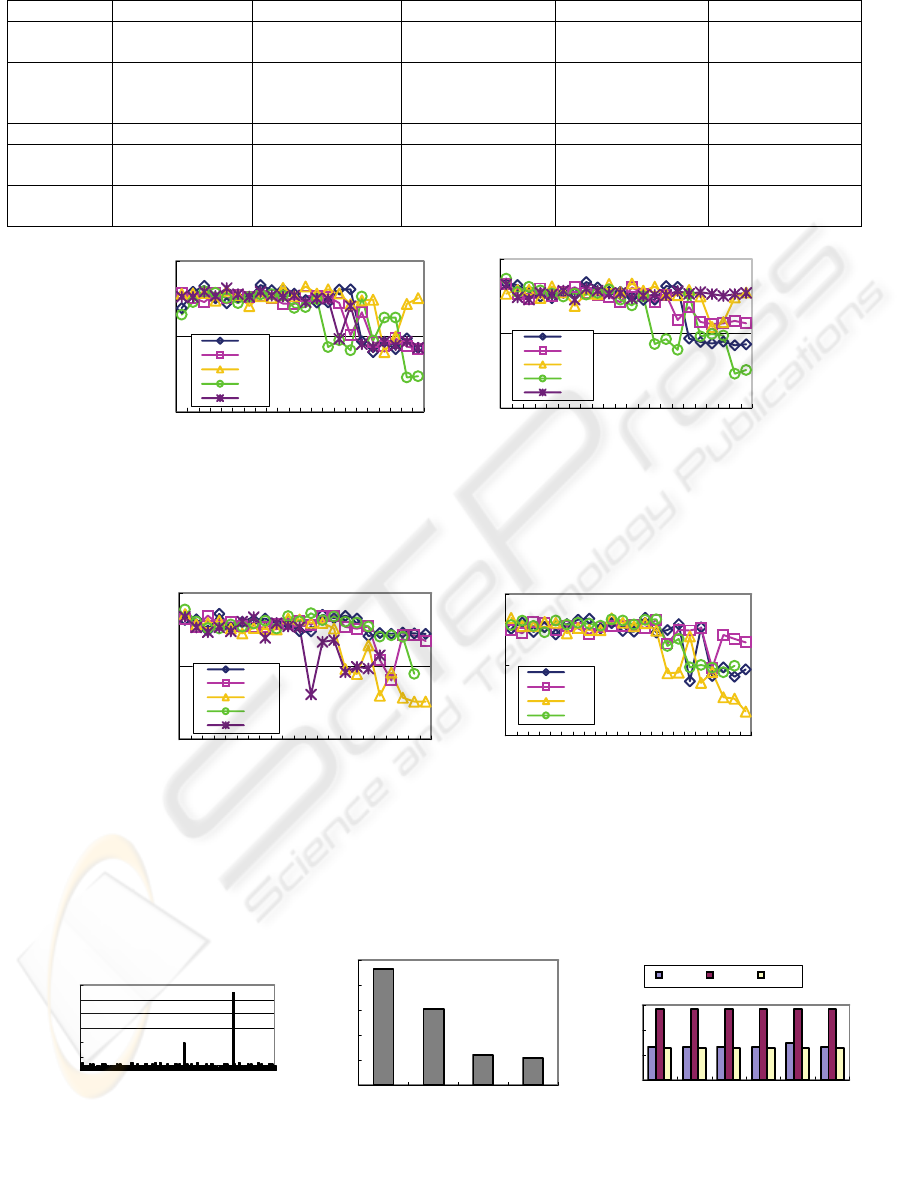
Table 1: Periods of week 1 and 3 that fail to exhibit self-similarity.
0.0
0.5
1.0
12345678910111213141516171819202122
Hour
Hurst Estimates
Mon
Tue
Wed
Thu
Fri
0.0
0.5
1.0
12345678910111213141516171819202122
Hour
Hurst Estimates
Mon
Tue
Wed
Thu
Fri
Figure 1: Hurst estimates of frame counts process in week 1 on the inside and outside network.
0.0
0.5
1.0
1 2 3 4 5 6 7 8 9 10111213141516171819202122
Hour
Hurst Estimates
Mon
Tue
Wed
Thu
Fri
0.0
0.5
1.0
12345678910111213141516171819202122
Hour
Hurst Estimates
Mon
Tue
Wed
Thu
Figure 2: Hurst estimates of frame counts process in week 3 on the inside and outside network.
02 AM to 03 AM On Tuesday Week 1
0
20
40
60
80
100
120
1 201 401 601 801 1001
Bin Size 3 Seconds
Packet Counts Per
Bin
43296
1101
16
12
1
10
100
1000
10000
100000
HTTP TELNET SSH Ot her s
TCP Ser v i c es
Packet Count s
1
100
10000
1000000
00-01 01-02 02-03 03-04 04-05 05-06
Time of Day
Packet Counts
TCP UDP ICMP
Figure 3: The likely causes failing self-similarity are investigated.
Week 1 Mon Tue Wed Thu Fri
Inside
Network
00 A.M.~ 06 A.M. 21 P.M. ~ 00 A.M.
01 A.M.~ 06 A.M.
Outside
Network
00 A.M.~ 06 A.M. 01 A.M. ~ 06 A.M. 02 A.M.~ 04 A.M. 21 P.M. ~ 00 A.M.
01 A.M ~ 02 A.M.
04 A.M. ~ 06 A.M.
22 P.M. ~ 23 P.M.
00 A.M. ~ 06 A.M.
Week 3 Mon Tue Wed Thu Fri
Inside
Network
02 A.M. ~ 03 A.M. 22 P.M. ~ 00 A.M.
01 A.M. ~ 06 A.M.
04 A.M. ~ 05 A.M. 19 P.M. ~ 20 P.M.
22 P.M. ~ 01 A.M.
Outside
Network
00 A.M. ~ 01 A.M.
02 A.M. ~ 06 A.M.
02 A.M. ~ 03 A.M. 22 P.M. ~ 00 A.M.
01 A.M. ~ 06 A.M.
00 A.M. ~ 05 A.M.
(a) Inside network
(b) Outside network
(a) Inside network (b) Outside network
(a) Traffic rates (b) Application protocol distribution (c) TCP, UDP, ICMP packet distribution
SECRYPT 2006 - INTERNATIONAL CONFERENCE ON SECURITY AND CRYPTOGRAPHY
78

4.3 Related Work
Allen and Marin (Allen, 2003) examine the
attack-free training data for the presence of
self-similarity in various time periods by using
periodogram method and Whittle’s MLE. Their
finding results show that the 1999 DARPA
evaluation data exhibits self-similarity during from
08 AM to 06 PM periods, while our results show that
the evaluation data does during from 08 AM to 09
PM periods of week 1 on both inside and outside
network, and during from 08 AM to 07 PM periods
of week 3 on the inside network and from 08 AM to
10 PM periods on the outside network.
Compared with (Allen, 2003), we provide more
accurate and detailed Hurst parameter values by
using more estimation methods, and consider the
difference of the evaluation data on the inside
network from that on the outside network.
5 CONCLUSIONS
This paper examines the self-similarity of the 1999
DARPA/Lincoln Laboratory evaluation data by
using five estimation methods of Hurst parameter.
The experimental results denote that the evaluation
data clearly exhibits self-similarity during from 08
AM to 09 PM periods of week 1 on both inside and
outside network, and during from 08 AM to 07 PM
periods of week 3 on the inside network and during
from 08 AM to 10 AM periods on the outside
network, while during other time periods it fails
self-similarity.
Three likely causes failing self-similarity are
explored as follows: (1) traffic rate is too lower (2)
certain application-level protocol (i.e., HTTP)
generated by Poisson model absolutely dominates
the whole traffic;(3) UDP dominates the whole
traffic and dilutes the effect of TCP, which result in
showing little self-similarity. Our findings would
help evaluators to use the evaluation data well to
evaluate IDSs.
ACKNOWLEDGEMENTS
This work is supported by the National Natural
Science Foundation of China under Grant
No60473031.
REFERENCES
Denning, D.E., 1987.An intrusion-detection model. IEEE
Transactions on Software Engineering, Vol.13,
pp.222-232
Puketza, N., Zhang, K., Chung, M., et al, 1996. A
methodology for testing intrusion detection systems.
IEEE Transactions on Software Engineering, Vol.22,
pp. 719-729
Richard, P., Lippmann, R., Fried, D., et al, 2000.
Evaluating intrusion detection systems: the 1998
DARPA off-line intrusion detection evaluation. Proc.
of the 2000 DARPA Information Survivability
Conference and Exposition, Hilton Head, South
Carolina, pp.12-26
Lippmann, R., Haines, J., Fried, D., et al, 2000.The 1999
DARPA off-line intrusion detection evaluation.
Computer Networks, Vol.34, pp.579-595
Lippmann, R., Haines, J., Fried, D., et al, 2000.Analysis
and results of the 1999 DARPA off-line intrusion
detection evaluation, Proc. of Third International
Workshop on Recent Advances in Intrusion Detection,
Toulouse, France 162-182
McHung, J., 2001.Testing intrusion detection systems: a
critique of the 1998 and 1999 DARPA intrusion
detection system evaluations as performed by Lincoln
laboratory. ACM Transactions on Information and
System Security, Vol.3, ppt.262-294
Leland, W., Taqqu, M., Willinger, W., et al, 1994.On the
self-similar nature of Ethernet traffic. IEEE/ACM
Transactions on Networking, Vol.2, pp.1-15
Paxson, V., Floyd, S., 1995.Wide-area traffic: the failure
of Poisson modeling. IEEE/ACM Transactions on
Networking, Vol.3, pp.226-244
Beran, J., Sherman, R., Taqqu, M., et al, 1995 .Long-range
dependence in variable bit-rate video traffic. IEEE
Transaction on Communications, Vol.43, pp.556-1579
MIT Lincoln Laboratory, 2003.Intrusion detection
evaluation web site. http://www.ll.mit.edu/IST/ideval
Rose, O., 1996. Estimation of the hurst parameter of
long-range dependent time series. Technical Report
No.137, Institute of Computer Science, University of
Würzburg
Park, K., Kim, G., Crovella, M., 1996.On the relationship
between file sizes, transport protocols, and self-similar
network traffic. In: Proc. of 4th International
Conference on Network Protocol, pp.171-180
Allen, W. H., Marin, G. A., 2003.On the self-similarity of
synthetic traffic for the evaluation of intrusion
detection. Proc. of the 2003 Symposium Applications
and the Internet, pp.242-248
ON THE SELF-SIMILARITY OF THE 1999 DARPA/LINCOLN LABORATORY EVALUATION DATA
79
