
WEIGHT UPDATING METHODS FOR A DYNAMIC WEIGHTED
FAIR QUEUING (WFQ) SCHEDULER
Gianmarco Panza, Valentin Besoiu
CEFRIEL Network Systems Unit, Milan, Italy
Catherine Lamy-Bergot
THALES Communications, Colombes, France
Filippo Sidoti, Roberto Bertoldi
WIND Telecomunicazioni S.p.A., Rome, Italy
Keywords: DiffServ, proportional services, QoS, weight updating, WFQ.
Abstract: This work aims to analyze different weight updating methods for a dynamic Weighted Fair Queuing (WFQ)
scheduler providing Quality of Service (QoS) guarantees for the applications of the IST PHOENIX project
and for new value-added services in general. Two weight updating methods are investigated in terms of
granted delays to concerned service classes and buffer utilization of the related queues at a given IP
interface. In particular, a novel weight updating based on the Knightly’s theory is proposed. Simulation
results have demonstrated that a dynamic WFQ based on either of the weight updating methods can well
support a proportional relative model of QoS in a Diff-Serv architecture in an IP-based Next Generation
Network. The designed system is extremely simple and effective, and with low computational overhead by
employing an innovative technique to evaluate the trend of the entering traffic aggregates, in order to trigger
a scheduler’s weights updating only when needed.
1 INTRODUCTION
The PHOENIX IST project main goal is to
effectively exploit the available bandwidth on
wireless links (WLAN, UMTS, 4G…) that is
dynamic by nature, providing optimised solutions
for multimedia transmission over IP-based wireless
networks. To reach this goal, a scheme was
developed (PHOENIX) offering the possibility to let
the application world (source coding, ciphering) and
the transmission world (channel coding, modulation)
talk together over an IP protocol stack, so that they
can jointly develop an end-to-end optimised wireless
communication (termed as JSCC/D compliant
system).
However, adequate Quality of Service (QoS)
guarantees must be provided along the
communication path through-out the network, both
for the user data and the control/signalling
information to be exchanged.
Advances in computing and network
technologies have made it possible to support QoS
guarantees in packet switching network. There are
two approaches: the Integrated Service (IntServ)
(Wroclawski, 1997) and Differentiated Service
(DiffServ) (Nichols, 1998)(Blake, 1998). IntServ
tried to ensure end-to-end and per flow QoS of data
traffics. However, it is quite difficult to implement
on a large scale, such as in the Internet. For this
reason, DiffServ, which only provides a limited
number of service classes, was then proposed. It
aggregates the flows with the same QoS
requirements, and serves the packets according to
predefined traffic contracts. Instead of achieving
per-flow QoS, DiffServ provides guarantees at an
aggregate level.
Relative and absolute service differentiation are
two categories of the DiffServ model. Relative
DiffServ ensures the ratios of the quality level
between classes, while absolute DiffServ absolute
service guarantees. Obviously, the first is more
42
Panza G., Besoiu V., Lamy-Bergot C., Sidoti F. and Bertoldi R. (2006).
WEIGHT UPDATING METHODS FOR A DYNAMIC WEIGHTED FAIR QUEUING (WFQ) SCHEDULER.
In Proceedings of the International Conference on Signal Processing and Multimedia Applications, pages 42-49
DOI: 10.5220/0001567400420049
Copyright
c
SciTePress

straightforward to deploy as well as effective with
proper resource provisioning in the network. There
is a variant in this category, called proportional
service differentiation (Li, 2000).
Weighted Fair Queuing (WFQ) (Keshav, 1997)
is a scheduling discipline nowadays widely applied
to QoS-enabled routers. In WFQ, single flows or
traffic classes are served on the basis of the weight
assigned to the related queue. The weight can be
dynamically determined (Panza, 2005)(Li,
2000)(Kun, 2000) according to the mutual ratio
between QoS factors assigned to each queue in order
to achieve QoS guarantees, such as delay and loss, in
a proportional manner.
In this paper, two different methods for the
weight updating of a dynamic version of the WFQ
scheduler are analyzed and compared with respect to
the goal of effectively supporting a proportional
relative QoS model in a DiffServ architecture. As a
new proposal, the latter method is based on the
sophisticated Knightly’s theory (Knightly, 1998).
Moreover, the novel idea of applying a statistical
test allows to save computational power by
triggering a weight updating when needed only.
The remainder of this paper is organized as
follows. Next section briefly explains the main
achievements in the field, concerning dynamic
versions of WFQ, as well as Knightly’s theory, the
basis for the novel weight updating method. Then, a
description of the work is carried out, the most
relevant simulation results and analyses are
presented.
Finally, last section summarizes the main
achievements and conclusions.
2 WEIGHTED FAIR QUEUEING
DISCIPLINE AND KNIGHTLY’S
THEORY
2.1 Dynamic WFQ
A Dynamic WFQ (Panza, 2005)(Li, 2000)(Kun,
2000) is able to dynamically and consistently adapt
the queue weights according to the time-variant
amount of the incoming traffic and the pre-assigned
target QoS.
The fundamental issue is to correlate the
burstiness of the traffic with the weight value in
order to achieve given delay and loss guarantees.
The measurement of the burstiness of the
aggregate entering each queue could be realized by
evaluating the resulting buffer dimension (Panza,
2005)(Li, 2000), which is ultimately related to the
worst-case delay experienced by packets in the
queue.
For what concerns the QoS, we aim to support a
proportional relative model. Each queue is assigned
a static factor so that the guarantees provided to the
set of queues should be in line with the mutual ratio
of the said factors. For example, if the queue Qi and
Qj have the factors Pi and Pj respectively, with
Pj=2Pi, the QoS provided to Qj should be two times
better then the one granted to Qi. Hence, no absolute
QoS assurances are supported in this case.
As proposed in (Panza, 2005)(Li, 2000), where
also preliminary results are reported, if in a given
interval Tn, Bn represents the average buffer filling
of Qn, which is associated with the factors Pn, the
queue weights could be determined by the resolution
of a linear system whose equations are of the form:
(Bi/Bj)(Pi/Pj) = (Wi/Wj)
where, Wi and Wj are the weights to be assigned to
the queues Qi and Qj, respectively.
2.2 Knightly’s Theory
Knightly’s theory (Knightly, 1998) is based on a
parametric characterization of the traffic, referring to
an analytical representation, in terms of a temporal
function, of the cumulative arrivals process for the
concerned traffic. This can be described by a
specific traffic constraint function, i.e. a function of
temporal variables that represents an upper-bound
envelope. It is a model for the arrival traffic derived
from the classic leaky bucket characterization of the
arriving cumulative traffic, a monotonically
increasing piece-wise function b(t) of different
slopes. For each slope added to the model, two
further parameters are to be introduced (i.e.
intersection σ and angular coefficient ρ). For
example, a dual leaky bucket model has the
following analytical expression
b(t)=min{σ1+ ρ1 t, σ2+ ρ2 t} (1)
WEIGHT UPDATING METHODS FOR A DYNAMIC WEIGHTED FAIR QUEUING (WFQ) SCHEDULER
43

bits
1
'
σ
''
1
σ
2
'
σ
(
)
tb
2
(
)
tb
1
t
MTU
bits
1
'
σ
''
1
σ
2
'
σ
(
)
tb
2
(
)
tb
1
1
'
σ
''
1
σ
2
'
σ
(
)
tb
2
(
)
tb
1
1
'
σ
''
1
σ
2
'
σ
(
)
tb
2
(
)
tb
1
t
MTU
Figure 1: Examples of traffic constraint function of dual
and triple leaky bucket type (MTU = Maximum Transfer
Unit).
In the case of audio and video traffic flows, as
demonstrated by experimental analysis (Knightly,
1997), this function can be simply constituted by
two or three slopes (see the figure above for
example), respectively. If we denote with A
j
(t) the
number of bits generated by the source stream j in
the time interval [0, t], the function b
j
(t) represents
the arrival envelopes, and it verifies
A
j(t)
≤b
j
(t),
∀
t>0 (2)
Where A
j
(t) is a discrete random variable that
assumes values in the range [0, b
j
(t)], whose
statistical distribution is unknown.
The proposed model statistically characterizes
the traffic by means of the mean rate of the
transmission rate variance RV
j
(t) in the interval [0,
t]. Formally:
RV
j
(t)= σ
2
(A
t
(t)/t) φ
j
=lim
t
Æ
∞
(A
j
(t)/t) (3)
In the hypothesis of a stationary process for the
stream j it has been demonstrated that the variance is
upper limited, according to the relation:
RV
j
(t)≤((φ
j
b
j
(t))/t)-φ
j
2
(4)
An admission control algorithm can be applied
on a given link to the total traffic envelope obtained
as the sum of the envelopes related to the individual
traffic streams. Depending on the characterization of
the incoming traffic statistic, it is possible to
calculate (approximately, (Knightly, 1998)), the
probability that the permanence time D of a packet
in the considered network node be higher than a
given threshold d. This represents the violation
probability of the worst-case delay d on the
considered link, and is approximated by the
following expression:
P(D>d)≈
max
0≤t≤β
1/√(2π)exp[-(C(t+d)-μ(t))
2
/(2σ
2
(t))] (5)
where:
μ(t)=t·φ (6)
σ
2
(t)=t
2
·RV(t) (7)
β=min{t>0|b
j
(t)≤Ct} (8)
β indicates the time instant in which the service
linear function associated with the link capacity C(t)
crosses the envelope (modeled with a piece-wise
function) of the arrival traffic. This is the same
interval in which, if the traffic followed the worst-
case, it would see its own packets getting into the
buffer and wait for having access to the interface,
therefore experiencing delay.
This violation probability is upper limited by the
probability of the total backlog, that is the total
amount of packets in the time interval d (the
predefined limit on the delay), which exceed the
maximum number of packets that can be served in
the same period.
In (6) an approximation for a large traffic
aggregate composed of statistically independent
source flows was applied. By the central limit’s
theorem, it is possible to assume a Gaussian
distribution of the difference between the backlog
and the available service at the concerned link
interface.
3 WORK DESCRIPTION
The work aims to investigate two weight updating
methods for a dynamic WFQ scheduler in order to
achieve proportional relative QoS guarantees. The
former, see subsect. 2.1, based on the resolution of a
linear system, while the latter on Knightly’s theory,
as described in the next subsection.
Comparisons have been carried out in the same
working conditions, parameter settings and network
scenarios, as well as target QoS assurances.
SIGMAP 2006 - INTERNATIONAL CONFERENCE ON SIGNAL PROCESSING AND MULTIMEDIA
APPLICATIONS
44

3.1 A Dynamic WFQ Based on the
Knightly’s Theory
As stated in the previous paragraphs, the WFQ is the
concerned scheduling algorithm, enhanced with an
integrated method of measurement and
characterization of the traffic aggregates, which in
our context corresponds to the different classes of
service in a DiffServ-enabled 4G network, in order
to tune at run-time the weights of the different
queues.
In particular, for each traffic aggregate
distinguished by the DSCP value (Nichols, 1998),
the parameters of the characterizing traffic constraint
functions are measured or indirectly calculated.
Those parameters are: the mean rate, the burstiness,
the peak rate and the peak rate duration.
Actually, for an initial simulation analysis, the
updating mechanism is triggered by the result of an
effective statistical test (see subsect. 3.2) applied to
the average arrival rate only. The said test is
executed for all the incoming active aggregates at
the considered IP router interface. It is enough that
just one parameter (i.e. the average arrival rate in a
queue) presents a variation detected by the test (with
the assigned level of reliability), to force an updating
of the parameters of all the aggregates and a tuning
of the scheduler’s weights. If there’s no significant
change in a measurement period for the functional
parameters, the weights remain the same.
The newly proposed updating algorithm based on
Knightly’s theory has been designed with particular
attention to the number of operations to be executed.
The goal is to reduce as much as possible the
computational overhead, in order to have a solution
suitable even for broadband networks, where the
high value of the router service rate could entail
constraints on the complexity of the deployed
mechanisms.
The weight value for each queue is obtained
from a system of equations similar to (5) (subsect.
2.2), where the minimum service capacity to be
allocated to each queue is the parameter to calculate,
that in turns corresponds to the queue weight. Of
course, the system also fulfils the condition that the
sum of the bandwidth allocated to the queues must
be equal to the service rate of the router interface (in
(5) indicated as C
link
).
In practice, we have to deal with an N
th
order
equation, where the parameter d to be determined,
referring to the equation (5), represents the
maximum delay for the N
th
class (the class granted
with the best service in terms of delay). To be noted
that the maximum delay of each class can be
expressed in terms of the maximum delay of a given
class (in this case of the N
th
one) by means of the
assigned QoS factors.
This non-linear equation can be easily solved at
run time with an approximated algorithm based on
the well-known Newton iterative method that allows
to easily obtain the searched solution with a
configurable maximum error. More in detail, with an
extremely limited number of iterations (actually,
never more than 4), it is possible to determine the d
value with an error lower than a microsecond.
Newton’s algorithm needs an initial value for the
parameter to be determined. It is represented by the
value employed in the previous bandwidth allocation
(currently still valid).
Furthermore, we remind that the computational
overhead is dramatically reduced by the application
of the statistical test that leads to an updating
frequency of about 30% of the measurement
windows (with a reliability level of 90%).
3.2 An Effective Statistical Test
The t-Student test (Spiegel, 2000) application to a
set of empirical observations of rate values is
conditioned to the truth of the following
assumptions:
I. the samples are independent and with
identical distribution (iid)
II. the samples belong to a normal statistical
distribution.
Actually, by the Central Limit theorem (Spiegel,
2000) the test can be applied to whatever
distribution if the observation set is large enough (in
practice > 30).
The iid hypothesis is verified when the number
of observations is small compared to the population
cardinality (Spiegel, 2000).
With a proper measurement window length both
the assumption are valid (Cao, 2001)(Cao, 2002).
With a given reliability level, the test is positive
when the hypothesis “the traffic (i.e. the mean rate)
of a service class has not changed” is to be rejected.
3.3 Traffic Description and
Parameter Settings
We considered traffic aggregates composed of both
TCP and UDP flows. The latter, H.263 coded video
streams at different bit rates, ranging from 64 to 256
Kbit/s as mean value, generated by real traces
(H.263/MPEG4) of video streaming and
conferencing applications (see the table below for
more details). By their nature of typical compressed
video flows, the related bit rate is highly variable
with a burstiness factor (peak to mean rate ratio) of
even 10.
WEIGHT UPDATING METHODS FOR A DYNAMIC WEIGHTED FAIR QUEUING (WFQ) SCHEDULER
45

Table 1: Characteristics of a considered H.263 coded
video flow.
Encoder Input 176x144 pel (QCIF)
N° of pixels for Chrominance 88
Frame Rate 25 fps
Quantization Parameter 5
Pattern IBPBPBPBPBP
Integer pel search window 15 pels
Specifically, every traffic aggregate included 3
video streams at 64 Kbit/s and 12 video streams at
256 Kbit/s, for a total average rate (together with the
TCP flows) of about 22 Mbit/s.
For a second set of simulations, we also
generated H.264 JSCC/D compliant video flows
with a bit rate ranging from 60 to 320 Kbit/s. These
video flows concerns application scenarios such as
video-call, video on demand, video conference and
live news. More specifically, the related aggregate
included 16 video streams at 60 Kbit/s, 6 video
streams at 200 Kbit/s, 4 video streams at 220 Kbit/s
and 6 video streams at 320 Kbit/s for a total average
rate (together with the TCP flows) of about 22
Mbit/s.
The transmission interface was 100 Mbit/s (e.g.
from a FastEthernet network card), where a dynamic
WFQ scheduler managed 4 queues, each one fed
with a different aggregate and assigned with a QoS
factor equals to 1, 2, 3 and 4, respectively (i.e. the
traffic in the 4
th
queue granted with the best service
in terms of delay and loss).
For these simulation scenarios, we selected: a
time window measurement process of 1.8 s (Panza,
2005), a sampling period of 40 ms and a first-order
low pass filter having the zero (termed as k
parameter) equal to 0.95 in order to average the
gauged values. The measured magnitude is the
buffer filling for the weight updating method based
on the linear system resolution, whilst it is the
average arrival rate for the newly conceived one,
based on Knightly’s theory.
In the next section, we report and analyze the
simulation results, produced by means of OPNET
Modeler tool by OPNET Technology Inc..
4 SIMULATION RESULTS
4.1 Updating Method Based on the
Linear System
The t-Student test is applied in order to decrease the
weight update frequency. Of course, the actual
frequency depends on the traffic dynamic; but if the
last estimation of the traffic is still valid for all the
aggregates in the new time window, the queue
weights are not updated, thus saving computational
power.
The analysis has been carried out considering as
the measured and driving magnitude either the
buffer filling or the traffic mean rate, at the decision
times.
The minimum required buffer dimension in order
to avoid or bound the loss for that queue (when the
factors assigned to the other queue remain the same)
has been gauged both for the 99
th
and the 100
th
percentile of the delay. Of course, the latter value
corresponds to absence of loss. Even the average
delay in each queue and at the interface as a whole
are reported.
Table 2: Minimum buffer sizes for the 99
th
and 100
th
percentiles of the delay in the 4 queues.
Queue 99
th
perc. Min.
buffer size (bytes)
100
th
perc. Min.
buffer size (bytes)
1 89673 117963
2 75983 82864
3 59945 74254
4 55677 68501
Table 3: Average delay in each queue and at the interface
as a whole.
Queue Average Delay (ms) Average Delay at
the interface (ms)
1 1.808
2 0.934
3 0.701
4 0.549
0.998
It is worthwhile to point out that the statistical
test might not be applied, because the iid hypothesis
of the collected samples is not verified a priori (the
buffer dimension depends somehow on the story of
the system and this could introduce not negligible
correlation to be analyzed). Anyway, for the sake of
comparison between the two investigated weight
updating methods, we collected results with the test
application.
The 99
th
percentiles of the delay for the 4 queues
are 11.2, 6.7, 5.4 and 4.4 ms, respectively.
4.2 Updating Method Based on
Knightly’s Theory
For the sake of comparison, the same sources and
link were used for this set of simulations as in the
previous analysis (see subsect. 3.3). The driving
magnitude is the mean rate and the statistical test is
applied.
SIGMAP 2006 - INTERNATIONAL CONFERENCE ON SIGNAL PROCESSING AND MULTIMEDIA
APPLICATIONS
46
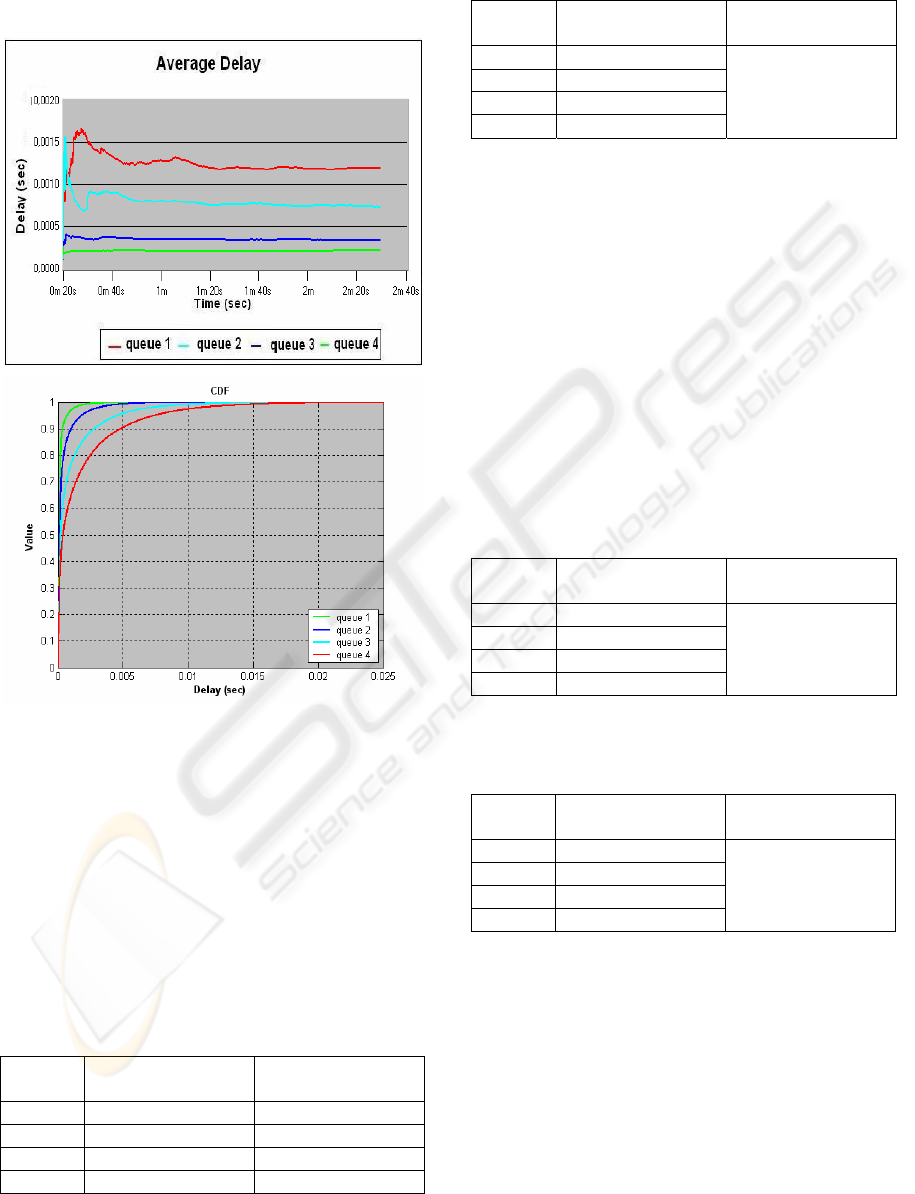
The graphs below depict the packet-by-packet
averaged delay and the CDF (Cumulative
Distribution Function) of the delay in the 4 queues.
Figure 2: Average delay and CDF of the packet-by-packet
delay.
As expected, the delay differentiation is still in
line with the assigned quality of service factors to
each queue: the higher the factor the lower the delay.
This is true even for the packet-by-packet delay
when collected in a bucket mode (i.e. every point in
the graph corresponds to the mean delay value about
a given number of consecutive packets).
The tables below report the relevant figures for
the buffer size and the delay for the different queues.
Table 4: Minimum buffer sizes for the 99
th
and 100
th
percentiles of the delay in the different 4 queues.
Queue 99
th
perc. Min.
buffer size (bytes)
100
th
perc. Min.
buffer size (bytes)
1 91945 111755
2 64382 108775
3 45734 65190
4 18030 55257
Table 5: Average delay in each queue and at the interface
as a whole.
Queue Average Delay (ms) Average Delay at
the interface (ms)
1 1.772
2 1.087
3 0.445
4 0.221
0.884
The 99
th
percentiles of the delay are 14.12, 9.58,
4.29 and 1.82 ms, respectively for the 4 queues.
4.3 Results with JSCC/D Compliant
Traffic Flows
An analysis for both the scheduling systems was
carried out also when one out of the four queues
(specifically, the first one) was feed with a traffic
aggregate composed by JSCC/D compliant video
flows. For an effective comparison, exactly the same
parameters were used and results collected. The
following tables report the average delay for the four
queues and for the interface as a whole.
Table 6: Average delay in each queue and at the interface
as a whole with the former weight updating algorithm.
Queue Average Delay (ms) Average Delay at
the interface (ms)
1 1.60
2 1.02
3 0.77
4 0.53
0.98
Table 7: Average delay in each queue and at the interface
as a whole with the Knightly’s theory based weight
updating algorithm.
Queue Average Delay (ms) Average Delay at
the interface (ms)
1 1.78
2 1.04
3 0.53
4 0.265
0.9
The graphs below depict the CDF of the delay in
the 4 queues obtained with the former scheduler and
the latter based on Knightly’s theory, respectively.
WEIGHT UPDATING METHODS FOR A DYNAMIC WEIGHTED FAIR QUEUING (WFQ) SCHEDULER
47
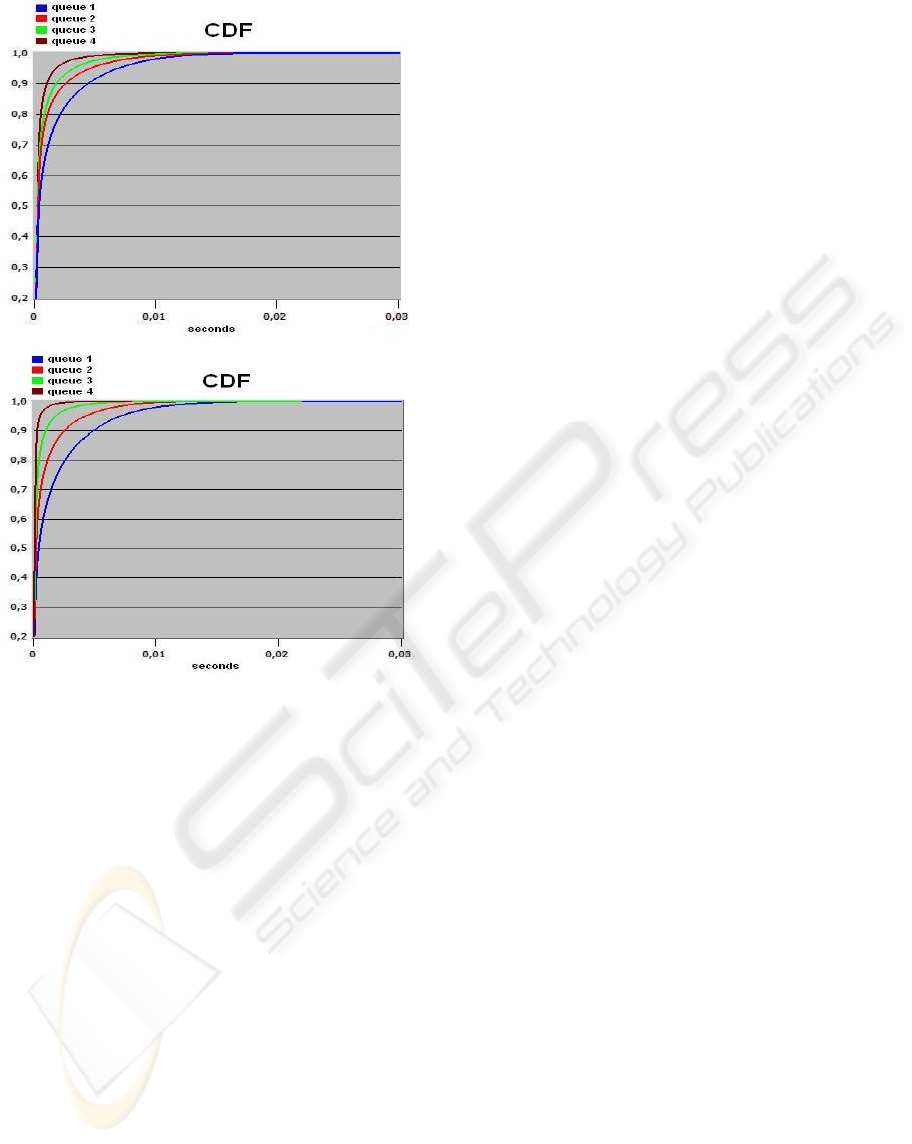
Figure 3: CDF of the delay when the weight updating
algorithm is either based on the linear system or
Knightly’s theory.
The 99
th
percentiles of the delay are 12.3, 10.0,
7.9 and 5.0 ms, respectively for the 4 queues when
the weight updating algorithm is based on the linear
system, and 12.57, 8.47, 4.76 and 1.92 ms, when the
weight updating is based on Knightly’s theory.
4.4 Analysis
The collected results about the buffer dimension and
the delay confirm the consistency of the designed
systems. A dynamic version of the WFQ scheduler
based on either the investigated weight updating
methods can provide QoS guarantees according to a
proportional relative model. The higher the assigned
quality of service factor to a given queue, the lower
the delay and the minimum required buffer
dimension in order to avoid or bound the loss for
that queue (when the factors assigned to the other
queue remain the same).
More specifically, we can observe that the traffic
aggregates in the 3
rd
and 4
th
queues (those assigned
with the greatest QoS factors) are granted a lower
delay when the updating is based on Knightly’s
theory, but the contrary happens to the 1
st
and 2
nd
queues. Such results are also confirmed by the
measurements about the buffer dimension.
Therefore, with the novel and more sophisticated
method a higher delay differentiation is provided
among classes of service.
Looking at the ratio between the figures of the
different queues for both the delays and the buffer
dimension, we can state that the weight updating
based on Knightly’s theory more effectively
differentiates the QoS provided to the different
traffic aggregates, which is more in line with the
assigned QoS factors.
The newly proposed weight updating mechanism
can provide a better differentiation in terms of
granted delays to the various configured classes of
service. This means higher performance in terms of
supporting a proportional relative model for QoS.
However, also the first mechanism achieves
good results, with a lower computational overhead.
5 CONCLUSIONS
In this work, we have investigated and analyzed two
different weight updating methods for a dynamic
version of the WFQ scheduler, i.e. where the
weights are tuned at run-time according to both the
actual traffic that enters each queue and the mutual
ratio between the QoS factors assigned to the
concerned classes of service at the considered IP
router interface.
A simulation analysis has been carried out in
network scenarios and with configuration parameters
suitable for DiffServ-enabled 4G networks.
Novel proposals for an updating method based
on the Knightly’s theory and the idea of applying a
statistical test able to save computational power,
have been described and deployed.
By analyzing the collected results about the
delays (99
th
percentile and average value) granted to
the various service classes and the buffer dimension
(to lose only the packets that experience a delay
greater than the 99
th
percentile or not at all), we can
conclude that the weight updating method based on
the Knightly’s theory is able to provide a better
differentiation in terms of granted delays to the
various configured classes of service, that is, higher
performance in terms of supporting a proportional
relative model for QoS. This has been verified with
traffic aggregates composed of either traditional
(non adaptive) or JSCC/D compliant video streams.
SIGMAP 2006 - INTERNATIONAL CONFERENCE ON SIGNAL PROCESSING AND MULTIMEDIA
APPLICATIONS
48

However, also the method built on a simple
system of linear equations achieves good results,
with a lower computational overhead.
The better selection between them, really
depends on the specific network scenario, the
required QoS guarantees for the classes of service to
be supported and the available computational
resources.
REFERENCES
PHOENIX: FP6 IST European project. http://www.ist-
phoenix.org/
Panza, G., Grazzioli, M., Sidoti, F., 2005. Design and
analysis of a dynamic Weighted Fair Queueing (WFQ)
scheduler. IST Mobile’05
Wroclawski, J., 1997. The Use of RSVP with IETF
Integrated Services, RFC 2210. IETF intserv WG.
September 1997
Nichols, K. et Al., 1998. Definition of the Differentiated
Services Field (DS Field) in the IPv4 and IPv6
Headers, RFC 2474. IETF diffserv WG. December
1998
Blake, S. et Al., 1998. An Architecture for Differentiated
Services, RFC 2475. IETF diffserv WG. December
1998.
Dovrolis, C., Ramanathan, P., 1999. A Case for Relative
Differentiated Services and the Proportional
Differentiation Model, ACM SIGCOMM. Sept. 1999
Li, C-C., Tsao S-L., Chen, M. C., Sun, Y., Huang, Y-M.,
2000. Proportional Delay Differentiation Service
Based on Weighted Fair Queuing, Computer
Communications and Networks. 2000
Keshav, S., 1997. An Engineering Approach to Computer
Networking., Addison-Wesley professional computing
series. 1997
Kun Pang Xiaokang Lin Junli Zheng Xuedao Gu Nat.,
2000. Dynamic WFQ scheduling for real-time traffic
in wireless ATM links, Communication Technology
Proceedings. 2000
H.263/MPEG4-compressed video traces: http://www-
tkn.ee.tu-berlin.de/research/trace/trace.html
Knightly, E. W., 1997. Second Moment Resource
Allocation in Multi-Service Networks, in Proceedings
of ACM SIGMETRICS '97. Seattle, WA. June 1997
Knightly, E. W., 1998. Enforceable Quality of Service
Guarantees for bursty traffic streams, in IEEE
Infocom ,pag. 635-642, March 1998
Spiegel, M., Schiller, J., Srinivasan, R., 2000. Probability
and Statistics, second edition, McGraw Hill. 2000
Cao, J., Cleveland, W. S., Lin, D., and Sun, D. X., 2001.
Internet Traffic Tends Toward Poisson and
Independent as the Load Increases, Bell Labs Tech
Report. 2001
Cao, J., Cleveland, W. S., Lin, D., and Sun, D. X., 2002.
The Effect of Statistical Multiplexing on the Long
Range Dependence of Internet Packet Traffic, Bell
Labs Tech Report. 2002
WEIGHT UPDATING METHODS FOR A DYNAMIC WEIGHTED FAIR QUEUING (WFQ) SCHEDULER
49
