
A CRM-BASED PRICING MODEL
FOR M-COMMERCE SERVICES
Gülfem Işıklar, Mehmet Üner, Ayşe Başar Bener
Department of Computer Engineering, Boğaziçi University, Bebek, Istanbul, Turkey
Keywords: Mobile commerce applications, pricing, CRM, utility function.
Abstract: Mobile network operators (MNOs) and service providers need flexible pricing mechanisms in order to
fulfill next generation business models. Heavy competition in the wireless market place increases the
importance of designing the most effective business models and developing long-term relationships with
customers. Customer Relationship Management (CRM) is an effective tool in order to pursue long-term
relationship with profitable customers. In this article, we focus on proposing a simple and robust pricing
model for mobile commerce services based on CRM approach. This mechanism enables operators to satisfy
the needs of their existing customers and to achieve the maximum revenue and utilization rate on their
current customer portfolio as well. Our aim in this research is to come up with a unit price for each mobile
service/product class by taking the issues of social welfare maximization into consideration. The CRM
implementation in the proposed model further allows MNO to better understand its customers and hence to
direct its marketing plans to a specific target market. Analytical and simulation results demonstrate the
implementation and the effectiveness of the suggested approach.
1 INTRODUCTION
The rapid growth of wireless networks has led to
vast changes in mobile devices, middleware
development, standards, network implementation,
and user acceptance (Deitel, 2001). Today’s most
popular wireless devices include cell phones,
personal digital assistansts (PDAs), and laptops.
Such devices allow individuals and organizations to
connect to the Internet and World Wide Web at any
time, from almost any place. Electronic commerce
(e-commerce) was just one of the possible services
performed via Internet. E-commerce still continues
to grow, but so far most e-commerce applications
require wired infrastructures. Mobile commerce (m-
commerce) is one of the opportunities created by
next generation wireless networks.
In the earlier years, e-commerce meant the
facilitation of commercial transactions electronically
such as sending purchase orders or invoices
electronically. Later, it is defined as the purchase of
goods and services over the World Wide Web via
secure servers using electronic shopping carts and
electronic payment services (Deitel, 2001).
Although m-commerce has a lot of common
grounds with e-commerce, it is a larger set in terms
of the functionality provided to the users. For
example, m-commerce provides location-based
services that are context-sensitive with respect to the
geographic location of the user. Another
functionality of m-commerce is the ability of bill
integration, which refers to the several purchases
combined into one bill. Customers only need to pay
one bill for all of their applications (Kuo, 2006). In
such an environment, the mobile network operator
(MNO) plays the role of intermediator between
customers and other services providers. Hence, an
MNO has to apply a robust pricing mechanism so as
to satisfy its customers and maximize its revenue.
In this research, we first differentiated customers
of an MNO using their Customer Relationship
Management (CRM) values. The purpose of this
segmentation is to be able to offer different levels of
quality of service (QoS) to different groups of
customers. CRM is a tool which enables
organizations to better understand the needs of their
customers, and as a result to assure maximum
utilization and revenue from their services by
customer-specific strategies. In the second step, we
differentiated mobile services/products according to
their bandwidth requirements and their tolerances to
delays. We aim to come up with a unit price for each
mobile service/product class.
118
I¸sıklar G., Üner M. and Ba¸sar Bener A. (2006).
A CRM-BASED PRICING MODEL FOR M-COMMERCE SERVICES.
In Proceedings of the International Conference on e-Business, pages 118-125
DOI: 10.5220/0001428101180125
Copyright
c
SciTePress

The rest of this paper is organized as follows:
The definition of mobile commerce and the mobile
value-chain are given in Section 2. Section 3
includes the basis of a CRM tool, as well as its
implementation in our approach. The unit prices of
mobile services/products and a numeric application
are represented in Section 4, following the proposed
framework. Finally, in Section 5 we provide
conclusions and we discuss the future work.
2 MOBILE COMMERCE
E-commerce continues its growth in wireless area by
m-commerce (Ngai, 2006). In (Clark, 2001), it is
defined as any transaction with monetary value that
is conducted via a mobile network. In another study,
any e-commerce transaction, processed by anyone,
anywhere, through wireless devices, is considered
mobile commerce (Keen, 2001).
One of the advantages of m-commerce is that it
gives companies the opportunity for reaching a
broad range of consumers. M-commerce has some
specific dimensions which are not available for
traditional e-commerce. For example it gives
nomadic access to its users and it is location-centric.
The services in m-commerce can be personalized
and m-commerce allows service providers to treat
each customer separately (Mahatanankoon, 2005).
We utilized a well-known customer management
tool to make MNOs recognize their groups of
customers.
In the related literature, m-commerce is analyzed
under five main topics: M-commerce theory and
research, wireless network infrastructure, mobile
middleware, wireless user infrastructure and mobile
commerce applications (Ngai, 2006). The lowest
level of m-commerce is the theory and research. It
consists of consumer behavior, the acceptance of
technology, the diffusion of m-commerce
applications, m-commerce business models and
strategies. Pricing models for m-commerce services,
which is the main topic of our research, is a part of
this level.
The new technologies, that solved the bandwidth
limitation problem, allow higher transmission rates
and more sophisticated mobile services. The m-
commerce applications are classified into six main
categories: Mobile financial applications, mobile
advertising, mobile inventory management, mobile
auctions, mobile entertainment services and
proactive service management (Varshney, 2000).
However, the number of such applications
constantly increases, since existing e-commerce
applications can be offered on mobile networks.
Such a categorization may direct the MNO to define
its product/service classes which constitutes one of
the phases of our suggested mechanism. It is not
always possible to use flat pricing schemes in terms
of kilobytes or megabytes, as the MNOs have to
manage their network traffic by analyzing the
priority and the resource requirements of given
services. For instance, a mobile financial application
should be more privileged than a mobile advertising.
The business models and value chains
established for the Internet do not exactly match to
the ones for mobile networks. Therefore an m-
commerce value chain needs to be formed. A value
chain could be defined as the linkage and integration
of a series of activities in which enterprises deliver
the created and valued products or services to
customers (Porter, 1985). Like any other
service/product, m-commerce involves a large
number of value providers in a chain that terminates
with the end-user. Among the value chain actors,
despite that each has its significance; mobile
network operator plays the most critical role on the
entire chain (Kuo, 2006; Rülke, 2003). In this
article, we investigate the role of mobile network
operator in the value chain, especially when
charging various mobile services that are offered to
different types of customers.
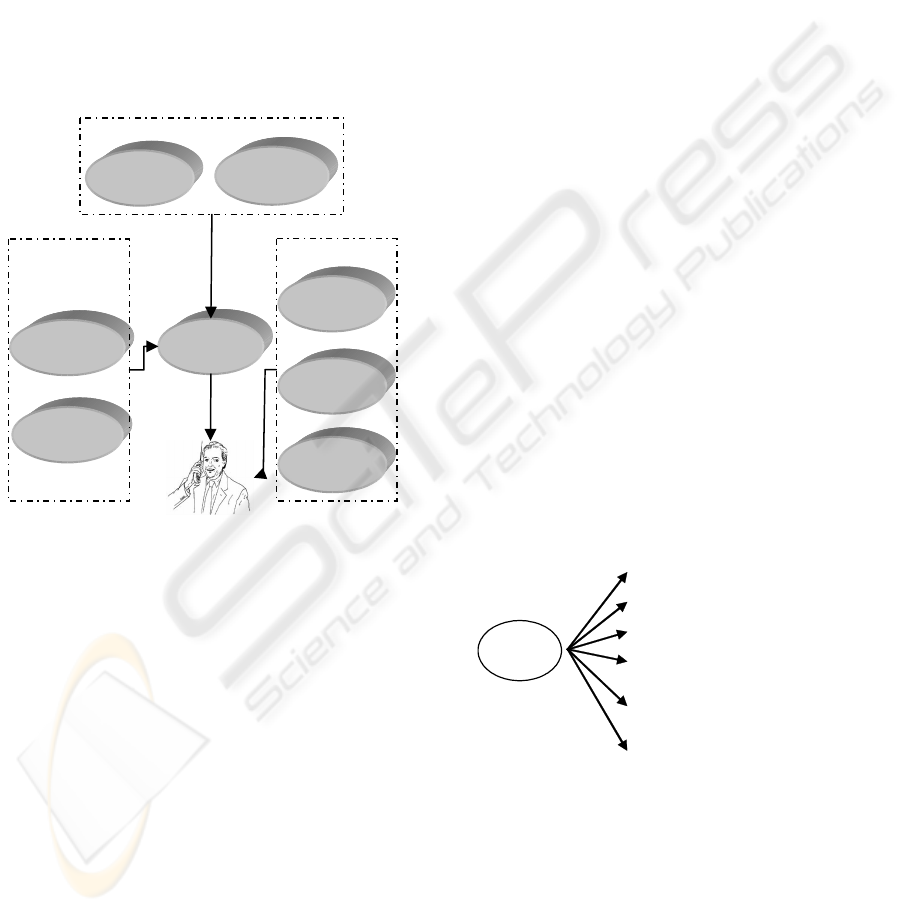
In Figure 1, a basic mobile value chain is shown. It
mainly consists of three categories: Hardware,
services and infrastructure. The hardware part of the
mobile value chain includes the mobile equipment
supplier, wholesaler retailer. They are responsible
for producing and selling the mobile terminal to the
end-user. The other part is the services part, which
contains the content provider and the mobile value-
added service provider. They are responsible for
offering the services/products to the customers.
Finally, the infrastructure part consists of software
and infrastructure supplier. They provide the
required software and infrastructure to the mobile
network operator and to the service providers. In this
mobile value chain, only the MNO has direct contact
with the customer (Kuo, 2006; Questus, 2000;
Barnes, 2001). Although it is possible to introduce
each one of these relationships seperately into the
pricing mechanism, we built a pricing model
between MNO and their end-users.
3 CUSTOMER RELATIONSHIP
MANAGEMENT
As competition increases, many firms use the
Customer Relationship Management (CRM) systems
to improve business intelligence, to make better
decisions, to enhance customer relations, and to
A CRM-BASED PRICING MODEL
119
increase quality of services and product offerings.
CRM could be defined as the strategies, processes,
people and technologies used by companies to
successfully attract and retain customers for
maximum corporate growth and profit (Roh, 2005).
It is a strategic process used to learn more about
customer’s needs and behaviors, in order to provide
them with highest quality products and services.
This results in customer retention and discovering
and attracting new customers.
CRM is also an effective tool for customer
segmentation to develop one-to-one relationships
with customers. In order to truly understand
customers, it is essential to have a segmentation
management that divides customers into smaller
Figure 1: The mobile commerce value chain.
subgroups. Customer segmentation can be defined as
the classification of customers according to their
likely behavior and potential profitability. This intra-
group similarity allows customers in the same
subgroup to respond somewhat similarly to a given
marketing strategy. Especially in telecommunication
industry, the MNOs have to understand the needs of
customers in specific geographical regions and
demographic segments in order to be able to more
successfully offer mobile services to the right people
in an appropriate way. In our proposed model, we
assumed that each subscriber has a CRM value
defined by the MNO. In general, MNOs prefer
outsourcing the CRM service to other service
companies. According to SAS, one of the well-
known solution companies, telecommunication
providers’ best hope for improving profitability is to
focus on improving effectiveness in attracting and
retaining customers, maximizing the value from
each customer relationship, developing more
efficient and dynamic business processes, evaluating
success based on the right performance measures
and aligning the entire organization around unified
strategic directions (www.sas.com).
One of the ways of segmenting customers is
using the Life Time Value (LTV) model (Kim,
2005). In previous studies, LTV is defined as the
sum of the revenues gained from company’s
customers over the lifetime of transactions after the
deduction of the total cost of attracting, selling and
servicing customers, taking into account the time
value of money (Dwyer, 1999; Hoekstra, 1999; Jain,
2002). These CRM values are calculated for each
customer and they direct MNOs to classify their
customers. In (Kim, 2005), customer segmentation
methods using CRM values are categorized into
three groups: 1) Segmentation by using only CRM
values, 2) Segmentation by using CRM components,
and 3) Segmentation by considering both CRM
values and other information. In the first method,
customers are sorted in a descending order according
to their CRM values. The list is divided by its
percentile to enable companies to offer different
services and products for each percentile. The
second method segments customers by using CRM
components; such as the current value and the
potential value of the customer, and his loyalty
(Hwang, 2004). The current value is calculated by
the average revenue earned from a customer’s recent
transactions after deducting its debts to the
company. In other words, it is a measure of
customer’s past profitability. The potential value of
costumer is the expected profits from that customer
in the future.
Sex
Educational Back
g
round
Age
Subscri
p
tion Duration
Attribute to Pa
y
in
g
Bills
Application’s -: Type
- Time-of-day
- Duration
CRM
value
Figure 2: The components of the CRM value.
The customer loyalty is the rate that specifies the
value that customer will still be the customer of that
company. In the third method, customers are
categorized according to both their CRM values and
other managerial information; such as demographic
information and transaction history.
In our research, we proposed segmenting the
customers of the MNO in terms of the following
categories: customer’s sex, educational background,
Mobile
E
q
ui
p
ment
Wholesaler
Mobile
E
q
ui
p
ment
H
ardware
Mobile Value-
Added Service
Content Provider
Software Supplier
Infrastructure
Su
pp
lie
r
I
nfrastructure
Mobile Network
Operator
Services
ICE-B 2006 - INTERNATIONAL CONFERENCE ON E-BUSINESS
120

age, subscription duration, frequently used
applications, average duration of his applications,
time-of-day of his applications and his attribute of
paying the bills (Figure 2). As each company has its
own marketing strategy, the number and the variety
of selected variables could be different. We
proposed that each customer should have a CRM
value in the range of [0-100] which is being
calculated dynamically in respect to the strength of
these variables.
4 PROPOSED FRAMEWORK
4.1 The Representation of the
Framework Variables
Our proposed model is based on the idea of offering
various quality of service levels to different
customers for different types of mobile services. In
this research, we performed a customer
segmentation both to maximize their satisfaction and
to maximize the revenue of the MNO from each
customer. Although there is not a limit on the
number, in this case study we divided customers into
4 different segments depending on their CRM values
(Figure 3) (IBM, 2003). This segmentation was the
one that IBM has used for its telecommunication
customers. We defined the ranges of segments just
to give an example.
Figure 3: Customer segmentation according to their CRM
values (IBM, 2003)
This classification allows the ability to develop
value driven strategies. The customers with the
highest CRM values, called “Champions”, are
classified as Segment 1. For the company, these
customers provide with high revenue and low cost.
Segment 2 is constituted of customers with CRM
value which is relatively lower than the
“Champions”, called “Demanders”. They provide
with high revenue and high cost. The customers with
the medium CRM value are called “Acquaintances”
and they provide with low revenue and low cost.
Finally, the “Parasites”, the customers with lowest
CRM value, cause low revenue and high cost for the
company (IBM, 2003). Each company may have
different CRM strategies; nevertheless for this case
study, we supposed that our company aims primarily
to satisfy its “Champions” and then, try to promote
its “Demanders” and “Acquaintances” to higher-
valued segment. Our company does not concentrate
on “Parasites”, it just offers them the best possible
quality of service level.
The service concept includes the characteristics
such as throughput, jitter, delay or loss when
transmitting a packet in one direction across a set of
one or more paths within a network. Differentiation
of services accommodates heterogeneous application
requirements and customer expectations, and it
permits differentiated pricing (Blake, 1998). In next
generation wireless networks, different mobile
services will require different amounts of bandwidth
as well as different QoS requirements. In networks
that handle diverse types of data stream, ranging
from file transfer, to real-time traffic such as
streaming audio and video, heterogeneous delay
sensitivities can occur. Therefore, in our proposed
model we mainly categorized the mobile services
based on their tolerance levels to latency or packet
losses due to the next generation of IP, IPv6
(Deering, 1998). Although there is no limit for the
number of classes, as seen in Figure 4, we defined
three different classes of mobile services/products to
represent the various needs of customers. The
services/products class 1 (Gold) with the highest
priority includes the premium products, which
require mostly a large amount of bandwidth and
these services are very sensitive to delays. At the
packet level, applications of this class are forwarded
with the highest priority that the system can offer to
the customers. An instance of application in this
category may be the financial services. Even though
they do not require large amount of bandwidth, they
are very sensitive to delay and loss. The product
class 2 (Silver) and the product class 3 (Bronze)
have respectively lower priority than the product
class 1 (Gold) and they are suitable for applications
requiring less bandwidth. As seen in the Figure 4,
the “Parasites”, the customers in Segment 4, are not
included since they will receive the remaining best
possible service level (Best Effort) after offering to
the customers of the 3 upper segments.
In such an environment, both the customers of
each segment and the MNO should be in social
welfare. Social welfare can be taken to mean the
welfare or well-being of a society. The satisfaction
of a customer depends on his network access, the
services being received and its quality of service
level, while the satisfaction of the MNO depends on
Segment 2: Customers with CRM value 70-85
“Demanders”
Segment 3: Customers with CRM value 50-70
“Acquintances”
S
e
g
ment 4: Customers with CRM value 0-50
“Parasites”
Segment 1: Customers with CRM value 85-100
“Cham
p
ions”
A CRM-BASED PRICING MODEL
121
the utilization rate of its services. Therefore, we
have to set the most appropriate pricing mechanism
so as to encourage maximum number of customers
to use mobile applications and obtain maximum
revenue from these services. The network’s
resources are used most efficiently if they maximize
the total customer satisfaction. In economic theory,
marginal cost pricing is the concept that a customer
of a system of scarce resources should be charged a
price equal to the marginal cost imposed by the
customer on the system, both on itself (the internal
effect) and on others (the external effect) (Stidham,
2002). In other words, the marginal cost is the
change in total cost associated with producing one
more unit of output. The point where the optimal
efficiency is achieved, usage based charges must be
equal to the marginal cost of usage. Here, the
marginal cost is almost solely a congestion cost;
congestion costs are the performance penalties that
one customer’s traffic imposes on the other
customers.
The social welfare is only maximized when
prices are set equal to marginal cost considering all
externalities (Shenker, 1996). The parameters and
the variables of the model are defined as:
u (x
ij
) : Utility function value that the i
th
customer
has from j
th
product/service class.
x
ij
: Total number of packets of j
th
product/service
class belonging to the i
th
customer.
γ
ij
:Delay and retransmission cost experienced by i
th
customer for one unit of data in the j
th
product/service class.
d (∑x
ij
) : Average of delays that one unit of i
th
customer’s data experiences in j
th
product/service
class.
The utility function value in the model represents
the net benefits of individual customers from mobile
services/ products. According to standard economic
theory, the price should be set equal to the external
effect of a marginal increase in flow at the resource.
When this is done, the algorithm always converges
to a local maximum and never to a saddle point
(Stidham, 2002). In this study in order to determine
the prices, external effects are taken into account.
Therefore, the results that are obtained will be local
maximum points but not saddle points.
d (∑x
ij
) expresses the relationship between the
total traffic flow (the sum of i
th
customer’s packets)
in j
th
product/service class with the experienced
delay in this class. We assumed that the numbers of
customers in four different segments are n
1
, n
2
, n
3
and n
4
, respectively.
4.2 The Utility-based Objective
Function
A socially optimal allocation of products/services
(x
ij
*
) to the customers is defined as one that
maximizes the aggregate net utility of all customers
of all segments. It may be found by solving the
optimization problem represented as
follows;
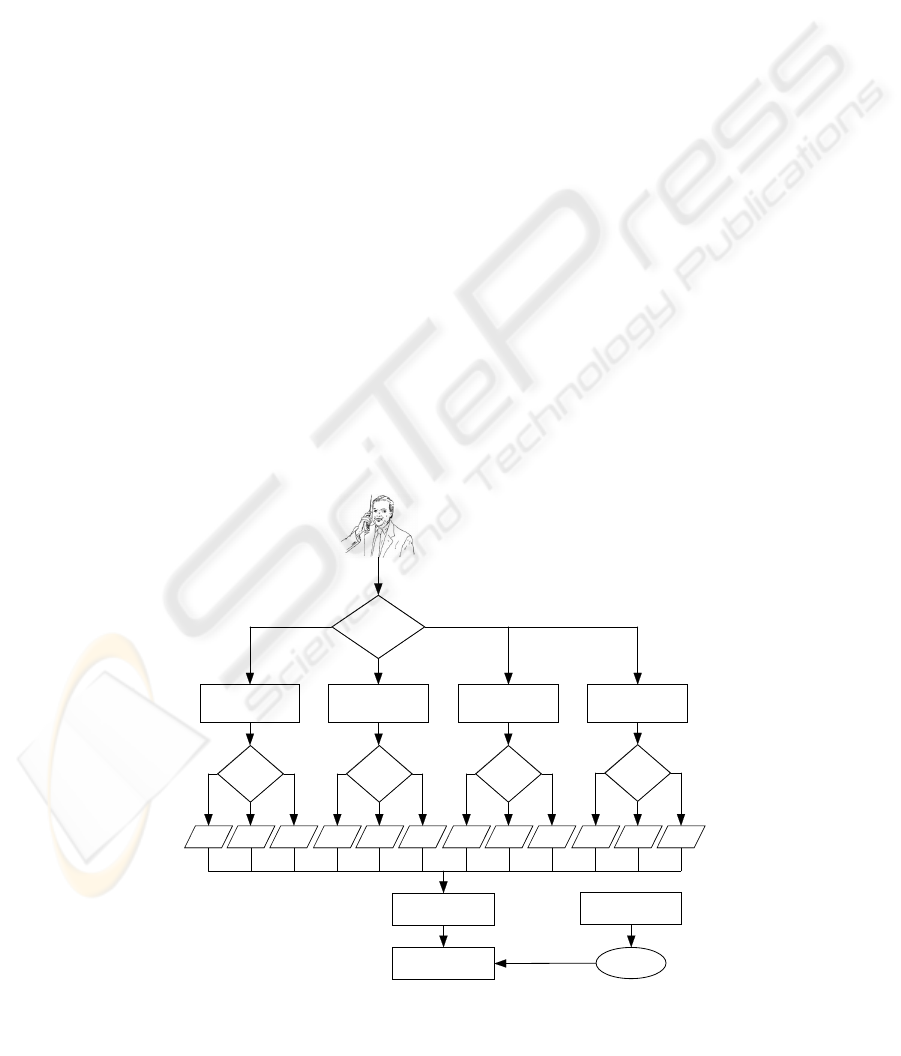
Figure 4: Pricing and billing scheme belonging to a customer.
Customer
value
Service/ product
type
Champions
85-100
Service/ product
type
70-85
Demanders
Service/ product
type
Acquaint ances
50-70
Service/ product
type
Product
Class
1i
x
∑
2i
x
∑
3i
x
∑
Product
Class
1i
x
∑
2i
x
∑
3i
x
∑
Product
Class
1i
x
∑
2i
x
∑
3i
x
∑
P roduct
Class
1i
x
∑
2i
x
∑
3i
x
∑
Parasites
0-50
Accounting
Billing
Pricing
Tariff
ICE-B 2006 - INTERNATIONAL CONFERENCE ON E-BUSINESS
122

()
[
()
[
()
[
12
31
1
1
11 1
11
11
1
123 123
123 1 11
1
1
2122 3123
11 1 1
,, ,,
,, . .
.,. .,,
max ( ) :
n
nn n
nn
ii
nn
ii
n
i
ii i ii i
ii i i i i
i
n
iiii iiii
ii ii i
ux x x ux x x
ux x x d x x
dx xx dx x
Ux
x
γ
γγ
==
==
=
=
== == =
⎤⎤
⎦⎦
⎤
⎛⎞
⎥
⎜⎟
⎤
+− −
⎦
⎥
⎜⎟
⎜⎟
⎥
⎝⎠
⎦
⎤
⎛⎞
⎥
⎜⎟
−
⎥
⎜⎟
⎜⎟
⎥
⎝⎠
⎦
=+
∑∑
⎡
∑∑
∑
⎢
⎢
⎣
⎡
∑
∑∑ ∑ ∑
⎢
⎢
⎣
1
22
2
1
222
22
1
11
1
3
1
111 2122
111
2
31233 1
11 1
.
.. .,.
.,,. .
n
nnn
nn
n
i
nn
ii
n
i
i
iii i iii
iii
n
iiiii i
ii i
x
dxx dx xx
dx x xx
γγ
γγ
=
==
=
===
== =
⎤
⎛⎞
⎥
⎜⎟
⎥
⎜⎟
⎜⎟
⎥
⎝⎠
⎦
⎤⎤
⎛⎞ ⎛ ⎞
⎥⎥
⎜⎟ ⎜ ⎟
−− −
⎥⎥
⎜⎟ ⎜ ⎟
⎜⎟ ⎜ ⎟
⎥⎥
⎝⎠ ⎝ ⎠
⎦⎦
⎤
⎛⎞
⎥
⎜⎟
−
⎥
⎜⎟
⎜⎟
⎥
⎝⎠
⎦
⎡
∑
∑
⎢
⎢
⎣
⎡⎡
∑∑
∑∑∑
⎢⎢
⎢⎢
⎣⎣
⎡
∑
∑∑∑
⎢
⎢
⎣
3
3
1
11
1
.
n
n
i
ii
i
dxx
=
=
⎤
⎛⎞
⎥
⎜⎟
⎥
⎜⎟
⎜⎟
⎥
⎝⎠
⎦
⎡
∑
∑
⎢
⎢
⎣
33
33 33 3
11
2122 31233
11 11 1
.,. .,,.
nn nn
nn
ii
n
iiii iiiii
ii ii i
dx xx dx x xx
γγ
==
== == =
⎤⎤
⎛⎞ ⎛ ⎞
⎥⎥
⎜⎟ ⎜ ⎟
−−
⎥⎥
⎜⎟ ⎜ ⎟
⎜⎟ ⎜ ⎟
⎥⎥
⎝⎠ ⎝ ⎠
⎦⎦
⎡⎡
∑∑
∑∑ ∑∑∑
⎢⎢
⎢⎢
⎣⎣
In the above given objective function, the first
three terms represent the sum of each customer’s
utility value that they obtain by using the mobile
services/products. As we focus on the first three
segments not on n
4
(“Parasites”) in the above
function, we have three expressions of the received
utility by n
1
customers of the Segment 1, by n
2
customers of the Segment 2 and by n
3
customers of
the Segment 3, respectively. The remaining part of
the objective function consists of the experienced
delay costs and retransmission costs. For instance,
the fourth term expresses the total cost experienced
by the “Champions” from the gold class of
product/service; while the fifth term expresses the
total cost experienced by the “Champions” from the
silver class of product/service.
Our main assumption is that the lower
product/service classes suffer from delays
originating not only from their own classes but also
from delays of higher classes. Therefore, these
influences of the higher classes are indicated in the d
(∑x
ij
) expressions. For instance in the sixth term of
the objective function, we can see that the bronze
products/services of the “Champions” suffer from
the silver and gold products/services and also from
its own class of products/services. Naturally when
calculated mobile services prices, these extra costs
should be added to the prices of the higher classes.
Hence, the price should be computed to measure the
congestion cost that the i
th
customer’s packets
impose on the other customers.
In the objective function, it is assumed that the
utility functions u (x
ij
) are all increasing, concave
and differentiable; likewise, the delay functions d
(∑x
ij
) are all increasing, convex and differentiable,
which are common assumptions in the literature
(Kelly, 2000). The optimal points (x
ij
*
) where all the
customers are satisfied with the QoS of the
services/products offered, can be calculated by
equalizing the partial derivative of the objective
function for each of the x
ij
(j = 1, 2, 3, i = n
1
, n
2
, n
3
)
to 0.
The prices reflect the marginal costs of that the i
th
customer’s packets impose on the other customers
for each product/services. Here, P
ij
represents the
price of the j
th
service/product class of the i
th
customer segment. Therefore, for the first three
customer segments (for j = 1,2,3), the prices of each
service/product class can be calculated by the
following calculations:
()
*
222
1
12 123
11
111
23
11
,,,
..
i
n
jii
i
nn
nnn
ii
iii
ii ii i
ii
iii
nn
ii
ii
ii
dxx dxxx
Px
xx
γ
=
==
===
==
⎛⎞ ⎛⎞
⎜⎟ ⎜⎟
⎜⎟ ⎜⎟
⎜⎟ ⎜⎟
⎝⎠ ⎝⎠
∂∂
∂∂
⎛⎞ ⎛ ⎞
∑∑
⎜⎟ ⎜ ⎟
∑∑∑
⎜⎟ ⎜ ⎟
⎝⎠ ⎝ ⎠
=+
∑∑
∑
() ()
**
33 44
11
1234
1
111
4
1
,,,
...
i i
nn
ii ii
ii
n
nnn
i
iii
ii i i
i
iii
n
i
i
i
dxxxx
xx
x
γ
γ
==
=
===
=
⎛⎞
⎜⎟
⎜⎟
⎜⎟
⎝⎠
∂
∂
⎛⎞
∑
⎜⎟
∑∑∑
⎜⎟
⎝⎠
+
∑
∑∑
()
()
*
333
1
*
44
1
12 3
1
11
3
1
123 4
1
111
4
1
,,
,,,
..
..
i
i
n
jii
i
n
ii
i
n
nn
i
ii
ii i
i
ii
n
i
i
i
n
nnn
i
iii
ii i i
i
iii
n
i
i
i
dxxx
Px
x
dxxxx
x
x
γ
γ
=
=
=
==
=
=
===
=
⎛⎞
⎜⎟
⎜⎟
⎜⎟
⎝⎠
⎛⎞
⎜⎟
⎜⎟
⎜⎟
⎝⎠
∂
∂
∂
∂
+
⎛⎞
∑
⎜⎟
∑∑
⎜⎟
⎝⎠
=
∑
⎛⎞
∑
⎜⎟
∑∑∑
⎜⎟
⎝⎠
∑
∑
∑
()
*
444
1
1234
1
111
4
1
,,,
..
i
n
jii
i
n
nnn
i
iii
ii i i
i
iii
n
i
i
i
dxxxx
Px
x
γ
=
=
===
=
⎛⎞
⎜⎟
⎜⎟
⎜⎟
⎝⎠
∂
∂
⎛⎞
∑
⎜⎟
∑∑∑
⎜⎟
⎝⎠
=
∑
∑
The tricky aspect of our proposed model is that; it
does not consider the customer segment 4, the
“Parasites”, in the objective function. The reason is
the aim of exclusion of these customers from the
socially optimal allocation of products/services (x
ij
*
).
In other words, x
i4
*
receives the remaining value,
namely best effort, after the x
ij
*
allocations for the
first three:
****
4123
1
j
jj j
x
xxx
=
−−−
Hence, we used the x
i4
*
value when calculating P
ij
values.
4.3 Numerical Example
In order to make the proposed model clearer, in this
section we give an example about the
implementation of the model. We chose a network
A CRM-BASED PRICING MODEL
123
with one user who utilizes four types of services in
order to illustrate the model effect. The objective
function for this case takes the form:
with
1
()
i
i
dX
vX
=
−
The delay expression in the objective function is
consistent with the delay expression of a resource
operating as a processor-sharing single-server queue
with service capacity v. Without loss of generality,
we can assume that v=1 for the first stage of
allocation problem (Stidham, 2002). It seems that it
gives an infinite negative penalty to a 100%
bandwidth allocation; however it is not exactly true.
The delay function is set so as to allocate some
amount of resource to each class of mobile
service/product. This function enables leaving some
idle portion of resource. In this manner, the total
available resource is considered as 1 and the
calculated x
ij
*
values will signify the percentages of
the total resource allocated to each class of mobile
service/product. Then, the problem of finding the
socially optimal allocation of flows then takes the
form:
33
11 2 2
12 3
112123
max
11 1
.
..
() () ()
xx
ux ux ux
x
xx xxx
x
γγ
γ
++
−−−−−−
−− −
s.t.
123
123
1
0, 0, 0
xxx
xxx
++<
≥≥≥
Although there are different approaches for the
determination of utility functions, we considered
generating our simulations by use of square root
utility function in the following form: u(x
i
)=
a
i
.x
i
+b
i
√x
i
where a
i
≥0, b
i
≥0, and iЄ{1,2,3}. The a
i
and the b
i
values symbolize the utility coefficients of
the mobile service/product classes. Therefore, the
utility coefficient value of the gold services/products
is set greater than the one of silver services/products;
because the services/products having more privilege
are assumed to have more utility than the
services/products having less privilege. Besides, the
γ
i
values in the equation describe the delay and
retransmission cost coefficients. As a unit delay in
the gold services/products should cost more than the
one in the silver services/products, the γ
1
is set
greater than the γ
2
value, and γ
2
greater than the γ
3
.
Here is the net utility expression:
1
12 3 1 1 2
1
2
23
12
9.
( , , ) 52. 8 20.
1
32
1
x
uxx x x x x
x
x
xx
xx
=+− +
−
+− +
−−
The solutions are as follows: x
1
*
=0.5, x
2
*
=0.3 and
x
3
*
=0.1. The maximum objective function with these
values is 29.0. These results can be interpreted as
follows; when the 50% of the resources are allocated
to n
1
Champions, 30% of the resources to n
2
Demanders, and 10% of the resources to n
3
Acquintances, both customers and MNO obtain
maximum net utility value which is 29.0. From the
definition, we calculated that 10% of the resources
are idle and they can be allocated for the n
4
Parasites.
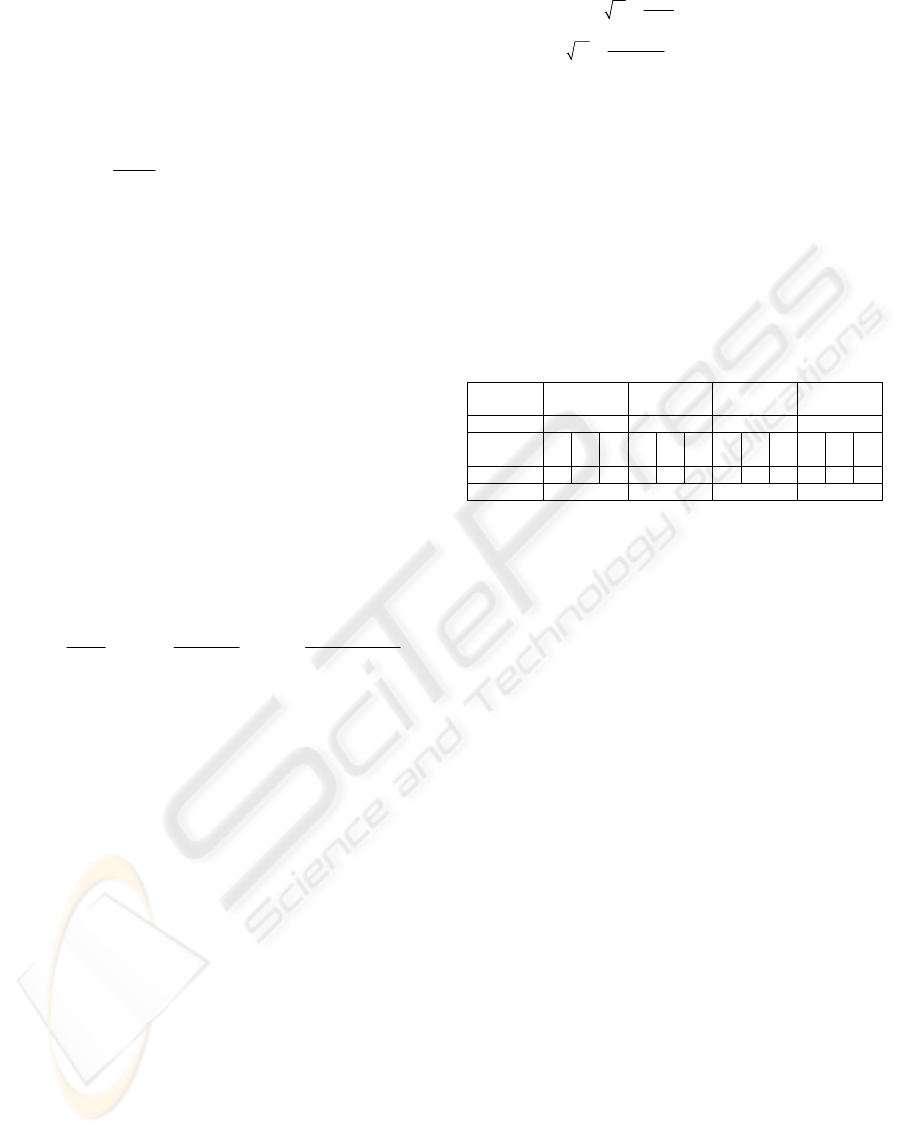
Table 1: The simulation results.
Customer
segments
Champions Demanders Acquintances Parasites
Resource
0.5 0.3 0.1 0.1
Service
classes
G S B G S B G S B G S B
Resource
0.44 0.05 0.008 0,28 0,9 0,09 0,097 0.001 0.001 0,097 0.001 0.001
Net utility
22.7040 15.7301 11.5482 11.5482
Now, these allocated resources have to be
distributed among three different classes of
services/products. At this point, we can utilize the
same objective function, or define another one; but
now we should set the total capacity to 0.5 for the
Champions, to 0.3 for the Demanders and 0.1 for the
Acquintances and the Parasites. The obtained results
are summarized in Table 1. All these x
ij
*
values
calculated by simulations are the input values of the
price equations.
5 CONCLUSION
In recent years, a number of social, technological
and economic trends have promoted the demand of
mobile communication services. Mobile commerce
is one of the subset of these services. M-commerce
brought many new opportunities and also challenges
to carry out one-to-one customer relationship in e-
business. New actors and new value-added services
enlarged the Internet value-chain and new mobile
value chain is produced. The composition of the
mobile commerce value chain and the relationships
between the actors is extremely complicated; so in
this paper we concentrated on the direct relationship
between the Mobile Network Operator that plays the
role of an intermediator between value chain
members and end-users. For m-commerce to reach
its full potential, MNOs must offer pricing strategies
123 1 2 3 1 1 1
22 12 33 12 3
)()()()()..()
(). ( )(). ( )
(,,
..
iii i i i i i i
ii ii ii ii i
ux x x ux ux ux x dx
xdxx xdxx x
γ
γγ
=++−
−+−+
+
ICE-B 2006 - INTERNATIONAL CONFERENCE ON E-BUSINESS
124

of the m-commerce services of maximum
effectiveness to customers.
In this paper, we proposed a CRM-based
framework in order to price different types of mobile
services/products for customers with different
profiles. In the model, customers are first segmented
according to their CRM values and are offered
various service levels. Furthermore for each
customer segment, the services/products are also
differentiated according to their resource
requirements and delay tolerances. The aim is to
suggest a unit price for each service/product class in
each customer segment, which provides the revenue
maximization for MNOs and the network resource
usage optimization. We believed that in a
competitive business environment, tracking the
CRM values of customers and offering the service
according to them is the most beneficial way to
increase services quality and accordingly the
revenues.
There is much work to be done in this area. First
of all, it could be possible to build an architecture to
dynamically track and analyze the CRM variables
belonging to each customer. Since it requires a large
data warehouse, some data mining mechanisms can
be proposed in order to capture customer profiles
and attributes. Besides, these mechanisms could be
useful in measuring customer segments’ utility
functions.
REFERENCES
Deitel, H.M., Deitel, P.J., Nieto, T.R., and Steinbuhler, K.,
2001. Wireless Internet and Mobile Business How to
Program, Prentice Hall, 1
st
edition.
Kuo, Y.F., and Yu, C.W. 3G telecommunication
operators’ challenges and roles: A perspective of
mobile commerce value chain. Technovation, article in
press.
Ngai, E.W.T., and Gunasekaran, A. A review for mobile
commerce research and applications, Decision Support
Systems, article in press.
Clark, I. III, 2001. Emerging value propositions for m-
commerce. Journal of Business Strategies, Vol.18 (2),
pp. 133-148.
Keen, P.G.W., and Mackintosh, R., 2001. The freedom
economy: Gaining the m-commerce edge era of the
wireless Internet, Osborne/McGrew-Hill, Berkeley.
Mahatanankoon, P., Wen, H.J., and Lim, B., 2005.
Consumer-based m-commerce: exploring consumer
perception of mobile applications. Computer
Standards & Interfaces, Vol. 27, pp. 347-357.
Varshney, U., Vetter, R.J., and Kalakota, R., 2000. Mobile
Commerce: A New Frontier, Computer, pp.32-38.
Porter, M.E., 1985. Competitive Advantages, The Free
Press, New York.
Rülke, A., Iyer, A., and Chiasson, G., 2003. The ecology
of mobile commerce: charting a course for success
using value chain analysis, 2003. In: Mennecke, B.E.
Strader, T.J., Mobil Commerce: Technology, Theory
and Applications, Idea Group Publishing, pp. 114-130.
Questus report, 2000. The ramp towards the pricing of
broadband mobile services: UMTS & EGDE.
Barnes, S.J., 2002. The mobile commerce value chain:
analysis and future developments. International
Journal of Information Management, Vol. 22, pp. 91–
108.
Roh, T.H., Ahn, C.K., and Han, I., 2005. The priority
factor model for customer relationship management
system success. Expert Systems and Applications, Vol.
28, pp. 641-654.
Kim, S.Y., Jung, T.S., Suh, E.H., and Hwang, H.S., 2005.
Customer segmentation and strategy development
based on customer lifetime value: A case study. Expert
Systems with Applications, pp.1-7.
Dwyer, F.R., 1999. Customer lifetime valuation to support
marketing decision making. Journal of Interactive
Marketing, Vol. 11(4), pp. 6-13.
Hoekstra, J.C., and Huizingh, E.K.R.E., 1999. The lifetime
value concept in customer-based marketing. Journal of
Market Focused Management, Vol. 3(3-4), pp. 257-
274.
Jain, D., and Singh, S.S., 2002. Customer lifetime value
research in marketing: A review and future directions.
Journal of Interactive Marketing, Vol. 16(2), pp. 34-
45.
Hwang, H., Jung, T., and Suh, E., 2004. An LTV model
and customer segmentation based on customer value:
A case study on the wireless telecommunication
industry. Expert Systems with Applications, 26(2), pp.
181-188.
IBM Customer Analytics, Customer Lifetime Value, 2003.
available at:
http://www.cebt.re.kr/wh/%EC%B0%A8%EC%84%B
8%EB%8C%80CRM/CLTV.pdf
Blake, S., Black, D., Carlson, M., Davies, E., Wang, Z.,
and Weiss, W., 1998. An Architecture for
Differentiated Services, RFC 2475.
Deering, S. and Hinden, R., 1998. Internet Protocol,
Version 6 (IPv6) Specification, RFC 2460, Internet
Engineering Task Force.
Stidham, S.Jr., 2002. Pricing and congestion management
in a network with heterogeneous users, submitted to
IEEE Trans. Auto. Control.
Shenker, S., Clark, D., Estrin, D., and Herzog, S., 1996.
Pricing in computer networks: reshaping the research
agenda. ACM Computer Communication Review, Vol
26, pp. 19-43.
Kelly, F., 2000. Congestion control: fairness, pricing and
stability. 15
th
IEEE Computer Communications
Workshop, Captiva Island, Florida.
A CRM-BASED PRICING MODEL
125
