
MODELING THE DYNAMICS OF SOCIAL NETWORKS
Victor V. Kryssanov, Frank J. Rinaldo
Faculty of Information Science and Engineering, Ritsumeikan University, Kusatsu, Shiga, Japan
Evgeny L. Kuleshov
Department of Computer Systems, the Far-Eastern National University, Vladivostok, Russia
Hitoshi Ogawa
Department of Information and Communication Science, Ritsumeikan University, Kusatsu, Shiga, Japan
Keywords: Social networks, Power law, Human response time, Consumer behavior.
Abstract: Modeling human dynamics responsible for the formation and evolution of the so-called social networks –
structures comprised of individuals or organizations and indicating connectivities existing in a community –
is a topic recently attracting a significant research interest. It has been claimed that these dynamics are
scale-free in many practically important cases, such as impersonal and personal communication, auctioning
in a market, accessing sites on the WWW, etc., and that human response times thus conform to the power
law. While a certain amount of progress has recently been achieved in predicting the general response rate
of a human population, existing formal theories of human behavior can hardly be found satisfactory to
accommodate and comprehensively explain the scaling observed in social networks. In the presented study,
a novel system-theoretic modeling approach is proposed and successfully applied to determine important
characteristics of a communication network and to analyze consumer behavior on the WWW.
1 INTRODUCTION
Understanding the mechanisms underlying the
formation and evolution of social (communication,
entertainment, financial, and the like) networks is
crucial in many fields of human activity, ranging
from software development, to market analysis,
resource distribution and deployment, and to
catastrophe prognosis and prevention (see Newman,
2005, for a comprehensive survey). Recently, there
is an increasing number of reports that the dynamics
of social networks reveal statistical properties
conforming to the power law (Johansen, 2004;
Barabasi, 2005; Oliveira and Barabasi, 2005;
Adamic and Huberman, 2000; Scalas et al., 2006).
Striving to find a universal model for the human
behavior apparently responsible for the observed
statistics, researchers have been quick to affiliate
social networks with the familiar Zipfian phenomena
(Newman, 2005; Barabasi and Albert, 1999).
There exist a rich variety of stochastic processes
leading to a power, heavy-tailed (e.g. Zipf, Zipf-
Mandelbrot, or Pareto) form of the probability
distribution of an observed random variable
(Mitzenmacher, 2003). Only a small fraction of
these processes, however, would be considered
relevant to discuss in a social, economic, or
anthropological context peculiar to the development
of social networks. Even fewer processes have
actually been explored as possible generating
mechanisms for the network dynamics and tested
against real-world data.
Adamic and Huberman (2000) gave an
explanation for the power-law distribution of the
consumer activities in a global e-market, such as the
World-Wide Web (WWW). The proposed model
exercises the well-studied multiplicative growth
stochastic mechanism for the network expansion but
carries no implication about the human behavior.
Barabasi (2005) suggested a version of the
preferential selection mechanism to describe the
242
V. Kryssanov V., J. Rinaldo F., L. Kuleshov E. and Ogawa H. (2006).
MODELING THE DYNAMICS OF SOCIAL NETWORKS.
In Proceedings of the International Conference on e-Business, pages 242-249
DOI: 10.5220/0001425402420249
Copyright
c
SciTePress
dynamics observed in a university e-mail network.
While he did propose a model for human
communicative behavior, which is, effectively,
choice based on priorities, this model requires
making rather implausible assumptions (e.g. about
uniformly distributed priorities) and yet
demonstrates poor predictive results even for the
data originally used in the study (see Figure 1; also
Stouffer et al., 2005). Johansen (2004) derived an
empirical formula, which provides a good
approximation for the general response rate of a
human population, working with the same data as
the previous author (Figure 1). Another example of
the empirically grounded approaches to modeling
the dynamics of social networks is a modification of
the Zipf-Mandelbrot law – the formula suggested by
Krashakov et al. (2006) to characterize the
popularity of Web-sites that apparently has a
predictive power better than the classic (e.g. the
“pure” power or Zipf law) models. The latter two
studies, however natural, offer little insight on why
the observed networks exhibit scale-free properties.
In the absence of a sufficiently universal
alternative to the power law (see Solow et al., 2003,
for a relevant discussion), the above mini-survey is
quite indicative of the current situation with the
understanding and modeling of the dynamics of
social networks. Whenever the true mechanism
underlying the observations is not known, the most
probable scenario is that any process generating
heavy-tailed data is either “by default” (i.e. with a
minimal, if any, attention to statistical hypothesis
testing and model validation) attributed to (a version
of) one of the well-studied power-law generating
mechanisms, such as multiplicative growth,
preferential attachment, optimal coding, etc. or
simply approximated with an empirical “a la Zipf”
formula having an arbitrary interpretation that can
hardly be discussed in a context different from mere
curve fitting.
In the presented study, the authors aim to
improve upon this, in essence theoretical, deficiency
and focus on the development of a reasonably
universal approach that would provide a distinct
modeling perspective and have a potential to deliver
a plausible and verifiable explanation of scale-free
phenomena discovered in diverse social networks.
The next section gives a general mathematical
framework. It is applied to analyze possible reasons
of the power law patterns in the observed behavior
of complex systems. Two experiments are then
conducted to determine the dynamic structure of
social networks, based on the proposed theory, and
their results are briefly discussed. The study’s
conclusions are drawn, and plans for future research
are outlined.
2 SYSTEM-THEORETIC
FRAMEWORK
In this section, we will analyze the observed
behavior of the so-called complex systems – the
conglomerates (physical, social, cognitive,
cybernetic, or the like) whose internal mechanisms
and structure by some reason cannot be inspected in
full. Power-law phenomena are very often associated
with (produced by, observed in, etc.) such systems.
Let us consider a system
Ω defined in a very
general sense, i.e. as the object of investigation (not
necessarily physically grounded). An observable
O
is a property of the system
Ω that can be
investigated in a given context. We will assume that
Ω
exists in different states and that different states
of the system release themselves as different
outcomes of observations (measurements, etc.)
associated with observables
O . The latter means
that the system states (or behavior, seen as state
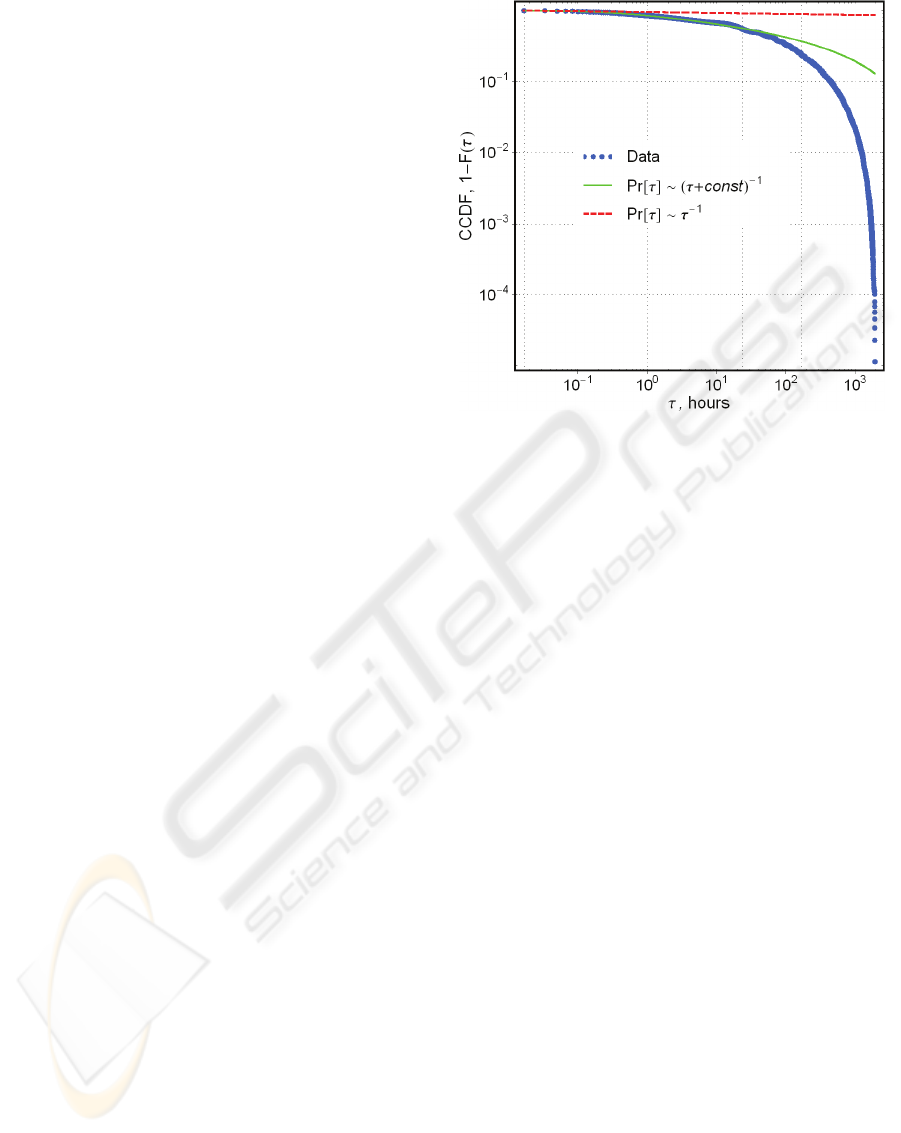
Figure 1: Problems with explaining the heavy-taile
d
activity pattern in e-mail communications: While the
empirical formula (solid line) derived by Johansen (2004)
provides a better approximation for the distribution of
τ
,
the time taken by an individual to reply to a received e-
mail, than Barabasi’s model (dashed line) based on a
n
activity-
p
rioritizing mechanism (Barabasi, 2005), it gives
no clue about the generating process. (For details on the
data, see Eckmann et al., 2004.).
MODELING THE DYNAMICS OF SOCIAL NETWORKS
243

change) are in principle conceivable through their
representations resulting from observations of
O .
We will seek to determine the distribution of the
occurrence number of different representations
associated with a given observable across increasing
expenditures of time. In so doing, we will assume
that a) the same state can have different
representations, and b) different states can have the
same representation. The analysis will be in three
steps.
Step I: to characterize the occurrence number (or
rate) of different representations of one (identical)
state for the same observable
0
O .
Case 1
: Let the process of system state
representation implement an efficient encoding
procedure so that
consttk
r
=
0
, where
0
k is the
expectation of a discrete random variable
0
K
revealing the occurrence number of different
representations, and
r
t is the average time of state
representation.
To estimate
)(
0
sf
K
the probability mass
function (PMF) of
0
K , we will maximize its
entropy
)(ln)(
00
sfsfH
KKs
Σ−=
, …,2,1=s ,
subject to constraints
1)(
0
=Σ sf
Ks
and
0
)(
0
ksfs
Ks
=Σ . This will give us “the least biased
estimate possible on the given information” (Jaynes,
1957).
The optimization problem is solved using a
Lagrangian approach. The Lagrangian function is
defined as
,))((
))(1()(ln)()(
0
0000
0
∑
∑∑
−+
−+−=
s
K
s
K
s
KKK
sfsk
sfsfsff
λ
γ
L
(1)
where
γ
and
λ
are coefficients, with optimality
conditions
0)(
0
=∂∂ sf
K
L/
, 0=∂∂
γ
L/ , and
0=∂∂
λ
L/ (Cover and Thomas, 1991). From the
first and second conditions, one can then derive
λλ
λ
s
K
eesKsf
−
−=== )1(]|Pr[)(
0
0
, (2)
where
…,2,1=s . Since
==
∑
∞
=1
0
)(
0
s
K
sfsk
)1(/1)1/(
0
K
fee =−
λλ
and 1
0
>>k ,
1)1(
0
<<
K
f
and
1<<
λ
, and therefore
0
/1 k≈
λ
.
Case 2
: Let us now consider a different-type
system and impose a conservation constraint for the
representation (observation) time by requiring that at
any time, only one but not necessarily the same
property of the system is evaluated. In other words,
we will assume that there are multiple competing
observables for the same state. We will also assume
that these observables are independent. (To simplify
technicalities, the following discussion will mainly
be built around the continuous case, i.e. for
0
k the
continuous counterpart of
0
K , yet with the
customary abuse of the notation when the same
symbol is used to refer to a random variable and to
its value.)
For
θ
a period of time,
0
w the rate of the
representation change is given as
θ
/
00
kw = .
Under the above assumptions, the dynamics of
0
w
can be modeled using a system of differential
equations defined as follows:
i
N
n
ni
i
wa
dt
dw
ημρ
+
⎟
⎟
⎠
⎞
⎜
⎜
⎝
⎛
−=
∑
=0
(3)
where
μ
is the investigated state rate (characterizes
the “true,” as opposed to the observed, behavior of
the system),
N is the number of competing
observables,
Ni ...,,1,0
=
; )(t
i
η
is a Gaussian noise
(e.g. due to measurement errors) with average zero,
some
0)( >ta
i
, and
ρ
is a parameter to account for
the efficiency of the representation process (i.e. the
system state may principally be only to an extent
available for observation).
Equations (3) describe a diffusion process in the
vicinity of a hyperplane
n
w
n
Σ=
ρμ
formed by
1
+
N observables with
n
w representation rates,
whose values are (approximately) uniformly
distributed in the interval
],0[
ρμ
. Due to the
hyperplane condition, there can be only
N mutually
independent observables, say
N
OO ...,,
1
.
θ
ρ
μ
θ
=
Σ
=
Σ
nn
wk
nn
by definition. The probability
that
0
kk
n
≥ , Nn ...,,1
=
, can be calculated as a
product of the marginal distributions
θ
ρ
μ
1)(
=
n
kf , that then yields
N
N
kkkkk )1(]...,,Pr[
0001
θρμ
−=≥≥ . Probability
theory defines the cumulative distribution function
(CDF) for some
0
x taken from the set of all random
variables that obey a given probabilistic law as
],,Pr[)(
0010
xxxxxF
N
<
<
=
… . In this context and
for
1>>N , one can write:
ICE-B 2006 - INTERNATIONAL CONFERENCE ON E-BUSINESS
244

λ
θρμ
0
1)1(1)(
00
k
N
ekkF
−
−≈−−∝
, (4)
where parameter
1
)(
−
′
=
ρθλ
r
t is, up to the constant
θ
ρ
1 , determined by
1
))1/((
−
+=
′
Nt
r
μ
the
representation time averaged over the observables
(note that generally,
r
t of Case 1 is not equal to
r
t
′
).
At this point, we would like to note that while there
would be a number of modeling scenarios both,
similar to and different from those of Case 1 and 2,
which would produce an exponential form for the
distribution sought, the approaches discussed above
have two important implications. First, the models
defined with Equations (2) and (4) both stipulate that
under other similar conditions, more often met
representations correspond, on average, to system
states with a shorter representation time. Second, for
an occurrence number significantly greater than 1,
the parameter
1<<
λ
.
Step 2: to characterize )(tk the representation
occurrence number of many different states for the
same observable
0
O .
For the system
Ω , the measured stochastic
variable
k will be a sum of random variables
...21
000
+++ kkk , where the summands are due to
different states having identical representations. The
statistical properties of
k will then depend on the
parameter
λ
that can naturally vary (e.g. as a result
of a variation in the average representation time for
different states). Let
)(
λ
g
be the probability density
function (PDF) of
λ
. For a large number of states
investigated by means of
0
O , )(kf the PDF of k
is defined as a
)(
λ
g parameter-mix of
)|(
λ
=Λkf :
∫
∞
Λ
==Λ= ∧
0
0
)()()()|()(
λλλλ
dkPggkfkf , (5)
where
)(
0
kP is the PDF of
0
k discussed in Step 1.
Step 3: to generalize the result of Step 2.
The random variable
k may reflect more than
one (presumably associated with the observable
0
O )
property of the system
Ω , while the system
mechanisms controlling the observable may be
heterogeneous in time (e.g. owing to environmental
perturbations). This can provoke the existence of
more than one probability distributions for
λ
. When
M
the number of statistically independent factors
influencing the observation (or the system behavior)
is finite,
)(kP
the PDF of the occurrence number of
system state representations can be estimated as
∑
=
=
M
i
ii
kfckP
1
)()( , (6)
where weights
i
c give the likelihood to observe the
influence of the i-th factor on the random variable
k , and each )(kf
i
is specified with Equation (5)
and is determined by the (sub)system parameters as
it was discussed in Step 1.
3 WHEN THE POWER LAW?
The analytic framework formulated in the previous
section is fairly general and can be applied to
analyze the behavior of virtually any complex
system. It should be emphasized however, that the
focus of the developed model is on the frequency
(count) of observed activities rather than on their
durations. Most of the modeling approaches
discussed in the introduction are therefore not
directly comparable to the one proposed in this
study. Given the fact that in social systems, there
often exists a detectable (though not always easily
formalizable) connection between the frequency of a
certain activity and its duration, it appears
interesting to explore under what conditions
Equation (6) may produce a power form of the
probability distribution.
An acute reader would have already noticed that
the substitution of the exponential PDF into
Equation (5) yields a Laplace transform of the
product
)(
λ
λ
g :
∫
∞
−
=
0
)()(
λλ
λ
dGekf
k
, (7)
where
)(
λ
G is the CDF of
λ
.
This is a very nice result since it, owing to
Bernstein’s theorem (Bernstein, 1928), stipulates
that if
)(kf
, the PDF of the observed variable, is
completely monotone, i.e. all its derivatives exist
and
0)()1(
)(
≥− kf
nn
for any integer 0>k and
1≥n , there can always be found some proper )(
λ
G
in effect describing the internal (i.e. not directly
observed, “true”) dynamics of the system. There is a
large class of probability distributions for
λ
(e.g.
originated from or simply approximated with the
Beta of the Second Kind probability distribution
MODELING THE DYNAMICS OF SOCIAL NETWORKS
245
)(1
)1())()(/)(()(
qpp
qpqpg
+−−
+ΓΓ+Γ=
λλλ
,
where
)(⋅Γ denotes the Gamma function, 0>p and
0>q are parameters, which encompasses many
commonly used distributions, such as the Log-
Normal, Gamma, Weibull, etc. – see McDonald and
Xu, 1995) that will cause “fat” tails of the observed
data
β
−
∝ kkf )( for some 0>
β
as
∞
→k (Abate
and Whitt, 1999). This asymptotic property will,
however, not necessarily be maintained for small
k .
Generally, the developed model dictates that in
the case of a homogeneous (i.e. assuming the
existence of one PDF
)(
λ
g
) system, candidate
distribution functions for the description of the
statistical properties of
k and
λ
should satisfy
Equation (7). In view of this, an interesting exercise
would be to find a family of probability functions
satisfying the Laplace transform (7). Unfortunately,
no closed analytic forms for
)(
λ
g exist in many
cases of long-tailed
)(kf
.
Equation (6) further stipulates that in order for
β
−
∝ kkP )( , either all the summands should have
an identical “heavy-tailed” form (that would indicate
certain self-similarity existing in the system) or at
least one of the summands should have a power
form with an exponent
i
β
small enough to
dominate the asymptotic behavior of the other
distributions.
4 MODELING THE DYNAMICS
OF SOCIAL NETWORKS
To verify the proposed model against real-world
data and explore its predictive and analytic
capabilities, two experiments have been conducted.
4.1 Experiment 1
Data used in the experiment is a sample representing
the timing of e-mails sent and received by a group of
~10000 people at a university in Europe during a
period of ~80 days. The corresponding server log-
file was obtained from the authors of Reference
(Eckmann et al., 2004). Specifically, we have
focused on the time taken by an individual to reply
to a received message – the human response rate;
there have been extracted ~24000 of reply times
from the file. It was reported elsewhere (Eckmann et
al., 2004; Johansen, 2004; Barabasi, 2005) that
power-law generating mechanisms could be behind
the formation of the distribution of this data, as it
exposes the characteristic (yet noisy) heavy-tailed
pattern (see Figure 1; also the inset in Figure 2).
The discretization time interval for the delays
with reply was set to 1 minute. No other
preprocessing has been done. The investigated
system in this case is the social system that existed
at the university, and the observed property is the
perturbed (by incoming e-mails) communication
timing. It is expected that delays with reply to
received e-mails reveal the rate of the system
internal state change (e.g. in its simplest form, from
“e-mail is not replied” to “e-mail replied”).
The two-parameter Gamma distribution
)(/)(
1
νλλ
λνν
Γ=
−− b
ebg , where 0≥
λ
, 0>b ,
0>
ν
, and )(
⋅
Γ
denotes the Gamma function, was
chosen to characterize the system’s hidden
dynamics, because this is a simple form well
describing cognitive processes and “mental” reaction
time (Luce, 1986). This form can, and possibly
should, be considered for
)(
λ
g regardless what is
the “true” mental architecture triggering one or
another investigated human activity (van Zandt and
Ratcliff, 1995). Taking into account the discrete
nature of the observed variable value count and after
substitution of the corresponding PMF and PDF into
Equation (5), Equation (6) is specialized to
...,2,1,
)()1(
)(
1
=
⎟
⎟
⎠
⎞
⎜
⎜
⎝
⎛
+
−
+−
=
∑
=
k
bk
b
bk
b
ckP
M
i
v
i
v
i
v
i
v
i
i
i
i
i
i
(8)
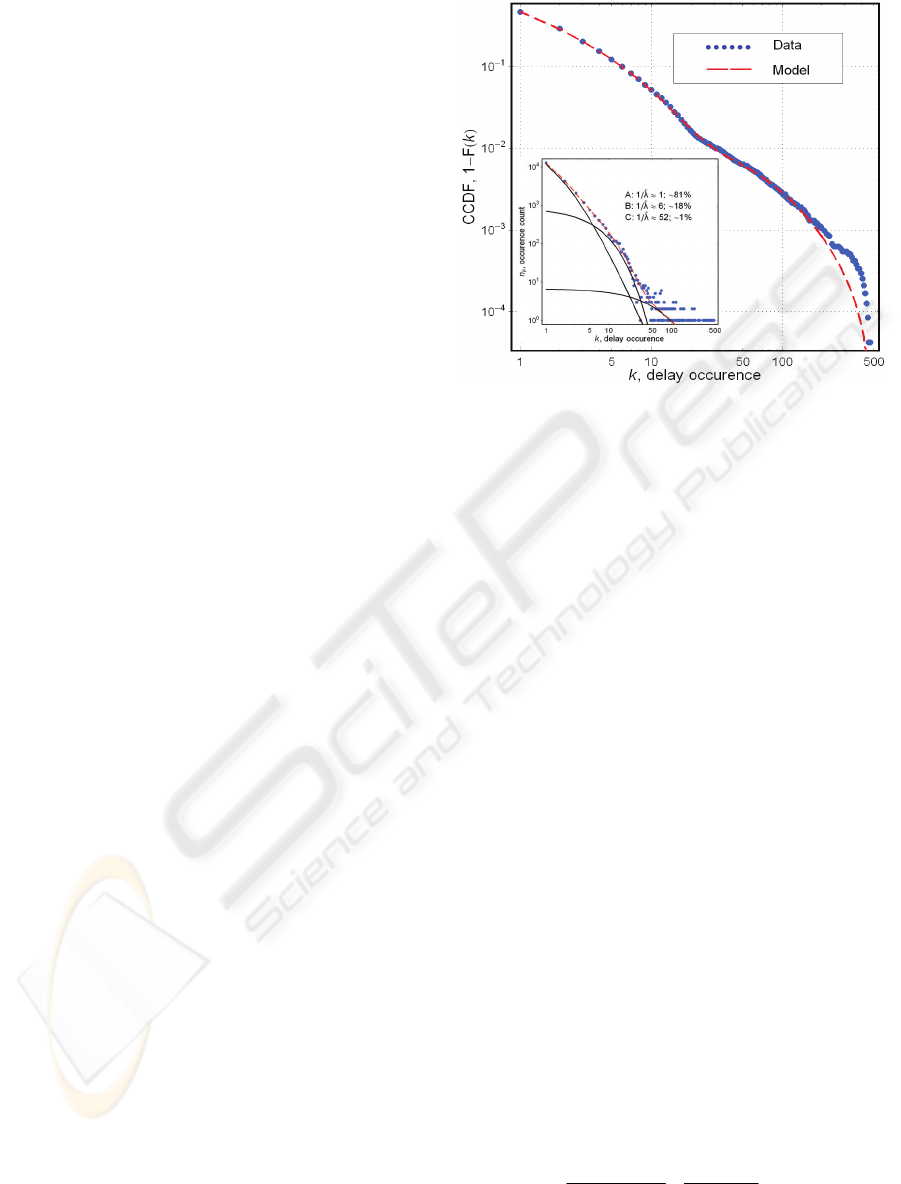
Figure 2: Estimation of the dynamic social structure base
d
on an analysis of the traffic in a university e-mail network.
A
C
B
ICE-B 2006 - INTERNATIONAL CONFERENCE ON E-BUSINESS
246
that is thus the probability mass function of the
occurrence of a human response rate. Note that each
of the summands has the form of the discrete Lomax
distribution.
Figure 2 depicts the complementary cumulative
sums calculated for the data and the model (8) with
parameters
i
c ,
i
b and
i
ν
obtained by a numerical
maximum likelihood method and
3=M as yielding
the smallest value of Akaike’s Information Criterion,
nxL 2))|
ˆ
(log(2AIC +−=
φ
, where ))|
ˆ
(log( xL
φ
is
the log-likelihood maximized with parameters
φ
ˆ
(for the PMF (8),
Mibc
iii
...,,1},
ˆ
,
ˆ
,
ˆ
{
ˆ
1
==
≠
νφ
) for a
given sample
x
, and n is the number of estimable
parameters (for
3=M , 8=n ). AIC is a
fundamental measure assessing the relative
Kullback-Leibler distance between the fitted model
and the unknown true mechanism, which actually
generated the observed data (Akaike, 1983). Taking
into account the information known from the
original report (Eckmann et al., 2004) about the
structure of the social system in focus, models with
M
the number of components ranging from 1 to 4
have been tried in the experiment. The second-best
model had
2=
M
, 5=n and was therefore simpler,
but with an
AIC value by 90 greater than in the case
of
3=M it had to be omitted from further
consideration (Sakamoto et al., 1986).
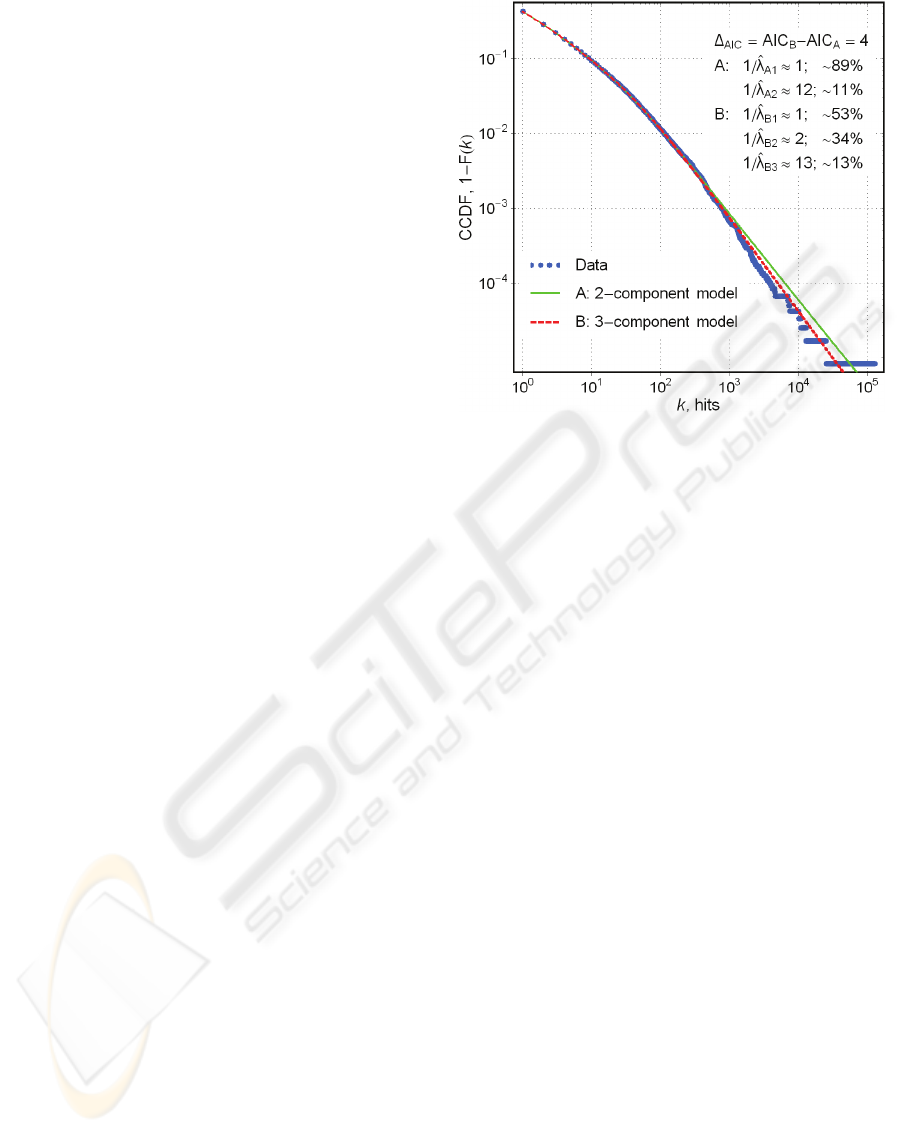
4.2 Experiment 2
To explore the dynamic structure of an e-market on
the World-Wide Web, a data sample representing
the activity of America Online (AOL) users (acting
as consumers of the services provided by Web sites)
has been obtained from the authors of Reference
(Adamic and Huberman, 2000). The sample covers
approximately 120000 sites accessed by 60000 users
during one day.
Figure 3 shows the results of the modeling of the
consumer activity dynamics with formula (8). It is
assumed that a hit to a particular site corresponds to
a specific mental or “goal” state, and that these
states are common (i.e. shared) within the population
(from a generic anthropological viewpoint, this
seems a natural assumption). As no a priori
information was available on the structure of the
social system examined, four prediction models have
been probed by varying the value of
M
from 1 to 4.
The two models displayed in the figure are
statistically justified by the data and perform
practically equally well.
5 DISCUSSION
It is quite illustrative that while a “pure” form of the
power law would fail to reasonably accurately
predict probabilities for the entire ranges of the data
used in the experiments, as the corresponding
complementary cumulative sums visibly do not form
single straight lines on the double-logarithmic plots,
the model specified with Equation (8) produces
sound fits.
For the university e-mail network, Pearson’s
2
χ
test does not reject the model with a significance
level
001.0
=
α
that might be considered good
enough in the case of noisy data. An objection
would, however, be made that the proposed model
overfits the data: the large number of its parameters
creates a situation when the fit may be driven by the
random fluctuations rather than by the “true”
statistical properties of the data.
The values of
i
c the parameters obtained in the
first experiment suggest that the examined social
system has an internal structure: there are two
subsystems with different dynamics responsible for
the generation of approximately 81 and 18% of the
observed variety in delays with reply to an e-mail;
about 1% of the occurrences – for the most typical
and shortest delays – are probably caused by factors
other than social (e.g. owing to an auto-reply
Figure 3: Modeling the Web site (server) visiting rate
(hits) observed on December 1, 1997, in a segment of the
WWW. (For details on the data, see Adamic an
d
Huberman, 2000.).
MODELING THE DYNAMICS OF SOCIAL NETWORKS
247

function of the e-mail clients or the processing of
long mailing lists) and may be excluded from
consideration.
The larger, “static” subsystem –
A in the inset of
Figure 2, where the distributions are built for the
data, the model, and the model’s 3 components –
produces on average longer yet unique delays (for a
gamma-distributed
λ
, the estimate of its mean
bv
/
ˆ
=
λ
). The second subsystem – B – is
approximately 4 times smaller (or 4 times
observationally less influential) and 6 times more
dynamic (and hence, as it could be speculated, is
more constrained and/or has stronger social ties).
These size estimates principally conform to the ones
reported in the original work (Eckmann
et al., 2004)
and independently obtained through somewhat
intricate analysis of the individual communications
present in the sample. This, along with the fact that
the obtained parameters behave just as it is implied
by the model (back to Section 2), can be considered
as strong evidence in support of the hypothesis that
Equation (8) does describe the system behavior but
not merely approximates the data.
In the second experiment, the models with two
and three Lomax-distributed components are not
rejected by Pearson’s test with
1.0=
α
. The
difference in
AIC calculated for these models
implies that neither should be favored in the absence
of information other than obtained from the data.
Nevertheless, both of them suggest that
approximately 10% of the observed variety in the
site popularity is due to mental states (and
corresponding activities) most often experienced
(pursued) by the consumers at the e-market. The
latter does not appear implausible in the light of the
Internet demographic survey for 1997 by Nielson
Media Research (http://www.nielsenmedia.com
)
stating that 73% of the consumers used the WWW to
search for information about products and services
by means of accessing a small number of Web
portals and search engines, such as Yahoo
®
, etc.
It is understood that for any “complete”
validation of the proposed model, many more
experiments are required but are beyond the limits of
this paper. Additional cross-checking and
verification are, however, still indispensable because
technically, derivation of the Lomax (Pareto Second
Kind or General Pareto) distribution as a gamma
mix of exponentials was first reported several
decades ago (Harris, 1968) but did not receive due
attention in complex system research.
One supportive argument for the proposed
approach is that it does not contradict the findings
about the dynamics of social networks reported in
the literature, but instead generalizes them. The
widely held form of the power law
1
/)(
+
=
νν
ν
kbkP can be obtained from Equation (8)
for
bk >> by Taylor series expansion (the minuend
– by small
kb /)1(
−
, and the subtrahend – by small
kb / ) under the assumption that the investigated
system is homogeneous (i.e. by setting
1=
M
).
Let us now consider an asymptotic
approximation of the model, which is also the
continuous counterpart of Equation (8):
1
)()(
−−
+=
ν
ν
bkbkP
v
c
. (9)
From
∫
∞
−
+==
x
c
xbbldkkPlxR
νν
)()()( , (10)
where
)(xR gives
r
the rank of a unit of size
x
,
)()()2()1( lr
xxxx ≥≥≥≥≥
, in a set of
l
objects, one can easily obtain
1/1/11 −−+−
−= lbrlbf
r
νν
, (11)
where
r
f is the relative occurrence frequency of the
r-th popular unit. When
u
r
>>
, this result coincides
with the empirical formula
α
−
++= )( ruqdf
r
, d,
q, and u are some constants, obtained by the authors
of Reference (Krashakov
et al., 2006). Moreover,
the negative values of
d empirically calculated in the
latter study are generally in agreement with what
would be estimated based on the sample size by
applying formula (11), where
0, >lb by definition.
As a final remark, let us mention that a
lognormal distribution is often discussed as an
alternative to the power law when describing the
dynamics of complex systems (Mitzenmacher, 2003;
Stouffer
et al., 2005). Given bk >> and some m,
km ln2 >> , Equation (8) can be approximated as
ν
ν
ν
ν
/2
2
)(ln
2
)(
m
mk
m
e
k
eb
kP
+
−
= (12)
that gives its lognormal asymptotic form.
6 CONCLUSIONS
Having defined the overall goal as to deliver a
universal but simple and accurate theoretical model
for the observed behavior of a large class of complex
systems, in this particular paper we focused on the
ICE-B 2006 - INTERNATIONAL CONFERENCE ON E-BUSINESS
248

formation of the dynamics of social networks and on
methods for the network structure analysis. A
mathematical model correctly describing these
phenomena would help optimize resource and
service allocation as well as economic and
management policies for companies in both the
traditional and electronic business sectors, and also
for organizations involved in collaborative activities,
such as distribution of funds, innovation and know-
how exchange, and so on.
We have applied the apparatus of statistical
physics to describe the emergence of social
networks. The network dynamics was defined in
terms of its structure (i.e. how many subsystems are
there and what is, as observed, their influence on the
overall dynamics) as well as parameters of its
elementary constituents (these parameters are the
mental reaction time and, possibly, response times of
external systems coupled with or simply affecting
the social network). In the presented experiments,
the proposed model has demonstrated a prognostic
potential far superior to any of the classical
modeling approaches. At the same time, the model
proved to be quite encompassing but natural and
thus easy to interpret and validate.
In our prior research reported elsewhere, the
system-theoretic framework was successfully
applied to capture the structure of different
languages and to compare the efficiencies of text-
and hypermedia- based communication (Kuleshov
et
al
., 2005; Kryssanov et al., 2005). In future studies,
we plan to explore various authorship networks.
ACKNOWLEDGEMENTS
The authors would like to thank, without
implicating, Lada A. Adamic and Jean-Pierre
Eckmann for providing the data used in the research.
REFERENCES
Abate, J. and Whitt, W., 1999. Modeling service-time
distributions with non-exponential tails: Beta mixtures
of exponentials. Stochastic Models, 15, 517-546.
Adamic, L.A. and Huberman, B.A., 2000. The nature of
markets in the World Wide Web. Quarterly Journal of
Electronic Commerce, 1, 5-12.
Akaike, H., 1983. Information measures and model
selection. International Statistical Institute, 44, 277-
291.
Barabasi, A.-L. and Albert, R., 1999. Emergence of
scaling in random networks. Science, 286, 509.
Barabasi, A.-L., 2005. The origin of bursts and heavy tails
in human dynamics. Nature, 435, 207-211.
Bernstein, S.N., 1928. Sur les functions absolument
monotones. ACTA Mathematica, 51, 1-66.
Cover, J., and Thomas, J.A., 1991. Elements of
Information Theory, John Wiley&Sons. New York.
Eckmann, J.-P., Moses, E., Sergi, D., 2004. Entropy of
dialogues creates coherent structures in e-mail traffic.
PNAS, 101, 14333-14337.
Harris, C.M., 1968. The Pareto Distribution As A Queue
Service Discipline. Operations Research, 16, 307-313.
Jaynes, E.T., 1957. Information theory and statistical
mechanics. Physical Review, 106, 620-630.
Johansen, A., 2004. Probing human response times.
Physica A, 338, 286-291.
Krashakov S.A., Teslyuk A.B., and Shchur, LN., 2006 (in
press). On the universality of rank distributions of
website popularity. Computer Networks.
Kryssanov, V.V., Kakusho, K., Kuleshov, E.L., Minoh,
M., 2005. Modeling hypermedia-based
communication. Information Sciences, 174, 37-53.
Kuleshov, E.L., Krysanov, V.V., and Kakusho, K., 2005,
The distribution of term frequency in texts.
Optoelectronics, Instrumentation and Data
Processing, 41, 81-90.
Luce, R.D., 1986. Response Times. Their Role in Inferring
Elementary Mental Organization, Oxford University
Press. New York.
McDonald, J.B. and Xu, J.Y., 1995. A Generalization of
the Beta of the First and Second Kind. Journal of
Econometrics, 66, 133-152.
Mitzenmacher, M., 2003. A Brief History of Generative
Models for Power Law and Lognormal Distributions.
Internet Mathematics, 1, 226–251.
Newman, M.E.J., 2005. Power laws, Pareto distributions
and Zipf's law. Contemporary Physics, 46, 323-351.
Oliveira, J.G. and Barabasi, A.-L., 2005. Darwin and
Einstein correspondence patterns. Nature, 437, 1251.
Sakamoto, Y., Ishiguro, M., and Kitagawa, G., 1986.
Akaike information criterion statistics, KTK
Scientific. Tokyo.
Scalas, E., Kaizoji, T., Kirchler, M., Huber, J., Tedeschi,
A., 2006 (in press). Waiting times between orders and
trades in double-auction markets. Physica A.
Solow, A.R., Costello, Ch.J., Ward, M., 2003. Testing the
Power Law Model for Discrete Size Data. The
American Naturalist, 162, 685-689.
Stouffer, D.B., Malmgren, R.D., and Amaral, L.A.N.,
2005. Comments on “The origin of bursts and heavy
tails in human dynamics”. arXiv:physics/0510216 .
van Zandt, T. and Ratcliff, R., 1995. Statistical mimicking
of reaction time data: Single-process models,
parameter variability, and mixtures. Psychonomic
Bulletin & Review, 2, 20-54.
MODELING THE DYNAMICS OF SOCIAL NETWORKS
249
