
GRAIN SIZE MEASUREMENT IN IMAGES OF SANDS
Fátima Cristina Lira, Pedro Pina
CVRM/Geo-Systems Centre, Instituto Superior Técnico, Av. Rovisco Pais, 1049-001 Lisboa, Portugal
Keywords: Image Analysis, Sands, Grains, Granulometry.
Abstract: Different sand deposits exhibits different size distributions and measuring the size of its grains permits to
obtain important information about these deposits and consequently the establishment of correlations
between them. This paper presents a new method for the characterization of grain sand size based on image
analysis. Size distributions are obtained with successive morphological openings parameterized by
structuring elements of increasing size. The results obtained from image analysis and sieving are compared
transforming the area measured in the images to weight, assuming some simplifications. Although some
bias is introduced in relation to sieving, the global sediments characteristics are kept allowing to conclude
that image analysis is an alternative technique for measuring the size of sand grains.
1 INTRODUCTION
The understanding of sedimentary particles
properties allows the acquisition of extremely useful
information. These properties reflect the genesis, the
processes of transportation and deposition and also
permit to establish correlations between different
types of particles and the evaluation of natural
resources availability (Friedman et al., 1979).
The size of the sand particles or grains is one of
the most important properties since its measurement
allows characterizing and distinguishing different
deposits.
The computation of size in sands has long been
obtained by means of sieving. This is an established
technique that requires long time intervals until the
final results are obtained. These results are normally
presented in the form of cumulative curves of the
weight of grains between two consecutive sieve
sizes. The size of the sieve is given as the size of the
aperture measured perpendicularly to the wires
through the centre of the hollow space.
The possibility of applying image analysis to
obtain multiple features of an object, namely size,
shape, number and class, is considered now to be
applied to the study of sedimentary particles, in
particular, to sands. We intend to substitute the
classical sieving approach by the one based on
image analysis in order to make it faster,
autonomous, with more accurate results and also by
introducing new measurements.
It should be added that the applications of image
analysis in sedimentology are quite restrict. The few
exceptions are the studies of Francus (1998),
Heilbronner (2000), Rφgen et al. (2001), Coster et
al. (2001), Andriani et al. (2002) and Selmaoui et al.
(2004), that applied image analysis to consolidate
sediments. Moreover, the application to
unconsolidated sediments of different sizes were
done by Persson (1998), Balagurunathan et al.
(2001) and Graham et al. (2005), but none to sands.
2 METHODS
Four types of sands from different deposits were
collected and used in this investigation. The origin
of the samples is quite distinct in order to better
evaluate the sensibility of our approach to the range
of characteristics presented by the different types of
sands. In this paper, one dune sample (Sancha), two
beach samples (F260 and F271) and one platform
sample (9460) are used.
2.1 Image Acquisition
The acquisition of images was performed using a
flatbed colour scanner. Using a scanner to obtain
images allowed us to reduce a series of problems
that are usually encountered with other acquisition
devices. The illumination conditions are constant
and since the particles are facing the scanner glass
371
Cristina Lira F. and Pina P. (2006).
GRAIN SIZE MEASUREMENT IN IMAGES OF SANDS.
In Proceedings of the First International Conference on Computer Vision Theory and Applications, pages 371-374
DOI: 10.5220/0001375303710374
Copyright
c
SciTePress
with acceptable narrow size ranges, it can be
considered that all of them are correctly focused.
Moreover, in order to avoid the existence of
shadows a black background was used.
The grains of the sands of the different samples
were quartered and winnowed over the scanner
glass, which was previously protected with a
transparency. At this stage, sand particles were
placed in such a way that the contact is permitted but
not the overlapping between them. The situation
where the overlapping is permitted, like it happens
in the field, is not addressed currently in this paper.
Since the pixel dimension depends exclusively
on the resolution of acquisition, no additional
measurements were necessary to obtain the object
scale. In the particular case of the sands under study,
the best spatial resolution to acquire images is
1200dpi, since the limit of the minor granulometrical
sand class available and measured by other methods
is 0.063 mm. The chosen spatial resolution allows
identifying the smallest structure in these types of
sands with at least a region with 3 x 3 pixels (Table
1). An example of the type of images acquired is
presented in Figure 1.
Table 1: Relations between spatial resolution, pixel size
and aperture size.
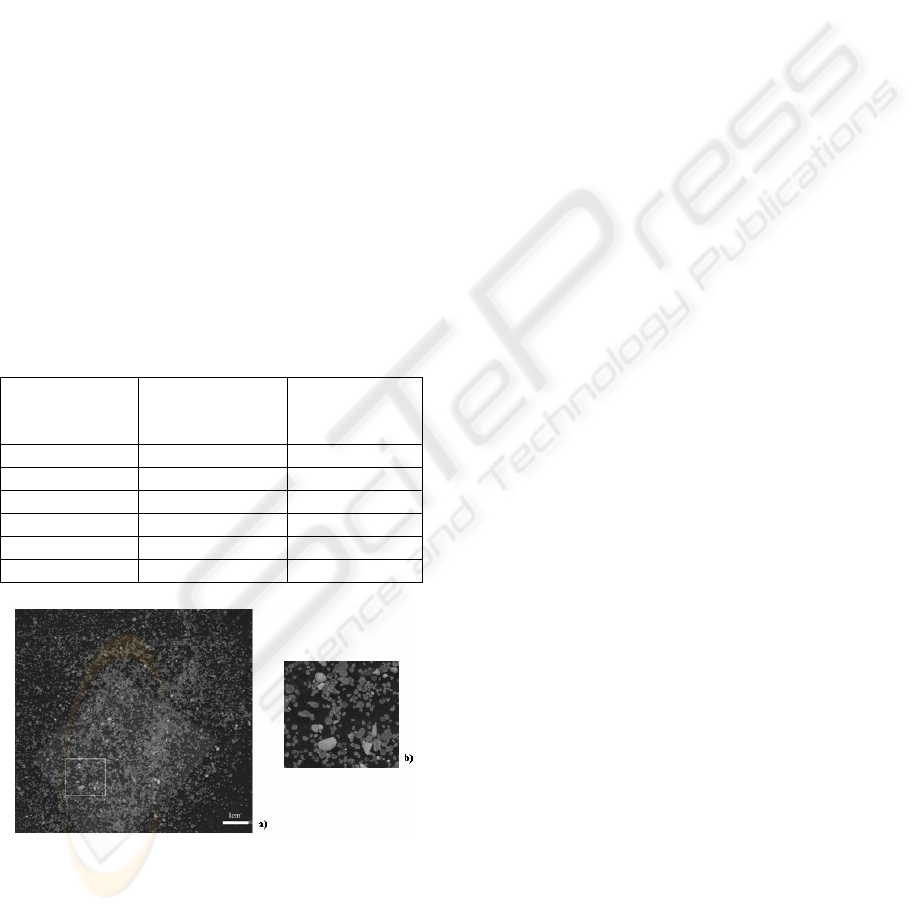
Figure 1: Example of sand particles images acquired by
scanning: a) Image acquired; b) Portion of a) zoomed.
The sand particles tend to locate themselves with
their major and intermediate axis perpendicular to
the plane of the scanner glass. In the sieving method,
the axis that controls the passages of the particles
through the sieve apertures is the intermediate axis.
Thus, the particle orientation against the scanner
glass permits image analysis to analyse the same
fundamental axis.
Digital images were acquired in true colour
mode (RGB), with a spatial resolution of 1200 dpi
and saved in uncompressed TIFF format (Figure 1),
occupying normally about 60 Mbytes. Although
colour is not used to compute the size distributions,
it will be necessary to perform later additional
procedures, namely, to classify the different types of
minerals that constitute the samples.
2.2 Adjacent Grains Segmentation
At this stage of our approach, the colour information
is not necessary, so we converted the RGB bands
into one single band given by their mean image or
intensity channel. The binarization of the sand is
very simple and direct, and one single threshold
value is enough to correctly separate the black
background from the lighter grains.
The main problem on the binary images resides
in the grains that are touching each other and that
need to be separated or segmented for the posterior
individual analysis. An algorithm that uses the
distance function notion and the watershed
transform is presented and is applied to the binary
images of the sand. The computation of a distance
function of the grains indicates the distance that each
of its points is from the borders (figure 2b). The
computation of the negative image (figure 2c),
followed by a closing (figure 2d) to eliminate local
extrema without low significance to minimize the
overssegmentation effect, permits the application of
the watershed algorithm, initially proposed by
Beucher & Lantuéjoul (1979). The resulting
catchments basins constitute the division lines
between adjacent sand particles (figure 2e). The
complementary image (figure 2e) is subtracted to the
input image (figure 2a) and a segmented binary
image of sand particles is obtained (figure 2f).
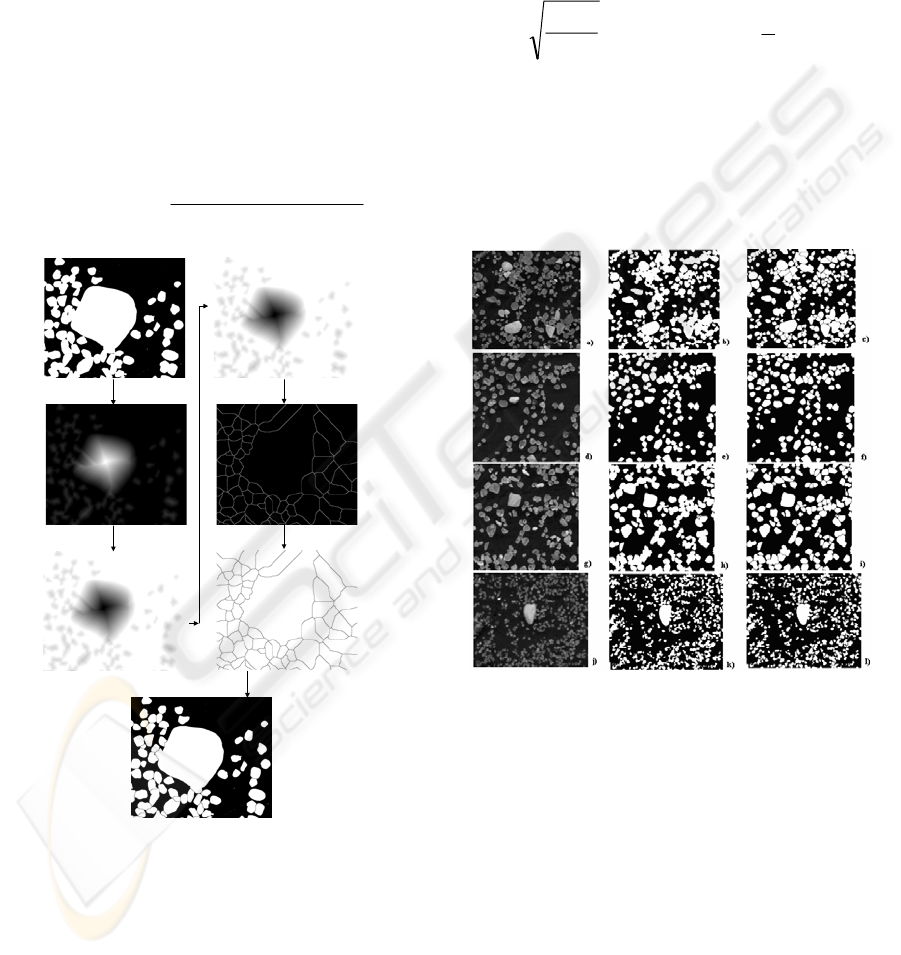
The segmentation results obtained for all the
studied images are highly satisfactory, like the
examples presented in figure 2 demonstrate for four
types of sands. This approach works correctly for
grains touching each other and also in grains where
the overlapping degree does not exceed 20% of the
respective surface.
2.3 Grain Size Measurement
Morphological openings,
γ
, are capable of
modelling the traditional sieving processes
Spatial
Resolution
(dpi)
Pixel size
(mm)
Smallest
sand grain
(mm)
300 0.084 0.252
400 0.063 0.189
600 0.042 0.126
900 0.028 0.084
1200 0.021 0.063
1800 0.014 0.042
VISAPP 2006 - IMAGE ANALYSIS
372
(Matheron, 1975), by simulating the same processes
of the sieves. Particles are progressively eliminated
by increasing the size of the structuring element
used and their surface is reduced as in the sieving
procedure whereas the size of the sieve is reduced.
In this case, the initial image X is “sieved” by a
squared structuring element B of size
λ
that
eliminates the regions of the grains that do not
contain it completely. By measuring the area of the
remaining grains, one obtains the size distribution
function,
),(
λ
XS , cumulative function in measure
which is defined by the proportion of points
Xx
∈
that were eliminated by applying openings of size
)0( >
λ
λ
:
[]
[
]
[]
XArea
)(γAreaXArea
λ)S(X,
λB
X−
=
1)
a) Input Image
f) Output Image
b) Distance
Function
c) Negative
d) Closing
e) Watershed
e) Complementation
Figure 2: Particle segmentation algorithm.
3 RESULTS
In order to compare both granulometries obtained
from the image analysis data and the sieve data,
some additional calculations are necessary. In fact
sieving measures measure the weight of the grains
passing through sieves while image analysis
measures the area of the grains. Thus, in order to
compare both methods, the measured areas need to
be transformed into weight. This transformation is
made presently in a simple form by assuming that all
particles are spheres and have the same density. This
way, the volume V is computed with grain radius r:
Π
=
Area
r
2)
3
3
4
rV Π=
3)
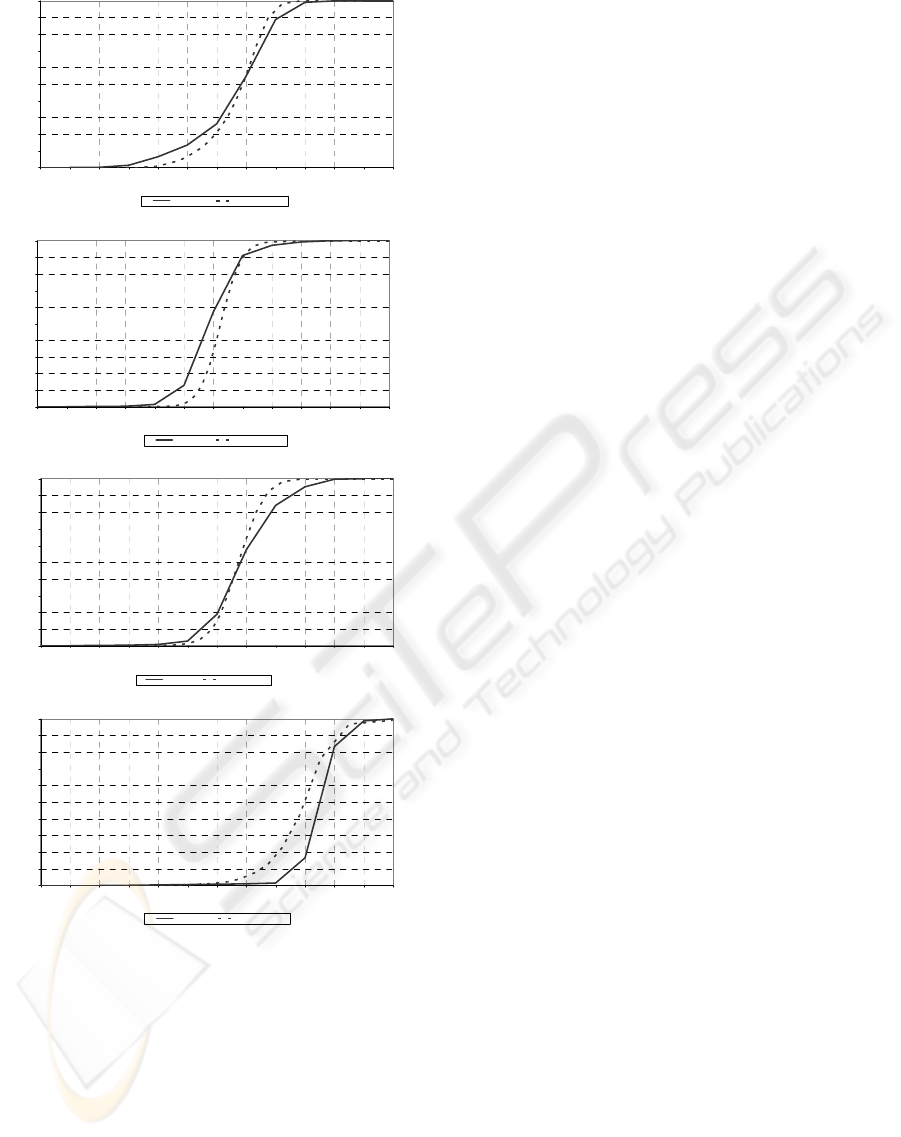
In figures 4, 5, 6 and 7 it can be observed, for
each sample, both size distribution curves obtained
by sieving and image analysis. It can be concluded,
from the examples studied, that both curves have the
same behaviour and that image analysis distributions
are extremely near the reference one (sieving).
Figure 3: Images acquired. First colunm: zoomed images
in grey tone; second column: binary images and third
column segmented binary images. Sancha sample (a), b)
and c)); F260 sample (d), e) and f)); F271 sample (g), h)
and i)) and 9460 sample (j), k) and l)).
4 CONCLUSIONS
Results are highly satisfactory since image analysis
is capable of detect the same similarities and
differences in the samples, than the traditional
method (sieving). In addition, the image based
technique is more powerful by permitting to study
higher volumes of data in shorter periods of time and
also by allowing performing other studies, namely,
related to geometry
GRAIN SIZE MEASUREMENT IN IMAGES OF SANDS
373
0
10
20
30
40
50
60
70
80
90
100
-2.0 -1.5 -1.0 -0.5 0.0 0.5 1.0 1.5 2.0 2.5 3.0 3.5 4.0
Size (φ)
Cumulative percentage (weight)
Sieving Image Analysis
Figure 4: Size distribution for sample Sancha.
0
10
20
30
40
50
60
70
80
90
100
-2.0 -1.5 -1.0 -0.5 0.0 0.5 1.0 1.5 2.0 2.5 3.0 3.5 4.0
Size (
φ
)
C
umu
l
a
ti
ve percen
t
age
(
we
i
g
ht)
Sieving Image Analysis
Figure 5: Size distribution for sample F260.
0
10
20
30
40
50
60
70
80
90
100
-2.0 -1.5 -1.0 -0.5 0.0 0.5 1.0 1.5 2.0 2.5 3.0 3.5 4.0
Size (φ)
Cumulative percentage (weight)
Sieving Image analysis
Figure 6: Size distribution for sample F271.
0
10
20
30
40
50
60
70
80
90
100
-2.0 -1.5 -1.0 -0.5 0.0 0.5 1.0 1.5 2.0 2.5 3.0 3.5 4.0
Size (φ)
Cumulative percentage (weight)
Sieving Image Analysis
Figure 7: Size distribution for sample 9460.
It should be remarked that the results present a
certain bias since we have assumed that the grains
were all spherical with the same density. In order to
overcome this point we are developing one method
to classify the different types of grains and to
compute the actual 3D volume from the measured
2D information
Moreover, we are working on a methodology
that extracts information from images of sands
where the overlapping of grains is permitted (like in
a natural scene) with the estimation of the
corresponding granulometries.
ACKNOWLEDGEMENTS
This research is part of a MSc thesis at Instituto
Superior Técnico from the Technical University of
Lisbon with the collaboration of Faculdade de
Ciências from the Lisbon University. I would like to
thank Prof. Rui Taborda and Doutor João Cascalho
for supplying the samples used in this study. Part of
this research has been developed in the frame of the
project POCTI/ECM/46255/2002.
REFERENCES
Andriani, G.F. & Walsh, N., 2002, Physical properties and
textural parameters of calcarenitic rocks: qualitative
and quantitative evaluations. Engineering Geology,
67: 5-15.
Balagurunathan, Y.; Dougherty, E.; Bilinski, S.F.;
Bilinski, H. & Vdovic, N., 2001, Morphological
granulometric analysis of sediment images. Image
Analysis & Stereology, 20: 87-99.
Beucher, S., Lantuéjoul, Ch., 1979, Use of watershed in
contour detection, in Proc. Int. Workshop on Image
Processing: Real-Time Edge and Motion
Detection/Estimation, Rennes, 2.1-2.12.
Coster, M. & Chermant, J.L., 2001, Image analysis and
mathematical morphology for civil engineering
materials. Cement & Concrete Composites, 23: 133-
151.
Francus, P., 1998, An image-analysis technique to
measure grain-size variation in thin section of soft
clastic sediment. Sedimentary Geology, 121: 289-298.
Friedman, G.M. & Sanders, J.E., 1979. Principles of
Sedimentology. John Wiley & Sons, New York.
Graham, D.J.; Reid, I & Rice, S.P., 2005, Automated
sizing of coarse-grained sediments: Image processing
procedures. Mathematical Geology, 37(1): 1-28.
Heilbronner, R., 2000, Automatic grain boundary
detection and size analysis using polarization
micrograhs or orientation images. Journal of
Structural Geology, 22: 969-981.
Matheron, G., 1975, Random sets and integral geometry.
John Wiley & Sons. New York.
Persson, A.L., 1998, Image analysis of shape and size of
fine aggregrates. Engineering Geology, 50: 177-186.
Rφgen, B.; Gommesen, L.E.; Fabricius, I.L., 2001, Grain
size distribution of chalk from image analysis of
electron micrographs. Computers & Geosciences, 27:
1071-1080.
Selmaoui, N.; Repetti, B.; Laporte-Magoni, C. &
Allenbach, M., 2004, Coupled strata and granulometry
detection on indurated cores by gray-level images
analysis. Geo-Marine Letters, 24: 241-251.
VISAPP 2006 - IMAGE ANALYSIS
374
