
AN AUTOMATIC APPROACH FOR PARAMETER SELECTION IN
SELF-ADAPTIVE TRACKING
Daniela Hall, R
´
emi Emonet and James L. Crowley
INRIA Rh
ˆ
one-Alpes
France
Keywords:
Tracking, performance optimization, automatic parameter regulation.
Abstract:
In this article we propose an automatic approach for parameter selection of a tracking system. We show that
such a self-adaptive tracking system achieves better tracking performance than a system with manually tuned
parameters. Our approach requires little supervision by a user which makes this approach ideally suited for
commercial applications. The self-adaptive component makes the system less sensitive to changing environ-
mental conditions. Components for tracking, auto-critical evaluation and automatic parameter regulation serve
to detect performance drops that trigger the parameter regulation process. The self-adaptive components re-
quire a quality measure based on a statistical scene reference model. We propose an automatic approach for
the generation of such a reference model and compare several learning approaches. The experiments show
that the auto-regulation of parameters significantly enhances the performance of the tracking system.
1 INTRODUCTION
In this article we propose an automatic approach for
parameter selection of a tracking system. We show
that such a self-adaptive tracking system achieves bet-
ter tracking performance than a system with manually
tuned parameters. Our approach requires little super-
vision by a user during initialisation which makes this
approach ideally suited for commercial applications.
The future goal of this work is to incorporate the
technology of self-adaptation into commercial video
surveillance systems. The growing number of in-
stalled video surveillance systems represent a great
demand for automatic setup and configuration. Nowa-
days, an engineer is required for system installation.
The installation requires also the manual adaptation
of parameters. Such systems perform well as long
as the environment stays constant. Unfortunately, in
most real applications the environmental conditions
perceived by the sensors frequently change, which of-
ten breaks the system and requires reinitialisation and
new hand tuning of the parameters. For a company
with a large number of systems, the maintenance in-
cluding manual parameter tuning would require too
much resources. This article proposes an approach
that makes hand tuning of parameters obsolete. The
approach is automatic that means it requires no hu-
man supervision during run time, human supervision
is required only for the initialisation of the model gen-
eration.
Our approach generates a scene reference model
that models correct system output in a probabilistic
manner. Based on this model we define a metric to
judge the system output (detect errors and detect per-
formance decrease). This metric is also used to select
the optimal parameter setting for the current environ-
mental conditions. The selection is automatic with-
out prior knowledge about the environmental condi-
tion change.
In this article we address the important steps of our
approach. First, generation of the scene reference
model and model selection. Second, definition of a
quality metric and third, development of a strategy for
parameter space exploration.
As related work we want to cite Murino who ad-
dresses the problem of automatic parameter regu-
lation for vision systems in (Murino et al., 1996).
He proposes a multi-layered component architecture.
Each layer has its own set of parameters that are tuned
such that the evidence (coming from the lower level)
and the expectation (coming from the higher level) are
consistent. The improvements are not convincing and
the approach lacks the use of an external knowledge
base.
20
Hall D., Emonet R. and L. Crowley J. (2006).
AN AUTOMATIC APPROACH FOR PARAMETER SELECTION IN SELF-ADAPTIVE TRACKING.
In Proceedings of the First International Conference on Computer Vision Theory and Applications, pages 20-26
DOI: 10.5220/0001372600200026
Copyright
c
SciTePress

Scotti (Scotti et al., 2003) proposes an approach
based on self organizing maps (SOM). The SOM is
learnt by registering good parameter settings. During
run time, the automatic parameter selection chooses
the closest setting in SOM space that performed best
during training. The experiments are not convincing
and we think that the method has strong limitations.
In (Min et al., 2004), Min proposes an approach
for comparing the performance of different segmen-
tation algorithms by searching the optimal parame-
ters for each algorithm. He proposes an interesting
multi-loci hill climbing scheme on a coarsely sam-
pled parameter space. The segmentation system per-
formance is evaluated with respect to a given ground
truth. This approach is designed for the comparison
of algorithms and requires to test a large number of
different parameter settings. For this reason, the util-
ity of this approach for on-line parameter regulation
is less appropriate.
The remainder of the article is organised as fol-
lows. Section 2 describes the components of the self-
adaptive system architecture. The self-adaptive com-
ponents depend on a quality metric described in sec-
tion 3. Section 4 describes experiments in which we
test the self-adaptive capabilities of our system. We
finish with an overview and an outlook on how this
kind of system could be used in commercial applica-
tions.
2 ARCHITECTURE OF A
SELF-ADAPTIVE TRACKING
SYSTEM
In this section, we propose an architecture for a self-
adaptive tracking system. We first discuss the archi-
tecture and then describe the individual components.
Commercial use of automatic parameter tuning has
very strong requirements on the method. First, the
method should reduce user interaction to a minimum
and second, parameter tuning should not slow down
tracking of the master system. This architecture sepa-
rates the master system from the self-adaptive compo-
nent which makes it suited for an implementation on a
distributed system. The tracking system with the fast
monitoring component can run on one host and the
costly parameter tuning process can run on a second
host while the master system continues tracking.
2.1 Self-adaptive Systems
Robertson and Brady (Robertson and Brady, 1999)
propose an architecture for self-adaptive systems.
They consider an image analysis system as a closed-
loop control system that integrates knowledge in or-
Auto−critical
evaluation
module
Regulation
reference model
output
score
Robust tracker
Self−adaptive tracking system
Post processing
Control Component
optimized parameters
regulation
request
output
Supervisor
Target
detection
Robust
tracking
Figure 1: Architecture of a self-adaptive tracking system.
der to be self-evaluating. Measuring and comparing
the system output to the desired output and applying
a corrective force to the system leads to increased per-
formance. The difficult point is to generate a model of
the desired output. They demonstrate their approach
on the segmentation of aerial images using a bank of
different filter operators. The system selects automat-
ically the best filter for the current image conditions.
We follow this line of research and design a self-
adaptive system with a control component. The con-
trol component implements following abilities:
• Auto-critical evaluation: This means that the sys-
tem is able to judge its own performance.
• Auto-regulation of parameters: The ability to auto-
matically adapt the system’s parameters to the cur-
rent environmental conditions and ensure constant
performance.
2.2 System Architecture
Figure 1 shows the architecture of the self-adaptive
tracking system containing a tracking system and an
independent control component. The independence
of the control component allows to endow other types
of perceptual systems with self-adaptive capabilities
in a plug-and-play manner.
The above abilities of auto-critical evaluation and
auto-regulation are implemented as modules within
the control component. The output of the perceptual
system is monitored by the module for auto-critical
evaluation. Auto-regulation is triggered by an exter-
nal request from the post processing module. The
modules have access to a common knowledge base
that contains the reference model.
The structure and content of this knowledge base
is task dependent. This means that each system setup
requires a knowledge base with different structure and
different content. Section 3 explains in detail how this
knowledge base can be generated automatically in the
context of a robust tracking system.
2.3 Robust Real-time Tracking
This self-adaptive architecture is applied to a real-
time tracking system in a video surveillance scenario.
AN AUTOMATIC APPROACH FOR PARAMETER SELECTION IN SELF-ADAPTIVE TRACKING
21

The tracking system is composed of a central super-
visor that calls in a cycle the modules video demon,
automatic target detection and robust tracking. The
supervisor manages the list of current targets. The
tracking module provides robust tracking of the cur-
rent targets using a Kalman filter. The detection mod-
ule based on adaptive background differencing de-
tects new targets that are added to the target list. The
system can track up to 8 targets in images of 384×288
pixels at 30Hz on a 2 GHz processor.
The robust tracking system produces for each
frame t
i
and each target a vector (measurement) com-
posed of centroid and width and height of the target’s
bounding box y(t
i
)=(x
c
,y
c
,w,h)
T
. These vec-
tors are summarised in a log file in XML format. The
tracking result depends on a number of parameters
such as detection energy threshold (minimum target
size), noise threshold (pixel energy below this thresh-
old is considered as noise) and parameters that control
split and merge of targets. These parameters deter-
mine how close targets need to be for fusion or sepa-
ration. For further details on the system implementa-
tion see (Caporossi et al., 2004).
2.4 Auto-critical Evaluation
The goal of the auto-critical evaluation is to monitor
the performance of the system and detect performance
drops. This requires the definition of a measure that
estimates the goodness of trajectories (measurement
sequences) with respect to a reference model that is
constructed in a learning phase. Such a reference
model describes what usually happens in the scene.
An example of a different reference model is the se-
mantic scene model of Makris and Ellis in (Makris
and Ellis, 2003) where they learn entry and exit points
from examples and represent them as a Gaussian mix-
ture. Trajectories are represented by a topological
graph.
There is a wide range of different representation
forms of reference models. In addition to graphs and
Gaussian Mixture Models (GMMs), we want to name
histograms that often provide a good solution to con-
crete problems despite their simplicity. Probability
density approximations such as histograms or GMMs
have the advantage that a goodness score can be de-
fined easily based on statistical estimation.
All probabilistic reference models have in common
that they estimate the true probability density func-
tion (pdf) of measurements y =(x
c
,y
c
,w,h)
T
.For
example a pdf represented by a GMM can be ob-
tained by applying a standard learning approach such
as clustering to the training data and representing each
cluster by a Gaussian. In that case, the probability
density of a d dimensional measurement y is com-
puted by
p(y)=
K
j=1
p(y|C
j
)P (C
j
) (1)
p(y|C
j
)=p(y| µ
j
,U
j
)
=
1
(2π)
d/2
|U|
1/2
e
(−0.5(y− µ
j
)
T
U
−1
(y− µ
j
))
(2)
with µ
j
mean and U
j
covariance of Gaussian C
j
. The
priors P (C
j
) are estimated from the training data:
P (C
j
) ≈
|C
j
|
M
(3)
with |C
j
| number of data points associated to C
j
dur-
ing training and M total number of data points used
for training.
Equation 1 provides the probability density of sin-
gle measurements. To compute the quality of a tra-
jectory, we average the probability of the single mea-
surements. The goodness G
avg
(y(t)) of the trajectory
y(t)=(y
n
,...,y
0
) with length n +1is computed as
follows:
G
avg
(y(t)) =
1
n +1
n
i=0
p(y
i
) (4)
using eq 1 for computing p(y
i
). We have tested two
other goodness measures (see (Hall, 2005)), but the
simple averaging technique provided the best results.
This monitoring component is able to detect errors
and global performance drops automatically by eval-
uating the goodness score of the system output.
2.5 Automatic Parameter Regulation
The goal of the regulation module is to find a para-
meter setting that increases the system performance.
In the current implementation, this requires the sim-
ulation of tracking output using different parameter
settings. Depending on the number of tested parame-
ter settings, this task is time consuming. In a real-time
commercial application, the tracking application and
the parameter regulation can be run in parallel on a
distributed system.
The module architecture is illustrated in Figure 2.
Parameter regulation is started by a request from the
post processing module in cases where a performance
drop is detected. The request contains the current pa-
rameter setting and an image sequence composed of
the last k frames. The regulation tool searches now
for a parameter setting that has good performance on
this sample sequence. The parameter space explo-
ration tool provides new parameter settings. Feedback
of the goodness of previous parameter settings may be
used to guide the search. The tracking system simula-
tor simulates the output of the tracking system on the
sample sequence with these parameter settings.
VISAPP 2006 - IMAGE UNDERSTANDING
22

Parameter space
exploration tool
Robust tracker simulator
Regulation module
Regulation request with image sequence and current parameters
reference model
Auto−critical
evaluation
Supervisor
Target
detection
Robust
tracking
best
score
output
parameters
parameters
Image sequence
Figure 2: Architecture of the automatic parameter regula-
tion module.
The goodness score for the output is computed by
the auto-critical evaluation. Ideally, the parameter
regulation continues until it finds a parameter setting
that repairs the failure (this means that the perfor-
mance must exceed a predefined acceptance thresh-
old). In the experiments, auto-regulation of the pa-
rameters is performed on the entire sequence. The
current implementation tests a maximum number of
parameter settings and returns the one with the best
performance.
The parameter regulation module contains an in-
dependent module for parameter space exploration.
This allows to test different exploration strategies. We
tested an enumerative strategy and a strategy based on
a genetic algorithm. Gradient based methods or adap-
tive sampling as in (Min et al., 2004) could also be
used.
3 GENERATION OF A SCENE
REFERENCE MODEL
The scene reference model together with a quality
metric forms the knowledge base of the self-adaptive
system. It allows the system to judge the quality of
the system output and to select parameters that are
optimal with respect to this metric. The success of
the self-adaptive technique depends on the represen-
tativeness of this scene reference model and its metric.
As a consequence, model generation is an important
step within this approach.
With respect to commercial applications and the
fact that only a limited number of ground truth data
may be available for initialisation, we focus espe-
cially on model representation forms and learning
techniques that are incremental. Such techniques have
the great advantage, that they can be refined as more
data becomes available.
In this section, we explain different model gen-
eration methods. All methods operate on the same
4 dimensional training data of the form y =
(x
c
,y
c
,w,h)
T
and provide an estimation of the un-
derlying pdf.
3.1 Learning Methods for Model
Generation
We tested several incremental and non-incremental
methods for model generation from hand-labelled
training data. The most interesting methods for which
we show experimental results are:
• non incremental methods like kmeans with pruning
(KM-F) and EM with pruning (EM-F),
• incremental method based on a multi-dimensional
histogram Histo,
• the incremental method Histo-EM-F consists in
building a fine grain histogram, extracting a
weighted point for each non empty cell and then
performing EM with pruning on the extracted
points. The histogram serves to obtain an interme-
diate representation of the data and to reduce the
number of points considered for EM.
The current implementation requires hand labelled
data for model construction. In a future version, we
envision an iterative learning scheme that generates
an initial model from little hand labelled data (a few
trajectories). This model would then be used to filter
the output of the tracking system to obtain more cor-
rect data. An improved model would then be learnt
from the enhanced set of training data. Several iter-
ations of this scheme should produce a high quality
model.
In such an iterative learning scheme, an incremen-
tal model structure has several advantages. Incremen-
tal algorithms have the advantage of being able to re-
fine the model subsequently while new observations
arrive. Incremental models can incorporate very large
amounts of data, because training data from previous
iterations does not need to be stored. For this rea-
son, incremental learning schemes should be able to
produce higher quality models than non-incremental
learning schemes.
3.2 Reference Model Selection
The above methods have several parameters such as
the number of Gaussians in the GMM that can not be
determined a priori. A successful strategy for find-
ing a model of high quality is to generate a large set
of models by varying the parameters of the methods
and then selecting the best model with respect to some
quality criterion. We propose to use a quality criterion
based on the probability of classification error with re-
spect to a validation set of positive and negative mea-
surements. Section 4 describes how such a validation
set can be acquired.
AN AUTOMATIC APPROACH FOR PARAMETER SELECTION IN SELF-ADAPTIVE TRACKING
23
For each model, a classifier is built by selecting a
threshold on the probability density p(y) of the mea-
surements y. Given the validations sets Posand Neg
of positive and negative examples, the threshold is
chosen automatically as the value that minimise the
probability of classification error:
P
err
=
1
|Pos| + |Neg|
min
th
⎛
⎝
p∈Pos
δ
pdf(p)<th
+
n∈Neg
δ
pdf(n)≥th
⎞
⎠
(5)
where δ is the Kronecker symbol. The least complex
model with a P
err
value below an acceptance thresh-
old is said to have the best quality. This quality mea-
sure based on P
err
is an efficient way of selecting the
model.
The complexity of a model is related to the num-
ber of Gaussians or the the number of histogram cells
(depending on the representation). Selecting the least
complex model that fulfils an acceptance threshold
is a regularisation method that avoids over fitting.
The acceptance threshold is determined experimen-
tally (see Section 4).
4 EXPERIMENTAL EVALUATION
In the experiments we want to demonstrate three
points: i) the quality of the automatic parameter selec-
tion, ii) the performance increase of tracking by auto-
regulation of parameters compared to manual parame-
ter tuning and iii) the link between the model quality
measure P
err
and the system performance.
4.1 Performance Evaluation
For measuring the performance of our tracking sys-
tem, we measure recall and precision. These val-
ues are computed by a statistics tool that operates on
XML description of the bounding boxes of the de-
tected targets and of the manually annotated targets.
The statistics tool determines for each frame the best
matching pairs with respect to overlap of detected and
ground truth boxes. For a particular overlap thresh-
old T , the tool evaluates the number of true positives
(TP), false positives (FP) and false negatives (FN).
Recall =
TP
TP + FN
Precision =
TP
TP + FP
(6)
The overlap of two bounding boxes is computed by:
O(A
obs
,A
truth
)=
λ {A
obs
∩ A
truth
}
λ {A
obs
∪ A
truth
}
(7)
where λ {...} represents the surface (Lebesgue mea-
sure in dimension 2) and A the bounding box.
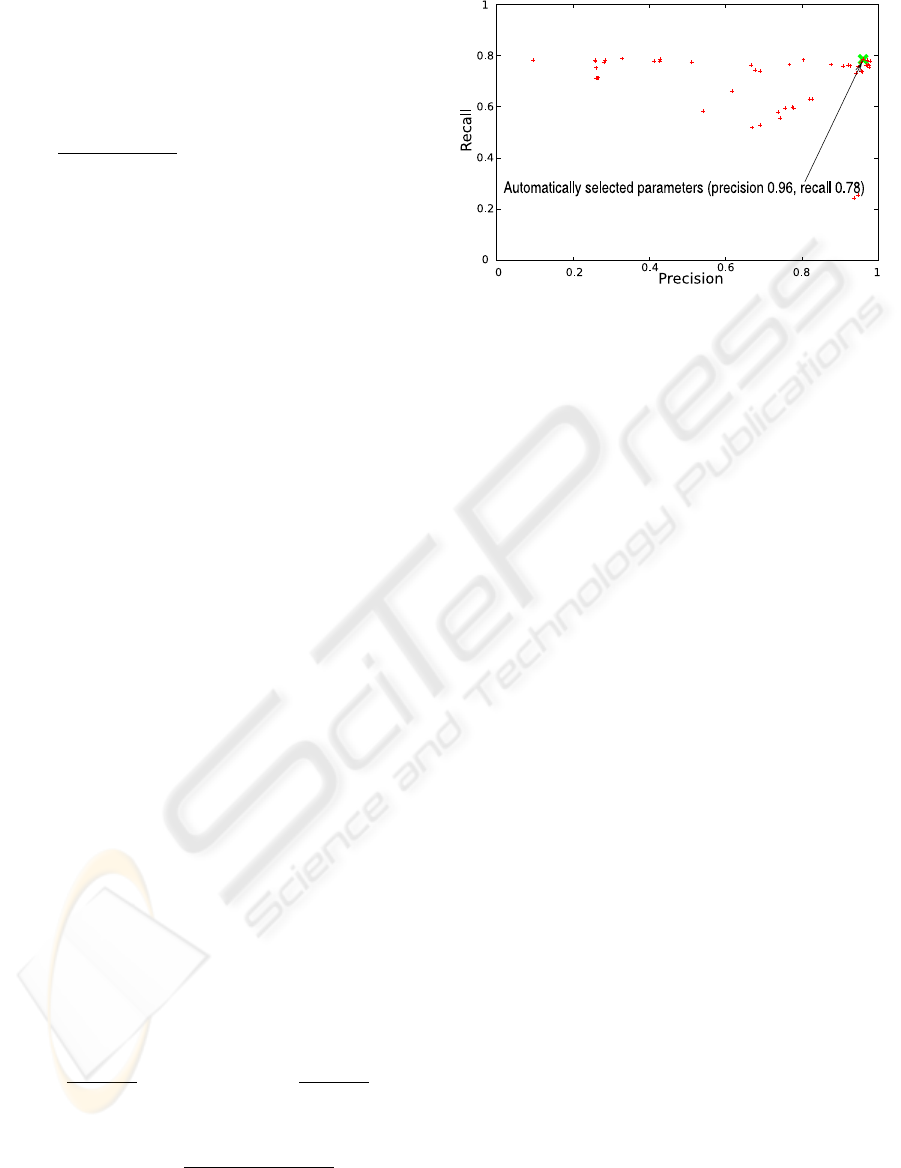
Figure 3: Evaluation of the quality of automatically selected
parameters. Our automatic approach selects a parameter
setting among those with best performance.
In addition we compute the area under the curve
(AUC) for Recall and Precision as in (Min et al.,
2004). The AUC is a comparison measure that is in-
dependent of a particular overlap threshold. A perfect
system would have AUC of 1.0.
4.2 Results and Interpretation
The experiments are evaluated on public benchmark
data (Fisher, 2004). These are 27 video sequences
with hand labelled ground truth data. We divided
this set in 13 sequences for training (18411 bounding
boxes) and 14 sequences for testing (21217 boxes).
Quality of the automatic parameter regulation
This experiment gives insight in the quality of the au-
tomatically selected parameter setting using our ap-
proach. For given sequence, our approach selects
a parameter setting using a search strategy by a ge-
netic algorithm. For parameter selection we use
the generated scene reference model with the metric
G
avg
(y(t)). This parameter setting is then used to
generate an output in XML format. The statistics tool
provides values for recall and precision for an over-
lap threshold of T =0.5. This recall/precision pair
is represented as a point in the precision recall plot of
Figure 3.
To demonstrate the quality of this result, we com-
pare it to the precision recall values of a large number
of different parameter settings (all parameter settings
that are selected by the genetic algorithm, 3 genera-
tions of 20 individuals). Figure 3 shows clearly, that
the automatically selected parameter setting is among
the settings with the best performance. For other se-
quences we observe a similar behaviour.
Performance increase by auto-regulation
We measure the performance of the tracking system
VISAPP 2006 - IMAGE UNDERSTANDING
24

Table 1: Performance (on 14 sequences) of self-adaptive
tracking and benchmarks.
Method AUC
recall
AUC
precision
Manual tuning 0.429 0.532
(on 6 sequences)
Auto-regulation 0.437 0.629
using KM-F (batch)
Auto-regulation 0.431 0.648
using Histo-EM-F
No regulation 0.414 0.391
(low thresholds)
No regulation 0.243 0.426
(high thresholds)
by evaluating the output of the system that uses the
parameter setting chosen by the auto-regulation algo-
rithm. Table 1 shows the results of the different meth-
ods on the 14 test sequences. The auto-regulation
methods are compared to three benchmarks. The up-
per benchmark is our tracking system with manually
tuned parameters. We only have the results for 6 test
sequences due to the tedious manual task. The lower
benchmarks are provided by using static parameter
settings for all test sequences. Low thresholds give
good recall but bad precision, high thresholds give
bad recall and bad precision.
We compare the auto-regulation method using a
batch model KM-F and the best performing incremen-
tal method Histo-EM-F. The KM-F model is obtained
using a KMeans clustering with 1000 initial clusters
that are subsequently merged. All clustering solutions
from 100 to 5 clusters are transformed to a GMM.
The model obtained by the method Histo-EM-F uses
a fine grain histogram for initialisation of EM. The
Gaussians computed by EM are subsequently merged
to provide a fusion tree. In both methods, we choose
the least complex model with a P
err
value below the
acceptance threshold of 5% (see paragraph below).
The incremental model and the batch model both
match the performance of a manually tuned system
(although the manually tuned system is evaluated only
on 6 sequences, the AUC values give an idea of the
performance range). The increase in performance us-
ing automatic parameter regulation with respect to us-
ing no regulation is demonstrated clearly by the com-
parison to the lower benchmark performance. An-
other important result is that no significant differ-
ence can be noted between the incremental and non-
incremental model. This motivates the use of incre-
mental models in the future due to their ability of fur-
ther refinement with additional data.
Link between P
err
and tracking performance
In section 3.2 we proposed a measure for model se-
lection based on the probability of classification er-
ror. This is a convenient and fast measure for model
selection. The definition and validation of such a fast
quality measure makes possible the automatic gener-
ation and selection of a scene reference model in a
non-supervised commercial tracking application. For
validation of this measure, we need to show the rela-
tion between P
err
and the tracking performance.
We perform following experiment. 4 sequences are
selected among the test sequences with different de-
gree of difficulty (1 easy, 2 intermediate and 1 hard).
We compute the P
err
scores for a family of mod-
els extracted from different levels of the fusion tree
produced by the GNGN-EM-F approach (a growing
neural gas network (Fritzke, 1995) is used for initial-
isation of EM with fusion). P
err
requires the selec-
tion of a representative set of positive and negative
examples. The positive examples are composed of 7
trajectories of the most common paths of the scene
(2420 measurements). The negative examples are ob-
tained by monitoring the tracking output and collect-
ing tracking errors (1997 measurements). Each model
is then used for auto-regulation of parameters. The
XML output of the tracking system using the selected
parameter setting is evaluated and the AUC values of
precision and recall are computed.
Table 2 shows these results. The results confirm the
relation between the P
err
value and the global per-
formance of the system using auto-regulation. Small
P
err
values (good model quality) yield good track-
ing performance (high precision and high recall). The
results show also that no further improvement is ob-
served for P
err
values below 5%. We observed a sim-
ilar behaviour for model families obtained by other
learning approaches. The performance stabilises for
P
err
values below 5%. As a consequence, in this par-
ticular system setup, a model with a P
err
value below
5% is appropriate for parameter regulation.
5 CONCLUSION AND OUTLOOK
We described an architecture for a self-adaptive
tracking system that uses a control component to
implement the abilities of auto-criticism and auto-
regulation. Both modules require a metric with re-
spect to a reference model. Our approach allows to
automatically generate and select such a reference
model with good quality without human supervision.
The quality of the model is determined by a fast eval-
uation measure based on the classification error with
respect to a validation data set.
The experiments show that a tracking system with
auto-regulation of parameters has the same or better
performance than a tracking system with manually
tuned parameters. We also demonstrate that our au-
tomatic parameter selection scheme selects parame-
ter settings with very high performance. The exper-
AN AUTOMATIC APPROACH FOR PARAMETER SELECTION IN SELF-ADAPTIVE TRACKING
25
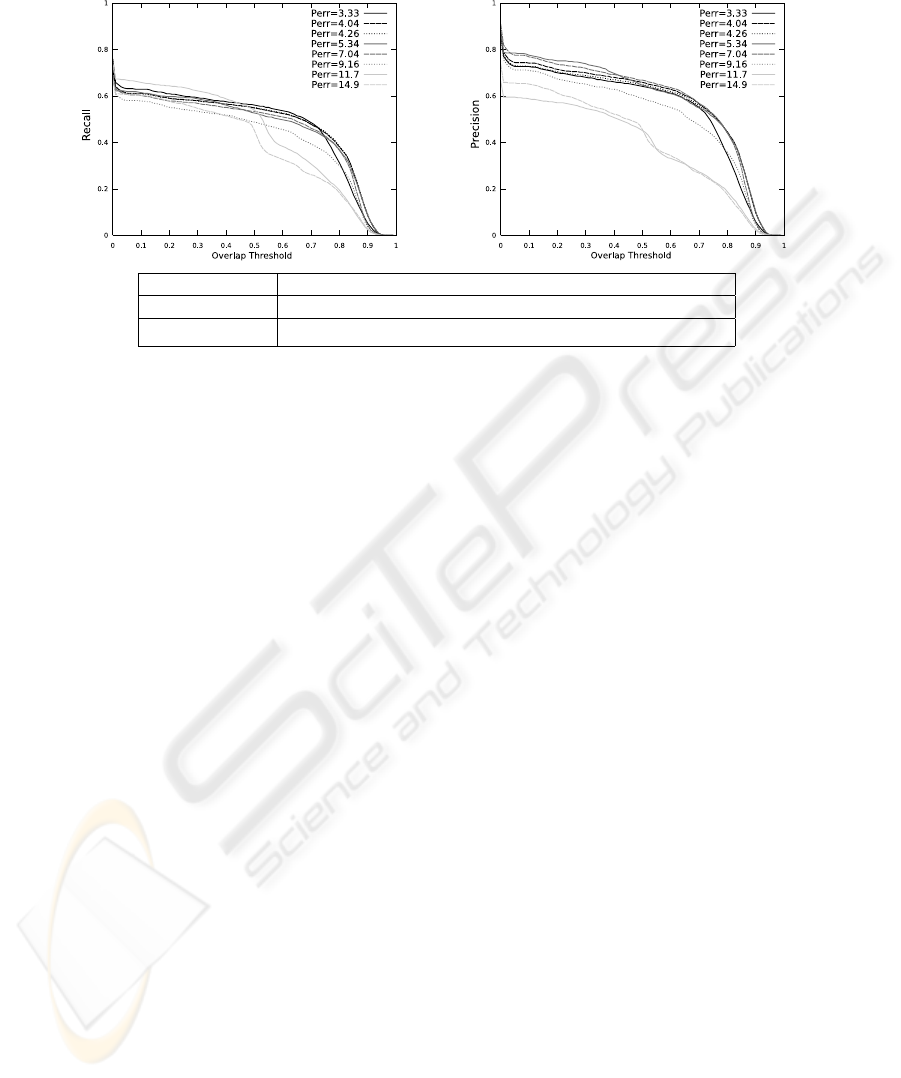
Table 2: Performance (evaluated on 4 sequences) of self-adaptive system using incremental models with increasing P
err
.
Performance degrades as P
err
increases.
P
err
(in %) 3.33 4.04 4.26 5.34 7.04 9.16 11.7 14.9
AUC
recall
0.47 0.47 0.47 0.46 0.45 0.40 0.44 0.38
AUC
precision
0.52 0.56 0.55 0.58 0.58 0.48 0.29 0.39
iments validate the fast evaluation measure P
err
on
example sequences.
With respect to a future integration in a commer-
cial tracking system, the result that incremental model
generation produces equal results than batch model
generation is important. Incremental learning tech-
niques have the advantage that they allow subsequent
refinement of the reference model without the need
of storing all training data. This is a great advan-
tage with respect to direct learning methods such as
k-means clustering or EM whose computational com-
plexity depends on the total number training data. The
data required for a model with very good quality may
reach quickly the upper limit of memory space and
available computation time.
The next step of our work consists in developing
a prototype that can be used for an automatic in-
stallation of a self-adaptive tracking system in a new
site. The here proposed technique is fully automatic
once the ground truth data is acquired. Hand-labelling
ground truth may be replaced by a robust and reli-
able tracker using colour information. An initialisa-
tion phase would require the cooperation of several
actors wearing coloured suits. 10 minutes of acting
provides 18000 frames of example data which are suf-
ficient for a scene reference model of a lobby with
several entries and unconstrained walking paths. Fol-
lowing these steps, a scene reference model for a new
video surveillance site can be generated automatically
using the here proposed approach.
REFERENCES
Caporossi, A., Hall, D., Reignier, P., and Crowley, J.
(2004). Robust visual tracking from dynamic control
of processing. In International Workshop on Perfor-
mance Evaluation of Tracking anS
.
urveillance, pages
23–31.
Fisher, R. (2004). The PETS04 surveillance ground-truth
data sets. In International Workshop on Performance
Evaluation of Tracking anS
.
urveillance.
Fritzke, B. (1995). A growing neural gas network learns
topologies. In Tesauro, G., Touretzky, D., and Leen,
T., editors, Advances in Neural Information Process-
ing Systems, volume 7, pages 625–632. MIT Press,
Cambridge, MA, USA.
Hall, D. (2005). Automatic parameter regulation for a track-
ing system with an auto-critical function. In Inter-
national Workshop on Computer Architecture for Ma-
chine Perception, pages 39–45.
Makris, D. and Ellis, T. (2003). Automatic learning of an
activity-based semantic scene model. In International
Conference on Advanced Video and Signal Based Sur-
veillance, pages 183–188.
Min, J., Powell, M., and Bowyer, K. (2004). Automated
performance evaluation of range image segmentation
algorithms. IEEE Transactions on Systems Man and
Cybernetics, 34(1):263–271.
Murino, V., Foresti, G., and Regazzoni, C. (1996). A dis-
tributed probabilistic system for adaptive regulation of
image processing parameters. IEEE Transactions on
systems, man, and cybernetics, 26(1):1–20.
Robertson, P. and Brady, J. (1999). Adaptive image analy-
sis for aerial surveillance. IEEE Intelligent Systems,
14(3):30–36.
Scotti, G., Marcenaro, L., and Regazzoni, C. (2003). A
s.o.m. based algorithm for video surveillance system
parameter optimal selection. In IEEE Conference on
Advanced Video and Signal Based Surveillance.
VISAPP 2006 - IMAGE UNDERSTANDING
26
