
COMPARING YEAST CELLS SEGMENTATION THROUGH
HIERARCHICAL TREES
Marco Antonio Garcia de Carvalho
Universidade Estadual de Campinas - UNICAMP
Rua Paschoal Marmo, 1888, Jd. Nova Itlia, 13484-370, Limeira/SP - Brazil
Tiago Willian Pinto
Universidade Estadual de Campinas - UNICAMP
Rua Paschoal Marmo, 1888, Jd. Nova Itlia, 13484-370, Limeira/SP - Brazil
Keywords:
Image segmentation, Hierarchical analysis, yeast cells, Mathematical Morphology, tree representation.
Abstract:
Image filtering and segmentation consists of se parating an image into regions according to some criteria and
to the application finality. Recent publications in the image processing domain make use of a segmentation
strategy called multiscale or hierarchical segmentation. The multiscale segmentation provides a family of
partitions of an image, presenting it at several levels of resolution. This work studies a multiscale image
representation called Tree of the Critical Lakes (TCL), that provides an set of nested partitions of an image.
The Tree of the Critical Lakes is defined from the Watershed Transform, the traditional tool of Mathematical
Morphology in image segmentation operations. Moreover, we implement a comparison between TCL and
another way of image representation, called Component Tree (CT). The CT consists of a set of cross-sections
images and its connected components, linked thanks to the inclusion relation. We show experiments of image
segmentation, based on TCLs and CTs, for a group of yeast cells images.
1 INTRODUCTION
Recent segmentation methods tend to consider the
hierarchical structure of images in object oriented
analysis, segmentation and coding. A hierarchy al-
lows the utilization of both the superficial and the
deep image structure (set of possible regions and con-
tours).
In this work we exploit two graph structures know
as Tree of Critical Lakes (TCL) and Component Tree
(CT) in order to implement yeast image segmentation.
The Watershed Transform is used to build the TCL
which provides a set of nested partitions of the image.
Yeast characterization by image analysis methods
(O´Shea and Walsh, 2000)-(Pons et al., 1993) has
been developed aiming at segmenting and classify-
ing cells in an automatic or semi-automatic way. The
knowledge of yeast features is important to several
chemical processes. We exploit geometric and hier-
archical properties of all nodes of the Tree of Critical
Lakes, such as survival time, ellipse fitting criterion
and region attributes, in order to discriminate yeast
cells(Carvalho, 2004).
On the other hand, we implemented comparisons
with the Component Tree. The CT is a structure
builded from the thresholding process of an image,
that consists of computing the cross-sections of an im-
age, for each grey level. In the following, the link
between connected components at each cross-section
is stablished. Several authors have used this repre-
sentation to implement some morphological operators
(Najman and Couprie, 2004), image filtering (Jonnes,
1997) and image matching (Mattes et al., 1999).
The paper is organized as follows. First, we show
in Section 2 some graphs concepts and definitions.
Section 3 presents how we create a scale-space rep-
resented by the Tree of Critical Lakes. Section 4 is
devoted to present the Component Tree and the image
filtering process. Experimental results of the yeast
segmentation by TCL and CT were compared and are
shown in Section 5. Finally, the conclusions and fu-
ture works are presented in 6.
2 GRAPH DEFINITION
Let G = (V, E) be a non-directed graph where V is
the set of nodes or vertices and E is the set of edges
(i, j), for i, j ∈ V . A weighted graph is a graph where
a number (weight) is associated to each edge (i, j),
represented by w (i, j). A path from i
1
to i
n
is a list
(i
1
, i
2
, . . . i
n−1
, i
n
) where i
k
∼ i
k+1
, k = 1, . . . , n-1.
Two nodes i and j are connected if there is at least one
515
Antonio Garcia de Carvalho M. and Willian Pinto T. (2006).
COMPARING YEAST CELLS SEGMENTATION THROUGH HIERARCHICAL TREES.
In Proceedings of the First International Conference on Computer Vision Theory and Applications, pages 515-518
DOI: 10.5220/0001371505150518
Copyright
c
SciTePress
path between i and j. A connected graph G is a graph
where all pair of nodes is connected. Let G
1
be a sub-
graph of G. A connected component CC of G
1
that
contains one node i is the union of all paths in G
1
that
originate on i. A tree is a connected graph with no
cycles. A Minimum Spanning Tree (MST) is a tree
that contains all nodes of G and such that the sum of
edge weights is minimal.
3 TCL REPRESENTATION
The classical technique in morphological segmenta-
tion is the Watershed Transform (WT). We summa-
rize in the following the main concepts of watershed.
For a more complete review of watershed variations,
we refer the reader to (Beucher and Meyer, 1993).
3.1 Watershed Transform
We consider the gradient image f as a topographic
surface. An image is segmented by constructing the
catchment basins of its gradient image, as shown in
Figure 1. The gradient image is flooded starting from
selected sources (regional minima) until the whole
image has been flooded. A dam is erected between
lakes that meet with others lakes. At the end of flood-
ing process, we obtain one region for each catchment
basin of the gradient image.
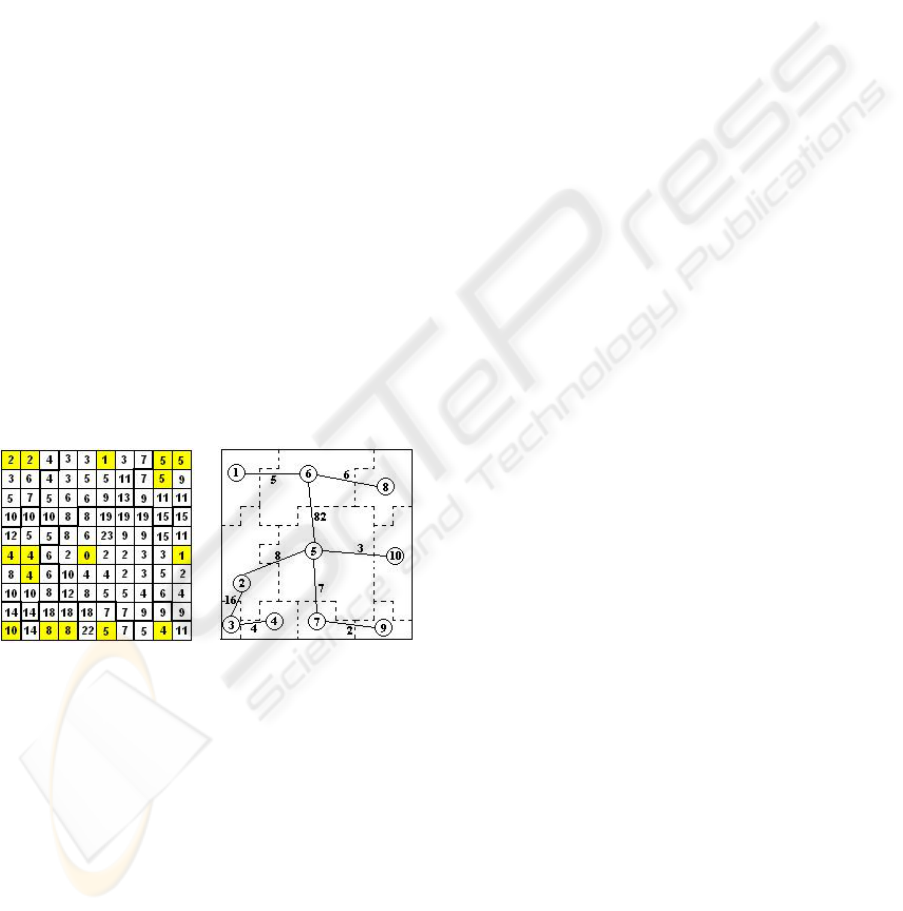
(a) (b)
Figure 1: (a) Original gradient image; the markers are the
regional minima, in gray; the dashed lines separate the wa-
tershed basins. (b) MST of the image (a); the valuation of
the edges corresponds to the volumetric extinction value.
Hierarchical watershed creates a set of nested par-
titions. A partition P of an image f is a set of disjoint
regions R
i
, i = 1, 2 . . . , n, where the union of re-
gions is the whole image. Let (P
k
) be a sequence of
partitions P
1
, P
2
, . . . , P
n
, of an image f. (P
k
) is a hi-
erarchy, also called nested sequence of partitions, if a
partition at a fine level is obtained by merging regions
of the coarse partition.
The watershed problem can be modeled using
graphs. The gradient image is represented by a
weighted neighborhood graph, where: (i) a node rep-
resents a catchment basin of the topographic surface;
(ii) an edge links two nodes if their corresponding
catchment basins are neighbors (in the sense of a pixel
neighborhood); (iii) edge’s weights are given by the
lowest altitude of pass point separating two catch-
ments basins.
The set of all edges (dams) where merging of dif-
ferent original lakes occur constitutes a minimum
spanning tree (MST) of the weighted neighborhood
graph(Meyer and Maragos, 1999). Although the re-
gions merging were controlled by the altitude of topo-
graphic relief, the evaluation of the levels at which
partitions are formed can be performed based on
another value, called the extinction value (Vachier,
1995). We utilize the volumetric extinction value.
Figure 1(b) show the MST of the artificial image pre-
sented in Figure 1(a).
3.2 Creation of a Scale-space
The TCL is a morphological representation obtained
from Watershed Transform and provides the order of
the fusion regions. Due to its hierarchical properties,
the TCL has the potential to build a family of nested
partitions. The initial partition P
n
is the labeled image
provided by the Watershed. The other partitions are
formed by agglomerating two-by-two regions (Car-
valho, 2004).
Frequently, the TCL is build from Minimum Span-
ning Tree (MST) of the image. Details of the algo-
rithms concerning the MST and the TCL transforma-
tion can be found in (Meyer and Maragos, 1999) and
(Meyer and Maragos, 1996), respectively.
3.3 Scale-space Analysis
We use some properties of the TCL hierarchical rep-
resentation, in addition to general attributes, in order
to segment yeast cell images. The segmentation al-
gorithm can be summarized by the following 3 steps
(Carvalho, 2004): Scale-space creation; Computa-
tion of attributes; and, Hierarchical analysis (Start the
segmentation analysis by the Survival Time criterion;
after, apply the area criterion to eliminate nodes close
to the TCL root; Finally, apply the other criteria, as
ellipse fitting (Fitzgibbon et al., 1999), region circu-
larity and gray level mean).
4 CT REPRESENTATION
4.1 Definition
The component tree is a representation of a grayscale
image based on the cross-section decomposition
VISAPP 2006 - IMAGE ANALYSIS
516
between the minimum and maximum grey lev-
els(Najman and Couprie, 2004). There exists links
between components at sequential grey levels in the
image. A component is defined as:
F
k
= {x ∈ F/F (x) ≥ k} (1)
where F is an image and F
k
is a section k (level) of
F . The Connected Components (CC) of the different
cross-sections may be organized in order to form a
tree structure. We say that the two CCs C
k+1
and C
k
are linked when C
k+1
is a subset of C
k
(the inclusion
relation). The first component C
1
(or C
min
) in the
image corresponds to the whole image domain and its
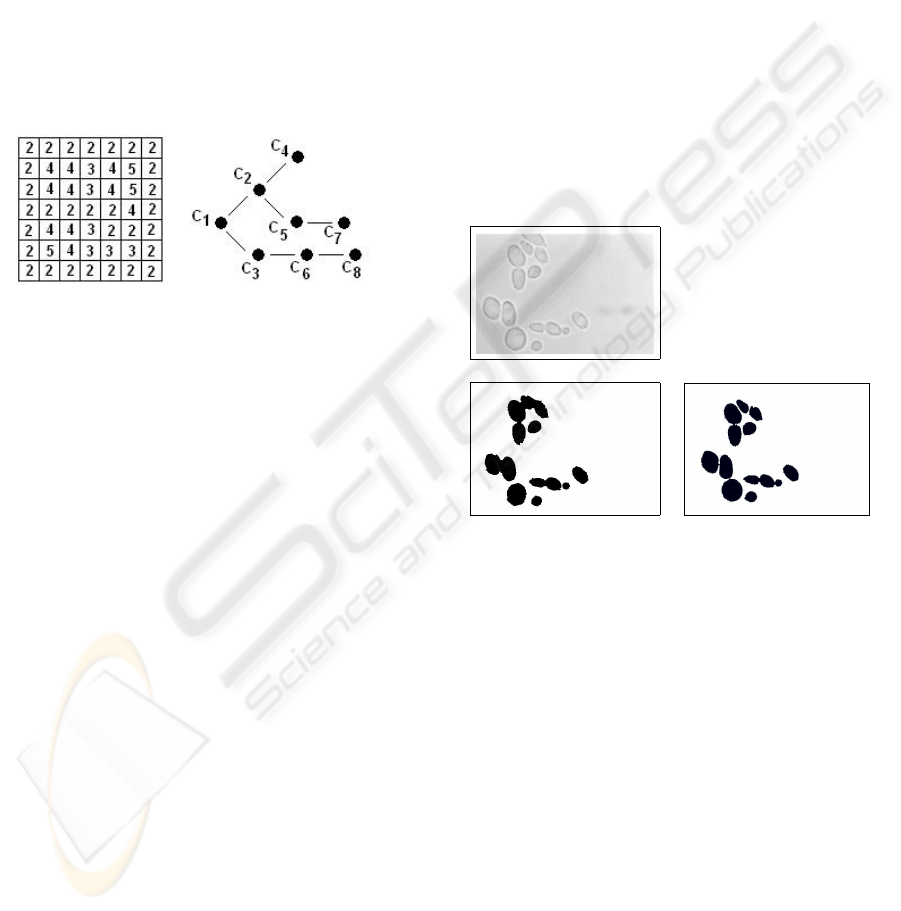
called root. Figure 2(b) shows the CT of the grayscale
image depicted in Figure 2(a).
(a) (b)
Figure 2: (a) The Component Tree of the grayscale image
of (b).
We can associate number to the CT nodes, which
measure some of the components features, such as:
mean graylevel of the component; mininum and max-
imum greylevel values; area; perimeter; and, the im-
age location of one representative pixel.
4.2 Filtering
Filtering the component tree is a decision-make
process which classified nodes into those that are ac-
tive (preserved) and those that are not (Jonnes, 1997).
A grey-level image is decomposed into a stack of bi-
nary images, which are processed individually by a
filter. When we re-stack these images, we have ob-
tained a grey-level filter and the segmented image is
obtained directly from the filtered image. The filter-
ing algorithm can be summarized by the following 3
steps:
1. Tree computation – Compute the corresponding CT
for the image.
2. Computation of attributes – For all CT cross-
sections, compute the attributes area and grey level
mean that will be used in the segmentation analy-
sis.
3. Hierarchical analysis – Start the segmentation
analysis by the grey level criterion. Then, apply
the area criterion.
5 EXPERIMENTS
We present some results of yeast segmentation by
analysis of its hierarchy. Other results and analysis
are found in (Carvalho, 2004). The images were ob-
tained from School of Food Engineering (FEA - Fac-
uldade de Engenharia de Alimentos) at UNICAMP.
In all results we eliminate the objects that touch the
image frame. No markers are used in this approach.
Also, we use ST (survival time), area, ellipse fitting
and gray level mean criteria in TCL analysis. The
yeast segmentation based on CT filtering has accom-
plished by the utilization of grey-level mean and area
parameters of each component connected of the im-
age. All experiments are implemented in MATLAB.
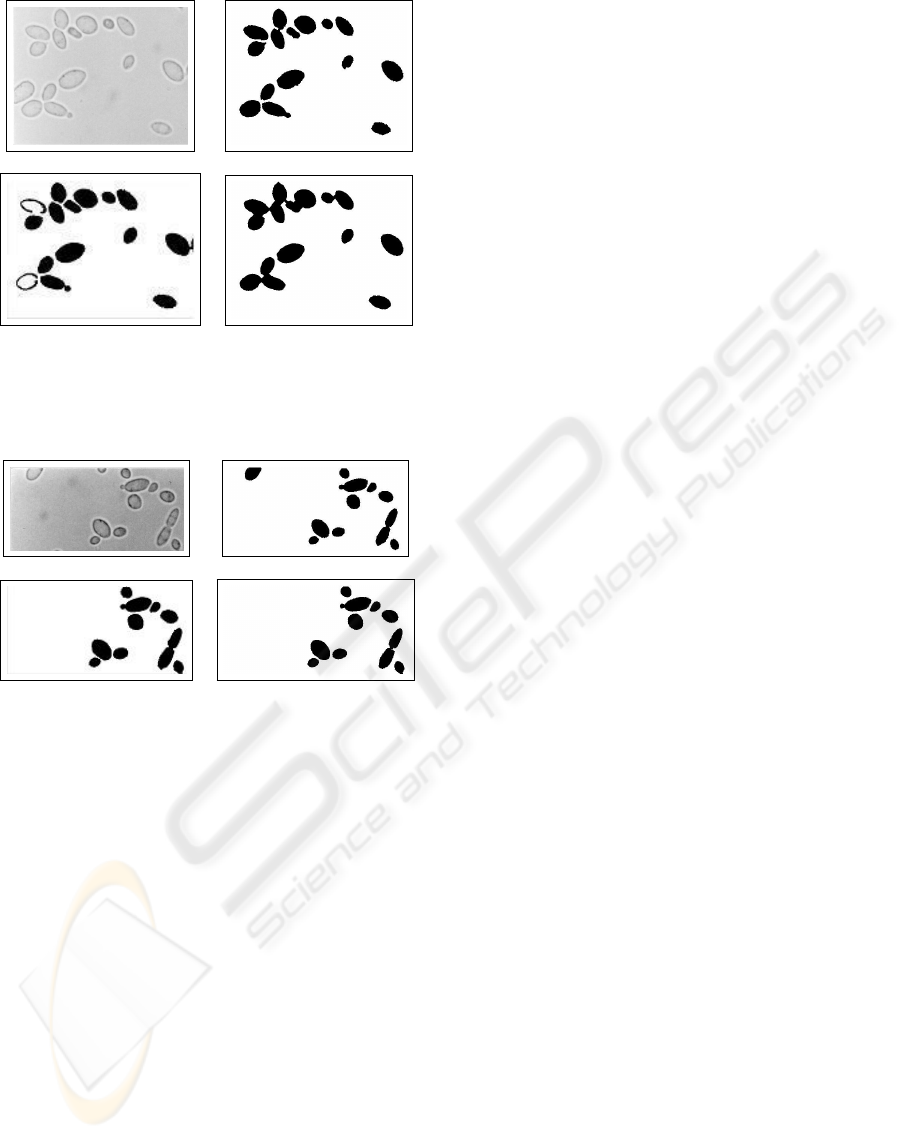
Figure 3 show an example of the yeast segmenta-
tion obtained from CT and TCL analysis. A detailed
observation of these images show that there are small
differences at border and connectivity between cells.
(a)
(b) (c)
Figure 3: (a) original image; (b) yeast segmentation by TCL
analysis; (c) yeast segmentation by CT analysis.
Figure 4 illustrates the comparison between three
different approachs in order to segment yeast cells.
Figure 4(d) show the segmented image of Figure 4(a),
obtained from O´Shea analysis (O´Shea and Walsh,
2000). In this case, it was necessary some morpholog-
ical operations (dilation, closing hole and erosion) in
order to remove some noises (regions not associated
to yeast cells) in the processed image. As we can see,
there are great differences between resulting images.
The main problems are the contour preservation, the
cells holes and the connectivity between cells. The
TCL approach, based on Watershed Transform, pre-
serve the cells contours; also, there is no holes.
Figure 5 show an last example of the yeast segmen-
tation obtained from TCL, CT and O´Shea analysis.
Comparison shows that the method based on TCL
representation preserves the yeast contours and pro-
vides cells area 10%, approximately, lower than CT
and O´Shea methods.
COMPARING YEAST CELLS SEGMENTATION THROUGH HIERARCHICAL TREES
517
(a) (b)
(c) (d)
Figure 4: (a) original image; (b) yeast segmentation by TCL
analysis; (c) yeast segmentation by CT analysis; (d)yeast
segmentation by O´Shea (O´Shea and Walsh, 2000) after
morphological operations.
(a) (b)
(c) (d)
Figure 5: (a) original image; (b) yeast segmentation by TCL
analysis; (c) yeast segmentation by CT analysis; (d)yeast
segmentation by O´Shea (O´Shea and Walsh, 2000) after
morphological operations.
6 CONCLUSION
In this paper we presented an analysis based on tree repre-
sentation in order to segment yeast cells. We implemented
two approachs based on image representation by Tree of
Critical Lakes and Component Tree.
The results of the multiscale analysis for a group of yeast
images were satisfactory and demonstrated the robustness
of the method, even using few criteria. Usually, the clas-
sical Watershed is not able to segment correctly this type
of images, due to the lack of markers and also to the su-
persegmentation problem. Scale-space analysis is usually a
costly computational task. In the future, we will try to start
from coarser image partitions in order to reduce the range
of the computational analysis. Also, experiments was done
to segment yeast cells based on Component Tree filtering.
The filter parameters used in this work were area and grey
level mean.
The investigations into the complexity of CT or TCL
computation algorithms are necessary in order to enhance
the efficacy of the performance. Finally, experiments will
be done to classify yeast cells according to the taxonomy
presented by O´Shea (O´Shea and Walsh, 2000).
ACKNOWLEDGEMENTS
Tiago W. Pinto is grateful to FAPESP for the financial sup-
port.
REFERENCES
Beucher, S. and Meyer, F. (1993). The morphological ap-
proach to segmentation: The watershed transforma-
tion. In Mathematical Morphology in Image Process-
ing, chapter 12. E. Dougherty, editor.
Carvalho, M. A. G. (2004). Hierarchical image analy-
sis through the tree of critical lakes (in portuguese).
In PhD Thesis, Electrical and Computer Engineering
Faculty, University of Campinas – UNICAMP, Brazil.
Fitzgibbon, A. W., Pilu, M., and Fisher, R. B. (1999). Direct
least squares fitting of ellipses. In IEEE Transactions
on Pattern Analysis and Machine Intelligence.
Jonnes, R. (1997). Attributes signatures for connected fil-
tering and segmentation. In Digital image and vision
computing:Techniques and aaplications. R. Chaplin
and W. Page (eds).
Mattes, J., Richard, M., and Demongeot, J. (1999). Tree
representation for image matching and object recog-
nition. In 8th International Conference on Discrete
Geometry for Computer Imagery. Springer.
Meyer, F. and Maragos, P. (1996). The dynamics of minima
and contours. In P. Maragos, R. W. Schafer and M. A.
Butt Editors, Mathematical Morphology and its Appli-
cations to Image and Signal Processing, pp.329-336.
Kluwer Academic Publishers.
Meyer, F. and Maragos, P. (1999). Multiscale morpholog-
ical segmentations based on watershed, flooding and
eikonal pde. In Scale-Space Theory in Computer Vi-
sion, Second International Conference.
Najman, L. and Couprie, M. (2004). Quasi linear algorithm
for the component tree. In SPIE Vision Geometry.
O´Shea, D. G. and Walsh, P. K. (2000). The effect of the
culture conditions on the morphology of the dimor-
phic yeast Kluyveromyces marxianus var. marxianus
nrrly2415: a study incorporating image analysis. In
Applied Microbiology and Biotechnology.
Pons, M. N., Vivier, H., Rmy, J. F., and Dodds, J. A.
(1993). Morphological characterization of yeast by
image analysis. In Biotechnology and Bioengineer-
ing.
Vachier, C. (1995). Extraction de caracteristiques, segmen-
tation d´image et morphologie math
´
ematique. In PhD
Thesis, Centre de Morphologie Mathmatique, cole de
Mines de Paris, France.
VISAPP 2006 - IMAGE ANALYSIS
518
