
PROBABILITY ANALYSIS IN ART CONSERVATION
Vassiliki Kokla, Alexandra Psarrou, Vassilis Konstantinou
University of Westminster
Harrow School of Computer Science
Watford Road, Harrow HA1 3TP, UK
Keywords:
Ink analysis, semi-transparent pigments, image-based art conservation.
Abstract:
Analysis of manuscript inks is very important because it gives information on the authenticity and the dating
of manuscripts. Inks are semi-transparent pigments which are very difficult to discriminate because of the
influence of the support on which they are often found. For this reason ink is often examined using destructive
techniques of analysis. However, in the case of old manuscript inks it is frequently impossible to apply
destructive techniques for their analysis because of the historical and cultural value of manuscripts. Statistical
analysis offers the best opportunity for developing effective solutions on the non-destructive characterization
of manuscript inks. In this paper we present a novel method for the ink recognition problems that is based
on the optical ink information represented through a mixture of Gaussian functions so as the ink classification
using the Bayes’ decision rule can be feasible.
1 INTRODUCTION
Depending on the chemical composition and the dat-
ing and location of manufacturing of manuscripts,
inks can contain organic or inorganic materials or
both. The analysis of manuscript inks is diffi-
cult whether destructive methods of analysis or non-
destructive methods of analysis are used. This is be-
cause during scripting only a small amount of ink has
been used on the manuscripts. Destructive and non-
destructive methods of analysis need to use a sample
of the ink taken from the manuscripts. This in many
cases is not possible as it would mean the loss of
significant writings from the manuscripts concerned
(DePas, 1975). Reflectography and spectroscopy are
two methods that do not need sampling and are more
suitable for the analysis of manuscripts inks (Fletcher,
1984). However, ink recognition through these meth-
ods is also difficult because the ink characterization
is influenced from the support on which it is found.
Therefore the combination of reflectographical meth-
ods with the statistical image analysis could find so-
lutions to the ink recognition problems and could be
used in many cases of valuable manuscripts. Most of
the image-based research in inks and pigments found
in artifacts is focused in the generation rather than
analysis and are mainly applied in the restoration of
colors in paintings (Pappas and Pitas, 2000). Alterna-
tively research in machine vision is carried out in the
analysis and modelling of color and mainly focused
on the visual retrieval of information in digital image
libraries (Smith and Chang, 1996).
The aim of this study is to create a methodol-
ogy which could be applied in situ without sampling
and classify the optical features through image-based
techniques so as the discrimination of varying types of
inks is achieved. Inks, however, are semi-transparent
pigments and difficult to characterize because their in-
tensity depends on the amount of liquid spread during
scripting and the reflective properties of the support.
In this work we show that manuscript inks can be rep-
resented through a mixture of Gaussian functions and
can be classified by their intensity in the visible and
infrared area of spectrum based on Bayes’ decision
rule.
In the remaining of this paper, in Section 2 we give
a short description of the composition of inks that
were used during this study and present the model
and test images used during the experiments of this
study. In Section 3 we present some of our results in
the classification of manuscript inks before we con-
clude in Section 4.
508
Kokla V., Psarrou A. and Konstantinou V. (2006).
PROBABILITY ANALYSIS IN ART CONSERVATION.
In Proceedings of the First International Conference on Computer Vision Theory and Applications, pages 508-514
DOI: 10.5220/0001368005080514
Copyright
c
SciTePress
2 BACKGROUND
Inks used in old manuscripts for the body of text are
mainly black, brown or brown-black. The identify-
ing term ”brown ink” is commonly used in the cata-
loging of these types of inks in museums and libraries.
This broad descriptive term does little to indicate the
richness or variety of the inks which fall within this
category. The two common ”brown” writing fluids
were composed of either carbon or metalgall (Bar-
row, 1972). The carbon inks were composed gener-
ally of either soot, lampblack, or some type of char-
coal to which gum arabic and solvent such as water,
wine, or vinegar were added. The basic ingredients
of metalgall inks are copper, iron, galls, gum arabic,
and a solvent such as water, wine, or vinegar (De-
Pas, 1975), (Flieder et al., 1975). The inks used in
this study date from the 11th to the 18th century and
are employed in manuscripts located in south-east Eu-
rope and the eastern Mediterranean areas, especially
in areas where the Byzantine Empire and its influence
spread, which means that all the writing employed in
this study is Greek. The first aim is to derive models
from standard of inks manufactured according to the
recipes given in(Bat-Yeouda, 1983) to have a basis for
comparison with unknown inks. We prepared eight
inks with various known chemical compositions, in
order to represent as many types of inks as possible.
The inks we prepared are as follows:
• Carbon ink
• Metalgall ink. This category contains the Copper-
gall inks and Irongall inks.
• Incomplete ink. This group includes ink, that have
a similar composition to that of metalgall inks, al-
though their composition does not include all of the
ingredients of metalgall inks and we treat them as
subclasses of metalgall inks(type A,B and C).
• Mixed ink. This category contains inks that have
ingredients of the first two categories.
Direct observation and examination of inks under
normal light can provide preliminary clues toward
identification but mainly differentiate between inks
with carbon and non-carbon composition. Reflecto-
graphical studies on the optical behaviors of the inks
under visible and infrared radiation have shown that
inks that have very similar photometric properties un-
der visible light can be separated when viewed under
infrared radiation (Alexopoulou and Kokla, 1999).
The differentiation is mainly due to the different
chemical composition of the inks. The brightness val-
ues of each type of ink under infrared radiation can
be modelled through characteristic intensity distribu-
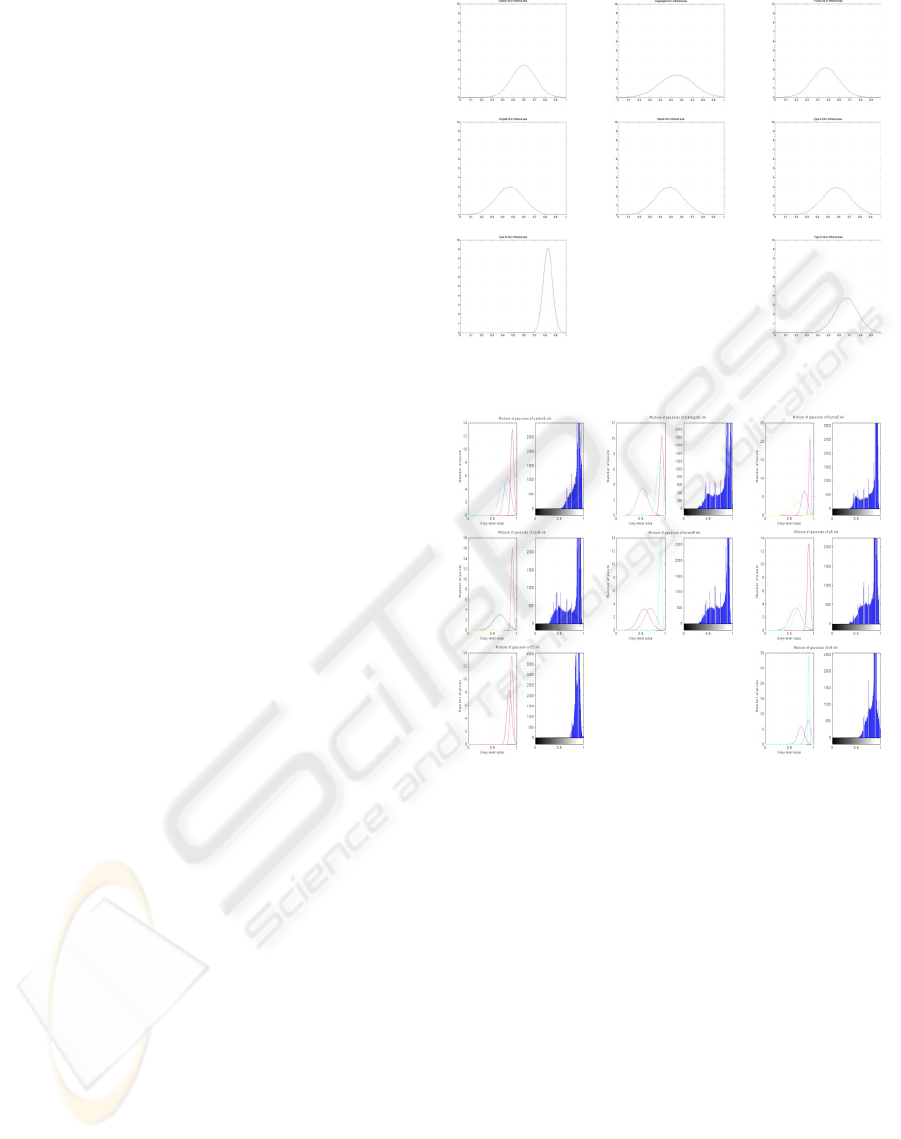
tion curves. The intensity distribution of eight types
of inks are shown in Figure1 and show clearly that
even though there is a difference in the intensity dis-
tribution of inks under infrared radiation, this alone
Figure 1: Intensity distribution of inks under infrared radia-
tion.
Figure 2: Examples of Gaussian mixture models of inks in
the infrared radiation.
is not sufficient to discriminate between the different
inks. One of the main reasons for the uniformity of
the results obtained is that as inks are transparent their
reflective properties are influenced by the thickness
of the liquid used and the reflective properties of un-
derlying support (Derrick et al., 1999). Therefore we
can be represented the inks using mixture of Gaussian
functions as shown in Figure2. Thus these additional
information is examined by studying the classification
of varying types of inks using Bayes’ decision rule.
2.1 Inks Images
During our experiments we created images to reflect
the scripting conditions found in manuscripts and en-
capsulate:
• The varying thickness of the inks during scripting.
PROBABILITY ANALYSIS IN ART CONSERVATION
509
• The varying scripting formed due to the different
means of writing used, such as quill, calamus and
penna.
• The writing characteristics of different authors.
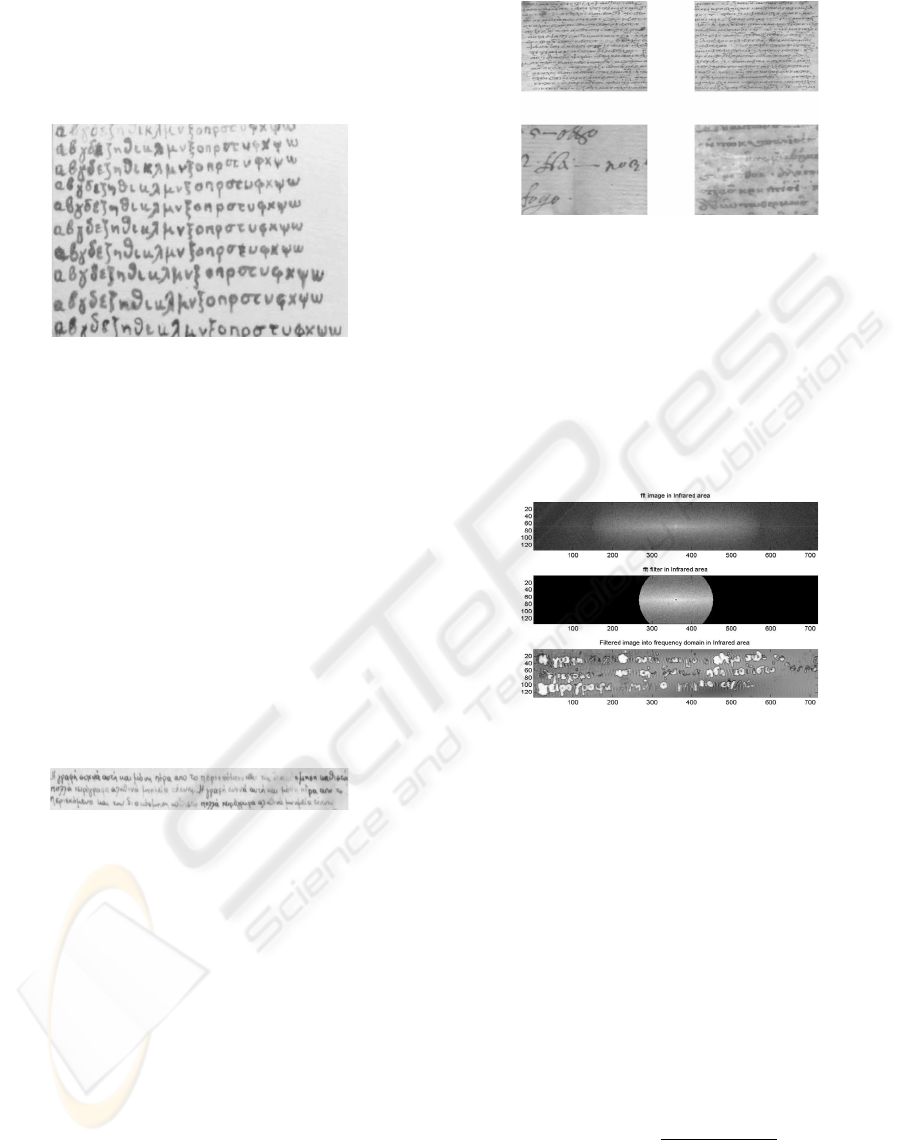
Figure 3: Example of model images.
The images used during our experiments can be
separated to those of known chemical composition
and include both model and test images and those
on unknown chemical composition that were taken
directly from Byzantine and Post-Byzantine manu-
scripts where alternative X-Ray Fluorescence Spec-
trography (XRF) (Janssens, 2000) method is em-
ployed to establish the ink composition used in the
manuscript. This is performed in order to verify
the results derived from the image-based technique.
Figure3 shows examples of model images produced
using 1 to 10 layers of varying thickness inks during
scripting. A total of 480 images (8 inks x 10 layers x
3 pens x 2 cases letters) of the Greek alphabet were
created. These were grey level images and included
all categories of inks, writings produced by various
script materials and different script styles.
Figure 4: Example of test images.
Test images included scripts produced with inks
of known composition and scripts taken from Byzan-
tine and Post-Byzantine manuscripts. Figure4 shows
an example of the test images of known composition
used. The test images were scripting samples using
both upper and lower case letters, produced by four
different authors. A total of 192 test images of known
ink composition were produced(4 authors x 8 inks x 3
pens). In addition four images(Figure5) from Byzan-
tine and Post-Byzantine manuscripts were used to test
the models.
3 PROBABILITY
CLASSIFICATION OF INKS
Intensity values of inks, which are used in the proba-
bility analysis of inks are taken from areas where the
Figure 5: Manuscript images.
amount of ink is greatest to overcome the problem of
the influence of the support. The segmentation of im-
ages can be done using fast Fourier transformations
that gives results related to the change of contrast
of an image, consequently, these transformations are
suitable for our requirements. Using Fourier transfor-
mation we created band-pass filters which select fre-
quencies within certain ranges, thus enabling the ar-
eas with the greatest amount of in to locate(Figure6).
Figure 6: Fast Fourier filter.
Mixture models are created in the isolated areas of
images in order to characterize ink areas as well as
possible. Gaussian mixture models of an ink are para-
metric statistical models which assume that the ink
data consists of a weighted sum of basic ink model
components. In this approach, each pixel in the model
ink is obtained by selecting the lth component of
the model as a density in optical feature vector space
that consists of a set of M Gaussian models. EM is
a widely used method for estimating the parameter
set of the ink model. With M distributions for each
model ink, more models can be created for any ink
of different weights and the characterization of each
ink is more real and accurate. The classification of
inks between test images and model images becomes
through Bayes’ theorem that expresses as:
P (ω
i
/x)=
p(x/ω
i
)P (ω
i
)
p(x)
where p(x/ω
i
) is the class-conditional probability
of ink pixels of test images in relation to inks in model
images, P (ω
i
) is the prior probability of model inks
and p(x) plays the role of normalization factor and
VISAPP 2006 - IMAGE ANALYSIS
510
ensures that posterior probabilities sum to unity. The
class-conditional probability is given by:
p(x/ω
i
)=
1
√
2πσ
e
−
(α−µ)
2
2σ
2
Where σ is the standard deviation of the model ink,
µ is the mean of model ink and α is the value of pixel
of test ink. The normalization factor we obtain:
p(x)=
n
j=1
p(x/ω
i
)P (ω
i
)
where n is the categories of model inks.
Examining the Gaussian mixture models shown in
Figure 2 we observe that the large weighted compo-
nent in all inks includes grey levels of high intensity
values. This is consistent with our findings that inks
can be most readily differentiated in thick layers of
ink where the intensity is low, whereas they exhibit
similar intensities in thin layers due to transparency.
Scripting includes a combination of thin and thick
layers and therefore it is likely that the areas of low
intensity values will provide more information for dif-
ferentiation. This is overcome when we take into ac-
count the likelihood of each intensity value to occur
in an ink compared to the overall occurrence of this
value in the manuscript inks.
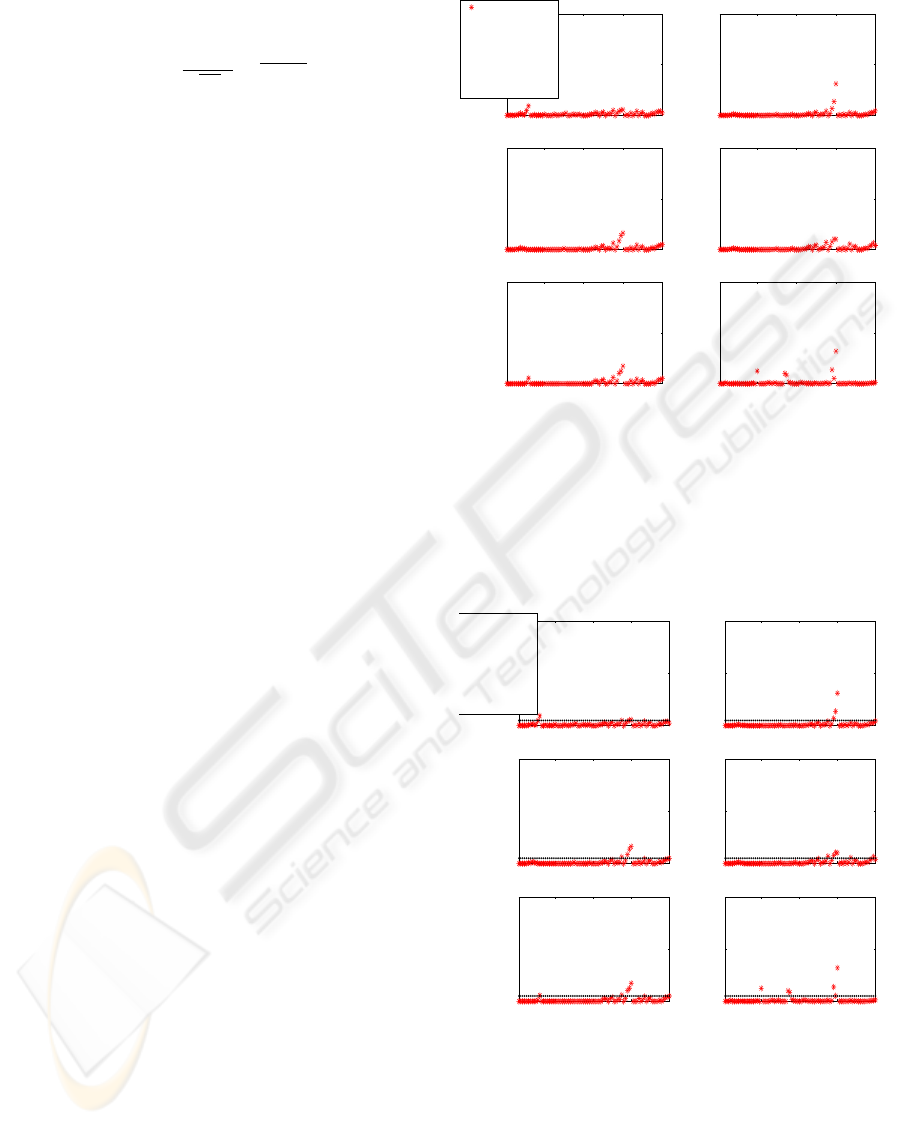
An example is presented in Figure 7 which shows
likelihood results for scripts in irongall ink and writ-
ten using 3 different types of pens (quill, calamus,
penna) and in small or capital letters. On the axis x
are listed the eight inks in ten different layers (1-80)
and on axis y the likelihood of the ink in question.
The graph shows that 5 of the scripts were identified
as written with irongall ink (the 10 layers of irongall
are represented 51-60 on x axis) whereas one of the
inks in the script is identified as type A.
In order to verify the validity of the approach the
probability classification of the ink model are com-
pared with:
• Each of the images that contribute to the creation of
the models. The computation of the model of each
ink includes 6 images(3 pens x 2 letter cases).
• The test scripting images that are created by differ-
ent authors.
• Images of unknown ink composition taken from the
manuscripts.
The probability classification of inks gave us im-
portant results in our attempts to characterize manu-
script inks and as the results show in most cases, the
identification of inks is feasible. Some of the results
fall into three categories: a)Successful: A result is to
be considered as successful when the correct model
ink is identified; b)Screening: A result is to be con-
sidered as screening when the correct model ink is in-
cluded among the first three results; c)Unsuccessful:
20 40 60 80
0
0.5
1
Iron8fair
Inks
Probability
20 40 60 80
0
0.5
1
Iron8fbir
Inks
Probability
20 40 60 80
0
0.5
1
Iron8kair
Inks
Probability
20 40 60 80
0
0.5
1
Iron8kbir
Inks
Probability
20 40 60 80
0
0.5
1
Iron8pair
Inks
Probability
20 40 60 80
0
0.5
1
Iron8pbir
Inks
Probability
1−10 type a ink
11−20 type b ink
21−30 type c ink
31−40 carbon ink
41−50 fourna ink
51−60 iron ink
61−70 metalgall ink
71−80 mixed ink
low case letters
capital letters
written
using quill
written using
calamus
written using
penna
Figure 7: Likelihood of script written in irongall and using
3 different types of pens (quill, calamus, penna) in small or
capital letters.
A result is to be considered as unsuccessful when the
correct model ink is not included among the first three
results.
20 40 60 80
0
0.5
1
Iron8fair
Inks
Probability
20 40 60 80
0
0.5
1
Iron8fbir
Inks
Probability
20 40 60 80
0
0.5
1
Iron8kair
Inks
Probability
20 40 60 80
0
0.5
1
Iron8kbir
Inks
Probability
20 40 60 80
0
0.5
1
Iron8pair
Inks
Probability
20 40 60 80
0
0.5
1
Iron8pbir
Inks
Probability
1−10 type a ink
11−20 type b ink
21−30 type c ink
31−40 carbon ink
41−50 fourna ink
51−60 iron ink
61−70 metalgall ink
71−80 mixed ink
Figure 8: An example of the threshold.
Furthermore, a threshold value of 0.05 was used
in order to measure the strength of the results given
by the probability comparison of test inks with model
inks. The threshold value is the distance between the
identified model ink and the other remaining evalu-
ated models. Any probability below 0.05 indicates a
strong certainly that the model ink recognized is the
PROBABILITY ANALYSIS IN ART CONSERVATION
511
correct one, whereas any value above 0.05 indicates a
weaker certainty in the results(Figure8).
3.1 Model Images
0 10 20 30 40 50 60 70 80 90 100
1
2
3
4
5
6
7
8
Carbon
Coppergall
Fourna
Irongall
Mixed
Type A
Type B
Type C
Percentage of success
Results of inks in Infrared area
0 10 20 30 40 50 60 70 80 90 100
1
2
3
4
5
6
7
8
Carbon
Coppergall
Fourna
Irongall
Mixed
Type A
Type B
Type C
Percentage of success
Results of inks in Visible area
Screening
Successfu
l
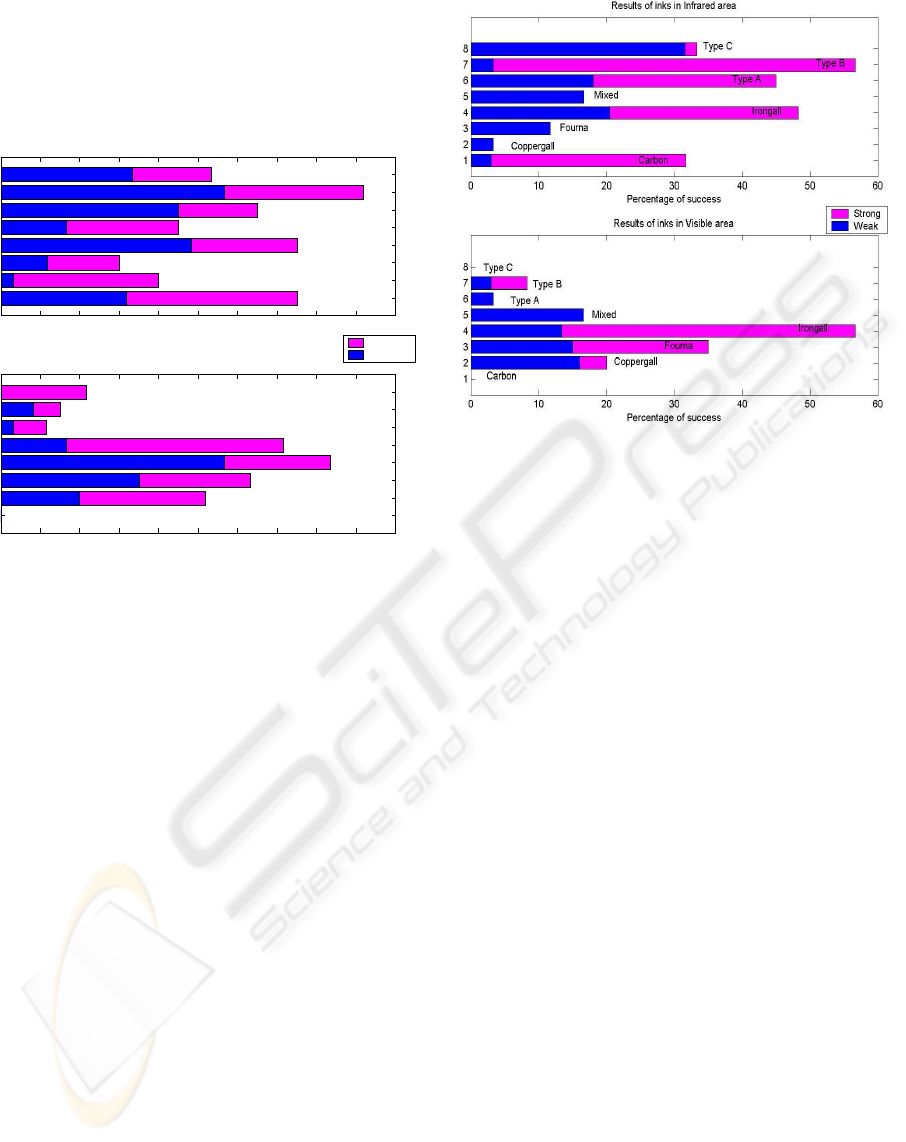
Figure 9: Results of inks in the probability analysis.
Figure9 shows the percentage of the successful
and screeningresults when the inks models are tested
against images that were incorporated in the compu-
tation of the model inks. The results are based on the
computation of the ink probabilities under visible and
infrared area of spectrum. The following observations
are made:
• All inks was identified and screened results in both
areas, visible and infrared areas. In this classifica-
tion, the screening results are taken into account.
• Irongall ink was identified and screened results
in both areas, visible and infrared with the cor-
responding results are 75% for infrared area and
83.4% for visible area.
• TypeA, typeB, typeC and carbon inks can be iden-
tified and screened in infrared area and their results
were 65%, 91.7%, 53.3% and 75% respectively.
• Coppergall, Fourna’s and mixed inks had been
identified and screened results in visible area. The
corresponding successful and screening results for
these inks are 51.7%, 63.3%, 71.6% respectively.
The strength was also computed in order to deter-
mine the accuracy of the method. Figure10 shows the
percentage of successful identified models below the
threshold value of 0.05(strong results) and the per-
centage of the correct identified models above the
threshold value(weak results). Observing the results
in Figure10 we can make the following comments:
Figure 10: Strong results of inks in the probability analysis.
• More successful results were strong in infrared area
which suggests that these results are reliable. In
visible area the percentage of strong results is low.
Only Fourna’s and irongall inks have strong results
in this area of spectrum.
• Irongall ink presents high percentage of strong re-
sults in both illuminations.
• TypeA, typeB and carbon inks offer high percent-
age of strong results in infrared area. The smallest
percentage of strong results are presented by the
typeC, mixed and coppergall inks.
• Fourna’s ink displays a high percentage of strong
results in visible area, whilst it displays a high per-
centage of weak, and therefore unsuccessful, re-
sults in infrared area.
3.2 Test Images
Figure11 shows the results of the scripting test images
in infrared and visible areas prepared by four different
authors. By the examination of the results occurs that
the classification of the most inks were possible. In
particular:
• TypeB, irongall, Fourna’s and coppergall inks can
be identified and screened in both the infrared and
visible areas.
• TypeC, typeA and carbon inks can be identified and
screened only in the infrared area.
• Mixed ink can be identified and screened only in
the visible area.
The ink model were also tested against Byzan-
tine and Post-Byzantine manuscripts of unknown ink
VISAPP 2006 - IMAGE ANALYSIS
512
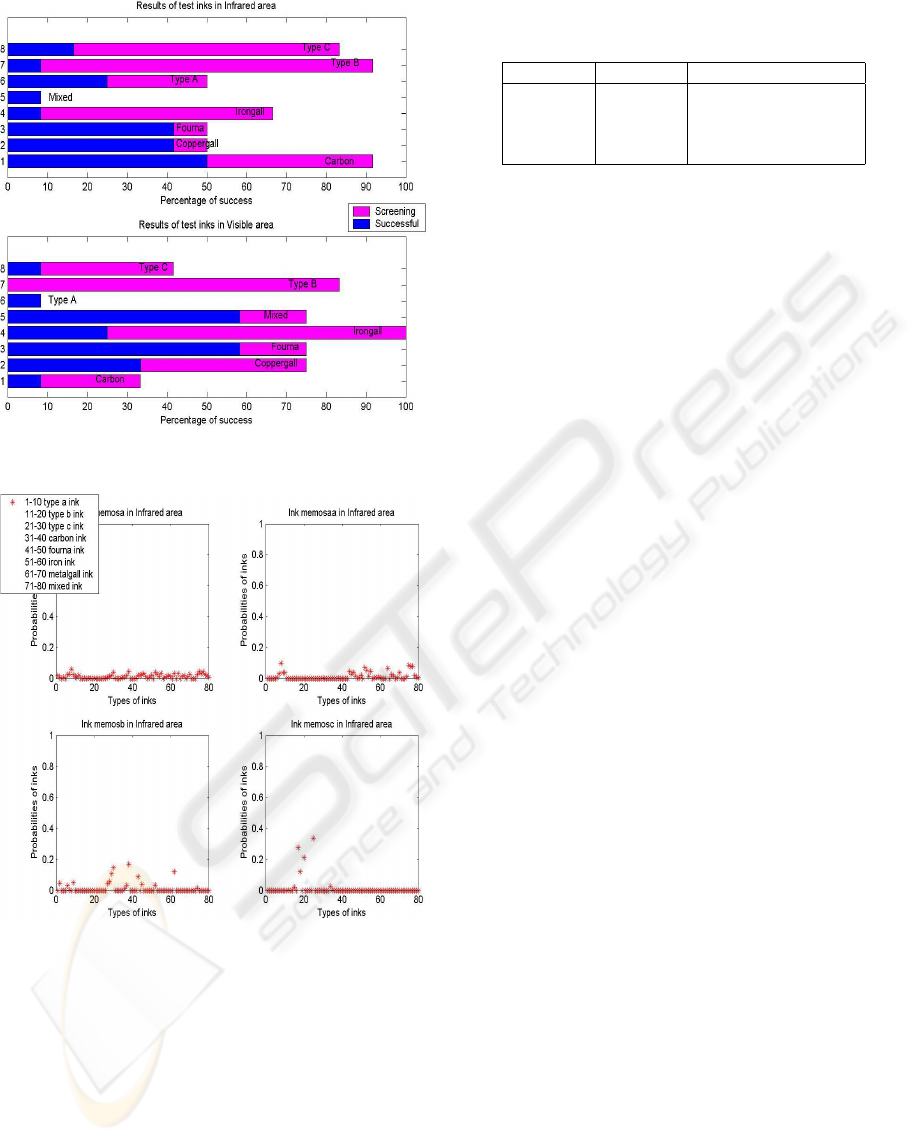
Figure 11: Results of test inks in the probability analysis.
Figure 12: Estimated likelihood of manuscripts based on
intensity values.
composition. The ink composition of the manuscript
images, which was known from XRF method were
compared with the results given by the image-based
analysis of the manuscripts. Figure12 gives the re-
sults of the probability of the four manuscripts in the
infrared area. A comparison of the results derived
by the XRF method and infrared probability image-
based is shown in table1. The results show that the
ingredients of the inks used in four manuscripts can
be determined by the probability image-based results.
In particular:
Table 1: Comparison between XRF and image-based results
on the manuscripts.
Manuscripts XRF image-based
Memosa Fe TypeA
Memosaa Fe TypeA
Memosb Feand Cu Carbon, TypeC, Coppergall
Memosc Fe and Cu TypeC and TypeB
• The ink TypeA which have been identified as the
correct models as the inks of manuscripts memosa
and memosaa include in their composition iron, as
shown in XRF measurements for these two manu-
script inks.
• The inks of TypeC and Coppergall which have been
identified as the correct models as the ink of man-
uscript memosb include in its composition copper,
as shown in the XRF measurements for this manu-
script ink. The ink Carbon which have been found
in memosb with the probability image-based analy-
sis, didn’t detect in composition of manuscript ink
as shown in XRF measurements for this manuscript
ink.
• The ink typeC which has identified as correct mod-
els as the correct models as the ink of manu-
script memosc include in its composition copper,
as shown in the XRF measurements for this manu-
script.
4 CONCLUSION
The methodology of this study is based on the prob-
ability classification of ink pixels through mixture
Gaussian models of diverse types of inks. Analysis
in the visible areas mainly reflect the ink intensity
whereas analysis in the infrared area reflects the ink
composition. Models of the inks are created based on
mixture Gaussian functions and we have taken into
account scripting with different pens, authors and the
thickness of the inks.
Based on the results presented we can conclude
that probability classification can provide reliable in-
formation towards the discrimination of inks. Whilst
the probability classification identified or screened all
inks in this study, further work is currently undertaken
to combine these results with other statistical mea-
surements as to increase their discriminatory ability.
ACKNOWLEDGMENTS
We would like to thank the Greek State Scholarships
Foundation (IKY) for its support for this work.
PROBABILITY ANALYSIS IN ART CONSERVATION
513

REFERENCES
Alexopoulou, A. and Kokla, V. (1999). Physicochemical
study of inks of manuscripts using ultraviolet and near
infrared radiation. In 6th International Conference
on Non-Destructive Testing and Microanalysis for the
Diagnostics and Conservation of the Cultural and En-
vironmental Heritage. vol.2.
Barrow, J. (1972). Manuscripts and Documents. University
Press of Virginia, Virginia, 2nd edition.
Bat-Yeouda, M. Z. (1983). Les encres noires au moyen
ages(jusqu’ a 1600). CNRS, Paris, 1st edition.
DePas, M. (1975). Etat des travaux effectues sur l’ analyse
des consititues des encres noires manuscripts par deux
technique: chromatographie sur couche mince et elec-
trophorese. In Comite pour la conservation de l’
ICOM. ICOM.
Derrick, M., Stulik, D., and Landry, J. (1999). Infrared
Spectroscopy in Conservation Science. The Getty
Conservation Institute, Los Angeles, 1st edition.
Fletcher, S. (1984). A preliminary study of the use of in-
frared reflectography in the examination of works of
art on paper. In ICOM Committee for Conservation,
7th Triennial Meeting Preprints, Copenhagen. ICOM.
Flieder, F., Barroso, R., and Orvezabal, C. (1975). Analysis
des tannins hydrolysable susceptibles d’ entrer dans
la composition des encres ferro-geliques. In Comite
pour la conservation de l’ ICOM. ICOM.
Janssens, K. (2000). Use of micropscopic xrf for non-
destructive analysis in art and archaeometry. In X-Ray
Spectrometry 29.
Pappas, M. and Pitas, I. (2000). Digital color restoration of
old painting. In IEEE Transactions on image process-
ing. Vol. 9.
Smith, R. and Chang, F. (1996). Visualseek: A fully au-
tomated content-based image query system. In ACM
Multimedia.
VISAPP 2006 - IMAGE ANALYSIS
514
