
COMPARING FACES: A COMPUTATIONAL AND PERCEPTUAL
STUDY
L. Brodo
1
, M. Bicego
2
, G. Brelstaff
3
, A. Lagorio
2
, M. Tistarelli
4
, E. Grosso
2
1
DSL - University of Sassari - via Tempio, 9 - 07100 Sassari - Italy
2
DEIR - University of Sassari - via Torre Tonda, 34 - 07100 Sassari - Italy
3
CRS4, Parco Scientifico e Tecnologico POLARIS - 09100 Pula (CA) - Italy
4
DAP - University of Sassari - piazza Duomo, 6 - 07041 Alghero (SS) - Italy
Keywords:
Face differences, log polar mapping, psychophysical evaluation, difference maps.
Abstract:
The problem of extracting distinctive parts from a face is addressed. Rather than examining a priori specified
features such as nose, eyes, mouth or others, the aim here is to extract from a face the most distinguishing or
dissimilar parts with respect to another given face, i.e. finding differences between faces. A computational
approach, based on log polar patch sampling and evaluation, has been compared with results obtained from a
newly designed perceptual test involving 45 people. The results of the comparison confirm the potential of the
proposed computational method.
1 INTRODUCTION
Automatic face analysis is an active research area in
which interest has grown over recent years.One of the
most challenging and interesting issues in the auto-
mated analysis of images of faces is the detection of
“facial features”, intended as characteristic parts of
the face. Many approaches have been proposed for
the extraction of such facial features (see (Campadelli
and Lanzarotti, 2004) and references therein). Most
of these are devoted to the detection of a priori speci-
fied features, such as the nose, eyes, mouth, eyebrows
or other, non anatomically referenced, fiducial points.
In practice, however, for face recognition and authen-
tication, it is necessary to consider additional features,
in particular those that precisely characterize a given
face. Rather than simply extracting standard patterns
to distinguish the face of subject “A” from that of sub-
ject “B”, it is important to extract from the face-image
of subject “A” as many as possible of the features that
differ significantly from, or are not even present in,
face “B”.
Recently, an area-based approach aimed at “finding
differences” between faces was proposed (a prelimi-
nary version appeared in (Bicego et al., 2005)). It ex-
tracts from one face-image the most distinguishing, or
dissimilar, areas with respect to another face-image,
or to a population of faces. In particular, the pro-
posed algorithm extracts, from two face-images, a set
of sub-images centered at different locations within
each image. This process samples most of the face,
in a way similar to that adopted in patch-based im-
age classification (Dorko and Schmid, 2003)) and im-
age characterization (Jojic et al., 2003). At each lo-
cation, data are sampled according to a “multi-scale”
regime in which image patches encode grey-scale pat-
tern at different spatial resolutions. A log polar map-
ping (Grosso and Tistarelli, 2000) has been adopted
for this purpose. The image patches thus extracted
constitute two data-set features, each characterizing a
single face. Next a classifier is trained so as to best
distinguish between the two face-classes purely on
the basis of the grey-levels values of the pixels within
each patch. By identifying the loci of the patches in
the resultant classification space the degree of “dis-
tinctiveness” can be assessed as the distance from the
trained hyperplane. Since the classifier is trained to
separate patches of the first face from patches of the
second, we hypothesize that the most important dif-
ferences between the two faces will be encoded by the
patches furthest from the separating hyperplane (i.e.
those that the classifier weights highest). In (Bicego
et al., 2005) examples of the most important patches
were extracted and shown for several different im-
ages.
In this paper the computational method has been
enhanced and improved, particularly when computing
the difference between patches and when visualizing
the results. However, the main aim here is to inves-
tigate the question: are the differences extracted and
assigned importance by our algorithm also judged im-
portant by human observers? In section 3 we present
an initial perceptual study that provides some prelim-
inary evidence that human observers may indeed con-
188
Brodo L., Bicego M., Brelstaff G., Lagorio A., Tistarelli M. and Grosso E. (2006).
COMPARING FACES: A COMPUTATIONAL AND PERCEPTUAL STUDY.
In Proceedings of the First International Conference on Computer Vision Theory and Applications, pages 188-191
DOI: 10.5220/0001367701880191
Copyright
c
SciTePress

sider important the patch locations identified by our
algorithm.
2 COMPUTATIONAL
EVALUATION
The idea here is to determine those areas of a given
face-image that differ most from any other face-
image. In brief, we achieve this by projecting into a
feature space two sets of image patches, sampled from
two face-images, and scoring the patches by their mu-
tual distances. The most distant features found in the
feature space are likely to be the more distinctive face
areas for the specific faces.
In detail, our algorithm extracts, from the two
face-images, a set of patches centered upon specific
points—where these points are uniformly distributed
across the face-image such that most, or all, of the
face area is covered by the sampling process. Each
patch maps on to a coordinate in a multi-dimensional
feature space by virtue of its sample grey-levels. We
adopt simple feature formulation approach by con-
sidering the sample grey-levels in each patch as or-
dered coordinate values as resulting from the log polar
sampling—in practice defining a 400-D space. The
patches from one face-image will tend to form their
own cluster in this space: the other face-image ought
to form a different cluster. Our extracted patches thus
constitute two data-clusters of location-independent
features, each of which characterize one of the two
faces. Based on the distribution of those patches
within feature space, degrees of distinctiveness of
each face patch can be formulated according to its
distance from the projection of the other data-cluster.
Patches with the highest weights are then interpreted
as encoding the most important differences between
the two face-images.
Since face recognition involves information appar-
ent at a various spatial resolutions a multi-scale analy-
sis should provide an advantage over any single scale
analysis A multi-scale analysis could repeat the clas-
sification procedure with patches of various sizes, and
then judiciously combine the results to obtain the im-
portant differences. We adopt a variant multi-scale
approach designed to avoid two notable pitfalls: (a)
blind analysis - whereby information revealed at one
scale is not usefully available at other scales, and (b)
repeated image processing - which adds to the overall
computational expense.
Our solution is to sample the face-image using
patches derived from a log-polar mapping (Grosso
and Tistarelli, 2000). This mapping can also be moti-
vated by its resemblance to the distribution of the re-
ceptive fields in the human retina, where the sampling
resolution is higher at the central fovea and decreases
toward the periphery. The resultant sampling process
ensures that each patch contains both low scale (fine
resolution) and contextual (low resolution) informa-
tion.
Facial features are then selected in two steps:
1. two distinct sets of patches are extracted from the
two face-images at specific image locations;
2. for each of the two faces, the patches are ranked
according to their distances from the other cluster
in feature space.
2.1 Multi-scale Face Sampling
The patches sampled from the original face-image are
centered at a pre-specified set of points. To ensure
translation-independence the locations of these points
ideally ought to be selected randomly (Bicego et al.,
2005). Yet since that would require very many sam-
pling points, in order to completely cover the two
faces we adopt here a regular sampling regime for
which the faces have been manually registered before-
hand.
The face-image is re-sampled at each point follow-
ing a log-polar scheme (Grosso and Tistarelli, 2000)
so that the resulting set of patches represents a local
space-variant remapping of the original image, cen-
tered at that point. Analytically, the log-polar scheme
describes the mapping postulated to occur between
the retina (retinal plane (r, q)) and the visual cor-
tex log-polar or cortical plane (x, h)). The size of
the “receptive fields” follows a linear increment mov-
ing from the central region (fovea) outwards into the
periphery. Due to lack of space, full details of the
log-polar transformation are not given here, interested
reader are referred to (Grosso and Tistarelli, 2000).
The set of log-polar image patches, sampled from
each face-image, are vectorized, and represent the
face in feature space.
2.2 Determining Face Differences
As stated early, the “distinctiveness” of each patch is
related to its locus in feature space with respect to the
other face. In particular, those patches of the first face,
found near loci of the second face in feature space
are less distinctive since they may easily be confused
with the patches of that second face. On the other
hand, patches located near the first face-set should be
usefully representative.
More formally, let S
A
,S
B
the set of patches of face
A and B, respectively. The weight of distinctiveness
ω of a patch p
A
(x, y), centered at the position (x, y)
in the face A is computed as:
ω(p
A
(x, y)) = d(p
A
(x, y),S
B
) (1)
COMPARING FACES: A COMPUTATIONAL AND PERCEPTUAL STUDY
189

where
d(p
A
(x, y),S
B
) = min
(x
,y
)
d
E
(p
A
(x, y),p
B
(x
,y
))
(2)
where d
E
is some distance metric between feature
vectors. Here, for simplicity, we adopt a Euclidean
metric. It might be worthwhile investigating other
metrics, such as those due to transforming feature
space via say a Principal Component Analysis or Lin-
ear Discriminant Analysis.
We measure both the difference of face A to face
B and vice versa since the two distinctiveness results
can and do vary. In each case, the results are projected
back on to the spatial image of the face using a paral-
lel flood-filling technique. This renders a “difference”
map in which the grey level of each pixel indicates the
level of distinctiveness.
3 PERCEPTUAL STUDY
We describe here an informal study of how human
observers report seeing difference between faces with
the aim of comparing the result obtained with that of
our algorithm. This is in anticipation of an objective
psychophysical investigation that we intend to present
in the future.
A perceptual experiment was implemented in Mat-
lab on a laptop PC. Human subjects, with normal,
or corrected vision, were selected for a set of tri-
als. In all 45 university students (7 male, 38 female)
were tested. Each trial began (after 2 seconds of
mid-gray screen) by presenting a stimulus consisting
of two monochromatic face-images side-by-side on a
mid-gray background. After a fixed time-interval the
stimulus was replaced by a single cartoon-image (of
roughly the same size) of a “general face” or mock-up
upon which the subject was then asked to navigate and
click using the PC’s mouse. The task, explained be-
forehand via a training example, was to indicate any
part of the face where they had seen an important dif-
ference during the stimulus presentation. After 5 sec-
onds the mock-up was replaced by the mid-gray back-
ground ready for the next trial to be initiated. A set of
trials consisted of repeating this procedure until each
of six chosen face-pairs had been presented to the sub-
ject. The results were later reviewed by overlaying
the clicked points on the mock-up and displaying it
on screen or paper—e.g see Fig. 2.
Viewing parameters were fixed as follows: view-
ing distance: 50 cm; image height: 9 cm (10 deg,
310 pixels); image width: 6 cm (7 deg, 200 pixels);
image-pair separation: 4 cm (5 deg); stimulus width:
14 cm (19 deg); full contrast screen setting under in-
door ambient illumination.
In the training example—Fig. 2(Exp. 1)—the two
Figure 1: Top line: stimulus faces. Bottom line: results of
perceptual study increasing the time interval: 0.5, 1, 2, 4 s.
The displayed maps are accumulative, i.e. each is the sum
of all the previous map plus the current one.
images were identical except for the artificial super-
position of a easily seen dark spot on one cheek. In
the trials image pairs presented two different persons,
except in one case where the same person with, and
without, facial make-up and earrings was employed.
Stimulus presentation time ought to allow the ob-
server to have time at least to scan both faces. Since,
it was initially unclear what interval might suffice we
repeated each set of trials four times on each occasion
doubling presentation time—i.e. 0.5, 1, 2 and 4 s.
Note, learning effect might thus contaminate the re-
sults of the later set of trials, and so they are avoided in
the next section. For short intervals one might expect
a concentration on specific location (featural process),
while for long intervals the tendency may be to con-
vey the attention to the overall face (see (Collishaw
and Hole, 2000)). This is indicated the mock-ups in
the lower parts of Fig. 1, which incrementally shows
the face areas clicked upon during the four trial sets
(the i-th image accumulates the results from the first
i trials). It seems that as the interval increases, ob-
servers focus their attention upon configurational as-
pects of the face such as cheeks, the upper lip zone
and between the eyes.
4 EXPERIMENTAL
COMPARISON
Here we graphically compare difference maps pro-
duced by our algorithm with the mock-up results from
our perceptual experiment. To this end the algorithm
was run on the same face-image pairs presented in the
experiment—as follows. Each log-polar patch had a
resolution of 23 eccentricity steps and 35 receptive
fields at each, with a 10% overlap along the two direc-
tions. The images were cropped in order to eliminate
the influence of the background, often omitting the
ears. Here we employ only the mock-ups that com-
bine the 0.5 and 1 s time intervals in order to reduce
any learning effect contamination. Fig. 2 compares
three results. In general, these graphical comparisons
are indicative of the high, if not perfect, degree of
agreement found between the algorithmic-produced
VISAPP 2006 - IMAGE UNDERSTANDING
190
Experiment 1
Experiment 2
Experiment 3
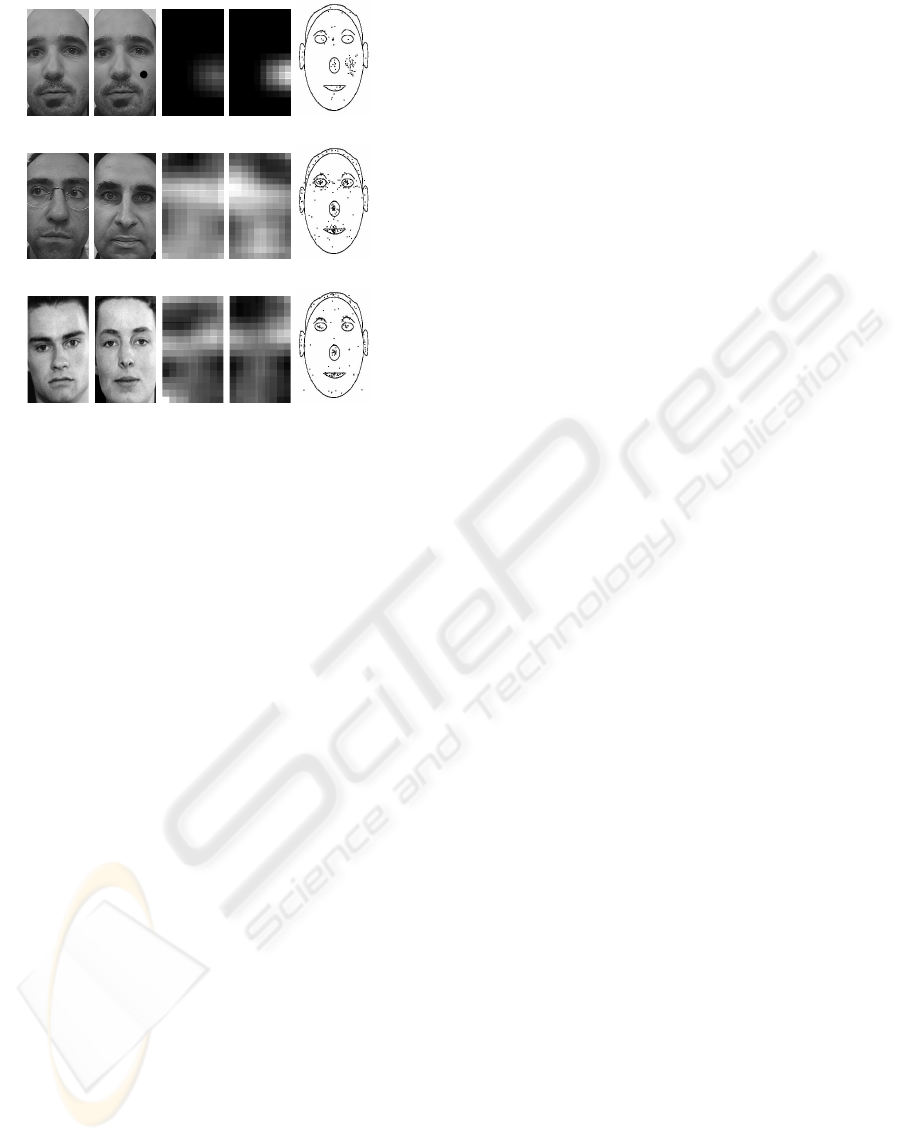
Figure 2: Comparison of computational and perceptual re-
sults: For each experiment, the first row contains the origi-
nal images, the second the results of computational and per-
ceptual experiments.
difference maps and the human-generated mock-ups.
Below these comparisons are discussed in turn.
• Comparison 1. This is the training example in-
tended to test the system in artificially controlled
conditions. The two images are identical, ex-
cept for the black dot attached to the cheek. The
perceptual mock-up result indicates most dots in
the correct zone, with a small spatially random
component. The algorithm also maps the correct
zone as the most important difference—via a light
area. Both difference maps are shown: (a) that of
the difference between the face-with-dot from the
face-without-dot, and (b) vice versa. In the lat-
ter case, the maximum difference appears darker—
presumably because that spot zone is actually more
similar to other parts of the face-with-dot image.
Otherwise the two maps have similar structure, as
might be expected. In this case, the algorithmic and
mock-up results are in good overall agreement.
• Comparison 2. This is a more realistic example
involving two different faces. The perceptual re-
sult, the mock-up, indicates the majority of dots lo-
cated on the mouth, the eyes and the nose, while a
few points are found around the face contour. The
algorithm is in agreement, especially highlighting
the eye zones where the glasses appear to be fun-
damental in discriminating between the two faces.
Neither the forehead nor the cheeks appear to be
important. The two difference maps are structurally
similar, except at the upper part of the right eye of
the second face. This part, greatly highlighted by
the algorithm indicates the right eyebrow, which
appears very different from the one on the left (sim-
ilar to those of the first face). Thus the algorithm is
revealing a high level of details here.
• Comparison 3. This realistic example, compares
a male face to a female face. The mock-up re-
sulting from the perceptual trials distinguishes the
eyes, the eyebrows, the mouth, the nose and the
hair junction. The eyes and eyebrows are clearly
identified by the algorithm, whereas less emphasis
has been given to the mouth and to the nose. The
hair junction has been detected only in one face,
confirming that it is worth while to compute both
difference maps. The large erroneous difference in
the bottom left corner of the first face, is probably
due to the neck that is present in the face-image. It
is interesting to note that the algorithm is able to
discover the inclination of eye-line of the first face
and represents it in the difference map.
5 CONCLUSIONS
Here we addressed the problem of finding differences
between faces from two complementary angles: al-
gorithmic analysis and perceptual testing. In several
experiments the difference maps computed showed a
high degree of similarity to those made apparent by
the perceptual testing.
REFERENCES
Bicego, M., Grosso, E., and Tistarelli, M. (2005). On find-
ing differences between faces. In Kanade, T., Jain, A.,
and Ratha, N., editors, Audio- and Video-based Bio-
metric Person Authentication, volume LNCS 3546,
pages 329–338. Springer.
Campadelli, P. and Lanzarotti, R. (2004). Fiducial point lo-
calization in color images of face foregrounds. Image
and Vision Computing, 22:863–872.
Collishaw, S. M. and Hole, G. J. (2000). Featural and con-
figurational processes in the recognition of faces of
different familiarity. Perception, 29:893–909.
Dorko, G. and Schmid, C. (2003). Selection of scale-
invariant parts for object class recognition. In Proc.
Int. Conf. on Computer Vision, volume 1, pages 634–
640.
Grosso, E. and Tistarelli, M. (2000). Log-polar stereo for
anthropomorphic robots. In Proc. European Confer-
ence on Computer Vision, volume 1, pages 299–313.
Springer-Verlag.
Jojic, N., Frey, B., and A.Kannan (2003). Epitomic analy-
sis of appearance and shape. In Proc. Int. Conf. on
Computer Vision, volume 1, pages 34–41.
COMPARING FACES: A COMPUTATIONAL AND PERCEPTUAL STUDY
191
