
AN IMAGE REGISTRATION TECHNIQUE FOR DETECTION OF
CRACK AND RUST GROWTH
Norihiko Itoh
Central Research Institute of Electric Power Industry
2-11-1 Iwado Kita, Komae-shi, Tokyo, Japan
Keywords:
Computer vision, Image processing, Pattern recognition, Fourier transform.
Abstract:
To observe and record the progress of cracks and rusting, it is necessary to compare the images of the past
with those of the present. The angles of surfaces of structures such as a concrete wall taken vary according to
the camera position, that is the location in which they were taken. The images that were taken from different
points are distorted, deformed or appear as if the actual location of the cracker rust has been shifted. So
need less to say, the uses of these images are not good means of accurately detecting the progress of crack
and rusting. It is first necessary to make rectifications. This can be done by using the images as a basis in
determining the correct camera location and the adjustments made thereof. This paper proposes the difference
of the camera angle can be detected by applying the frequency element of the whole image. Especially, this
method is effective for a surface with few features such as a concrete wall.
1 INTRODUCTION
Recently with the availability on high quality digi-
tal cameras, it is now easier to record and store the
progress of the cracks on the dam-gate or concrete
area. The observation period is lengthy due to the
slow progress of the cracks or rust and it is common
to record and compare the cracks or rust on a regular
or irregular basis.
The angles of surfaces of structures such as a con-
crete wall taken vary according to the camera posi-
tion, that is the location in which they were taken.
The images that were taken from different points are
distorted, deformed or appear as if the actual loca-
tion of the cracker rust has been shifted. Therefore,
the uses of these images are not good means of ac-
curately detecting the progress of crack and rusting.
Then, presumption and compensation of inclination
of those images are important. In order to grasp pro-
gresses of a crack or rust by the difference of images,
it is necessary to utilize a highly registration technique
sub-pixel or less.
Surfaces of structures such as dam-gate or other
huge facilities have few features. Due to the surface
simplicity it is difficult to compare images using fea-
ture points. It is common to use mark point to pre-
sume the camera angle. However, in the case of huge
structures such as dam-gates, it is extremely difficult
to set up indicators on the surface.
Many methods of presuming the camera angle from
images are proposed. Most of them (e.g. Ribeiro
(Ribeiro, 2000)) assume homogenous or isotopic tex-
tures.
Hwang (Hwang, 1998) proposed the method based
on wavelet transform to describe more complex tex-
tures. It focuses the energy concentration at some fre-
quency bands found by wavelet transformation. In ad-
dition, it is necessary to detect a peak of frequency
spectrum stably by this method. However, such con-
centration does not necessarily appear in textures like
the surface of concretes.
This paper proposes a high precision texture-based
image registration method. This method is based
on the spectrum and applicable to non-homogenous
and non-isotopic texture as well as Hwang’s, but this
method use phase-only-correlation, which uses only
the phase of spectrum representing the rich shape in-
formation. That is, the intensity of frequency spec-
trum is not used but carries out high registration of
accuracy only using the phase.
389
Itoh N. (2006).
AN IMAGE REGISTRATION TECHNIQUE FOR DETECTION OF CRACK AND RUST GROWTH.
In Proceedings of the First International Conference on Computer Vision Theory and Applications, pages 389-392
DOI: 10.5220/0001367303890392
Copyright
c
SciTePress
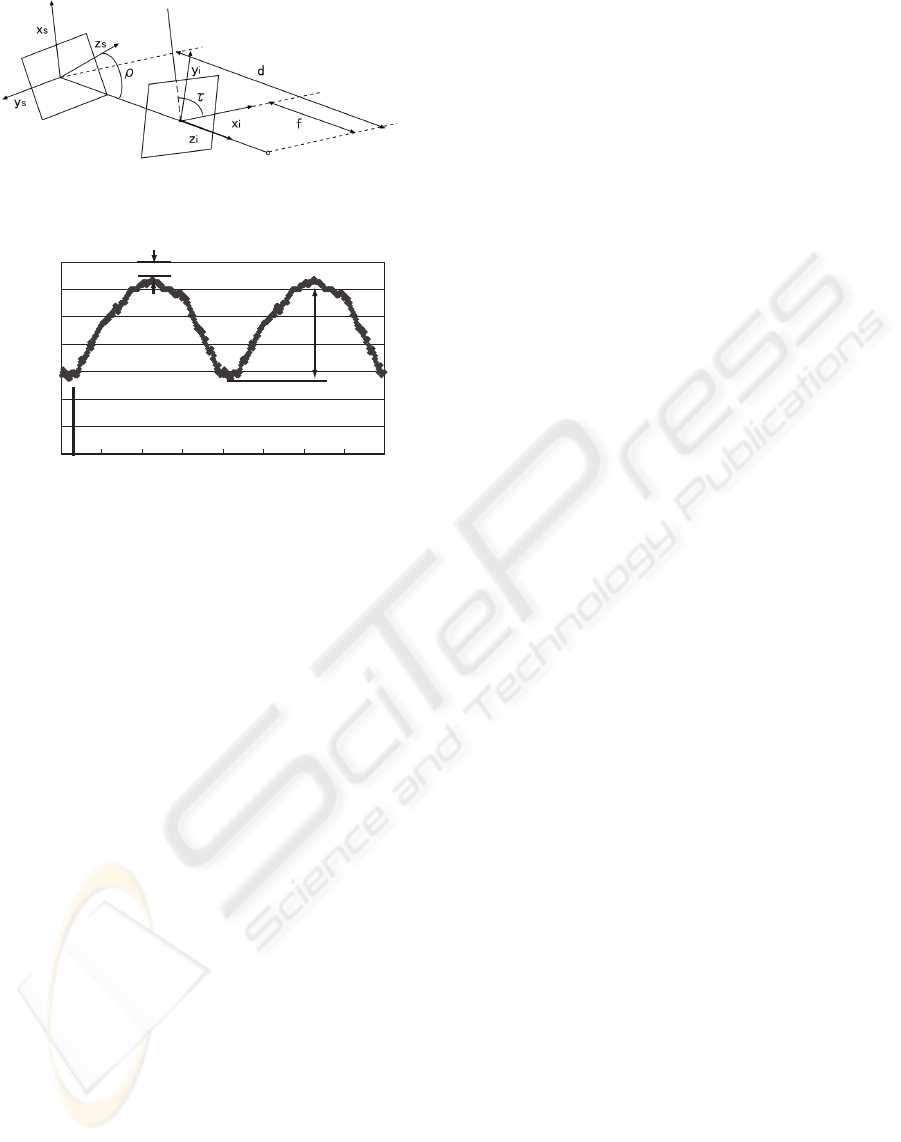
Figure 1: Location of camera and textured plane.
㪇㪅㪐㪐㪊
㪇㪅㪐㪐㪋
㪇㪅㪐㪐㪌
㪇㪅㪐㪐㪍
㪇㪅㪐㪐㪎
㪇㪅㪐㪐㪏
㪇㪅㪐㪐㪐
㪈
'PNCTIGOGPVTCVG
/GCUWTGOGPVFKTGEVKQP
Ǽ
UECNKPITCVG
EQUǹ
Figure 2: Scaling rate and slant-tilt angle.
2 PROPOSED METHOD
A camera projects the three-dimensional space onto a
two dimensional image. The projected image is de-
termined by 4 parameters, the distance d and the slant
ρ and the tilt τ and the rotation θ. Let the coordinate
systems of the object’s surface plane (x
s
,y
s
,z
s
) and
of the camera’s image plane (x
i
,y
i
,z
i
) and the focal
length f as depicted in Figure 1.
The slant angle ρ is defined as an angle between
z
s
and z
i
, which takes nonnegative values between 0
and 90 (deg.). Furthermore, the angle between the
x
i
axis and the projection of the surface normal (z
s
),
onto the image plane (x
i
,y
i
) is defined as the tilt an-
gle τ, which takes values between −180(deg.) and
180(deg.). The slant-tilt combination represents the
orientation of a planar surface. An angle between the
x
i
axis and the projection of the x
s
axis is defined as
a rotation angle θ.
The scaling, slanting, tilting, rotation of an image
all changes the power spectrum (amplitude of the spa-
tial frequencies) of the image but their effects are
different. For example, the rotation causes the rota-
tion of the spectrum and the scaling (zooming) causes
the isotopic scaling and the slant and the tilt cause
anisotropic scaling. Proposed method estimates all
the positional parameters including the scaling, the
slant and the tilt by comparing the spectrum of two
images.
The outline of the procedure is as follows:
1. Cancellation of the shift.
The proposed method first calculates the power
spectrum of two images. This cancels the shift
(translation) between images because the power
spectrum of an image doesn’t change by translation
of the image.
2. Estimation of a rotation angle
Make the log-polar mappings of the two spectrums.
By this mapping, the rotation angle θ and a scale
factor λ is transformed to the translational displace-
ments between two images. After log-polar map-
ping, the proposed method calculates the rotation
angle θ of the images using phase-only correla-
tion (Takita, 2003). The rotation angle is computed
by the difference of peak coordinates in the θ-axis.
3. The calculation of an enlargement and reduc-
tion by the difference in a measurement direc-
tion.
The proposed method calculates the rate of
anisotropic scaling between the two log-polar spec-
trums. After log-polar mapping, this method de-
cides the direction of search. Two-dimensional
phase-only correlation is used for calculation of the
rate of enlargement. The rate of enlargement is
computed from the peak coordinates of the direc-
tion of λ. The rate of enlargement is calculated re-
peatedly by changing the direction to search. Con-
sequently, the enlargement for every direction is es-
timated.
4. The calculation of a rate of scaling, and the
slant-tilt angle ρ, τ .
The rate of enlargement and reduction of each mea-
surement direction changes in a shape of an ellipse.
A rate of scaling is calculated from the value of a
direction of a long axis, the inclination direction
of optic axis (τ ) is calculated from a direction of
a short axis, and the inclines angle ρ is calculated
from a ratio of a long axis and a short axis. The
relation between rate of the enlargement and the
slant-tilt angle ρ, τ is shown in Figure 2.
5. The calculation of the amount of movements of
the x, y direction.
First, an input image is rectified using inclination
direction of optic axis (τ ), and inclines angle ρ.
Next, the proposed method calculates the rotation
angle θ of the images using phase-only correlation
afresh. The input image is rectified using τ, ρ, θ.
Finally, using the reference image and the compen-
sated input image, the proposed method calculate
an amount of movements of x and y directions, and
image registration is completed.
A flow of the proposed algorithm is shown in Figure
3.
VISAPP 2006 - IMAGE ANALYSIS
390
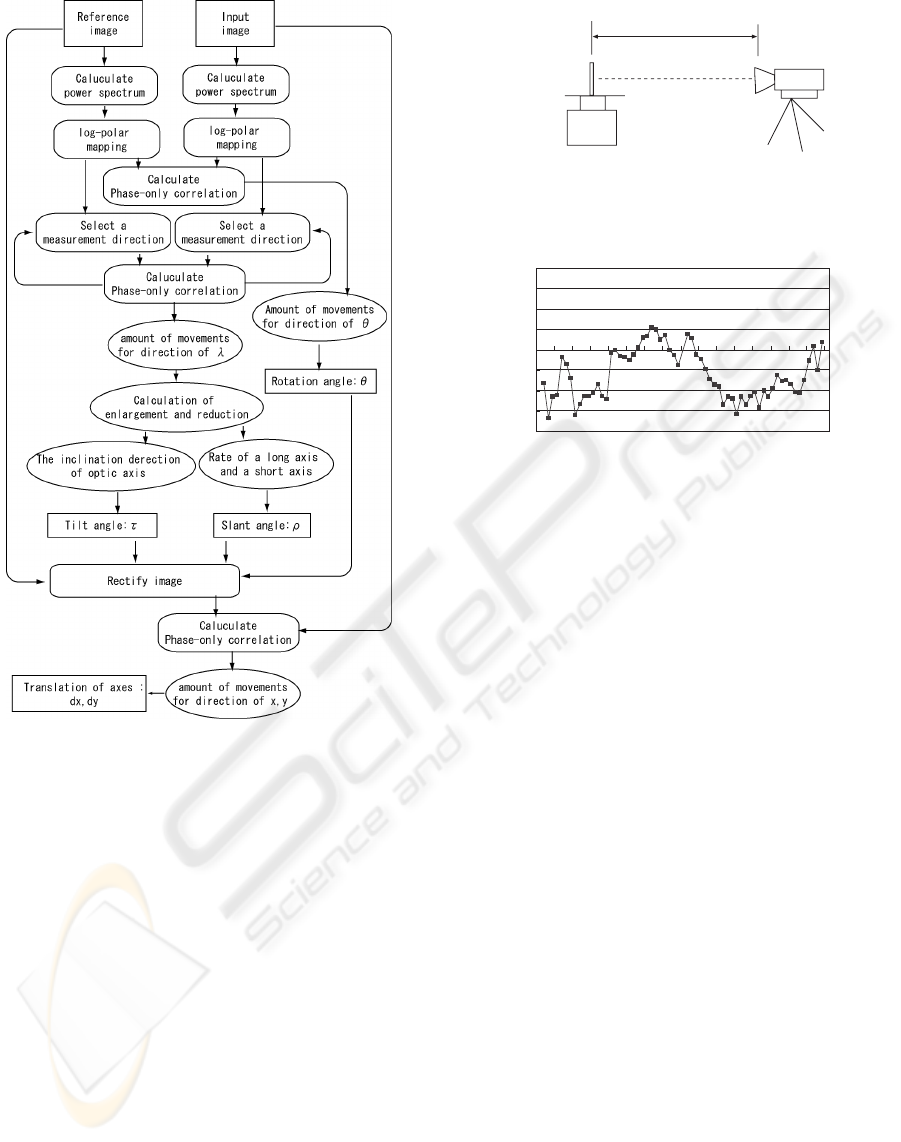
Figure 3: Outline of proposed algorithm.
3 PERFORMANCES
The images of cracks in concrete and rust in steel
taken at the time of inspections are usually non-
homogeneous and non-isotopic. So, two experi-
ments were performed. In the first experiment, us-
ing the images of corkboard, which are typical non-
homogeneous and non-isotopic images, the camera
positions are controlled accurately. In the second ex-
periment, the camera positions are estimated, using
the images of the surface of a concrete wall taken by
a camera only fixed by hands in a similar way at the
time of usual inspections.
3.1 Corkboard Surface
The proposed method is applied to the images of cork-
board taken by a digital camera (Nikon COOLPIX
950). The experimental environment is depicted in
Figure 4.
,
+
-4
0
.
4
27
.
06
7
3/6
7.
1
8
9.5
1
Figure 4: Photography environment.
Slant angle(deg.)
Error(deg.)
-4
-3
-2
-1
0
1
2
3
4
-16 -12 -8 -4 0 4 8 12 16
Figure 5: An example of error vs slant.
The target corkboard is set on a rotation stand and
its distance from the camera is 1.2 meters. The center
of corkboard and the center of the camera’s lens are
at the same height. The stand is rotated from -15.5
degrees to 15.5 degrees by 0.5 degrees, which corre-
spond to the slants of surface orientation. The size of
images is 512 × 512 pixels. The image when the slant
is set to 0 is the reference image and the slant of the
rest images are estimated.
The estimation errors are shown in Figure 5. The
mean of absolute error was 1.44 degrees and the max-
imum error was 3.36 degrees. The error of 3.36 de-
gree corresponds to 0.44 pixels because 512/2 × (1 −
cos(3.36 deg.)) = 0.44.
When realizing equivalent accuracy using feature
points, it is necessary to detect all the feature points
with a less than 0.44-pixel error.
If it is an error of this level, an error is very small.
Therefore, the validity of the proposed method has
been checked.
3.2 Concrete Surface
The method is applied to the images of a concrete sur-
face of a wall taken by the digital camera next. In
usual inspections of dam-gates, tripods do not always
fix the cameras. So, in this experiment, the camera
was fixed by hand as well, not using a tripod. The
size of images is 256 × 256 pixels. The reference im-
age is shown in Figure 6 and the input image is in
Figure 7. The estimations by the method are that the
AN IMAGE REGISTRATION TECHNIQUE FOR DETECTION OF CRACK AND RUST GROWTH
391
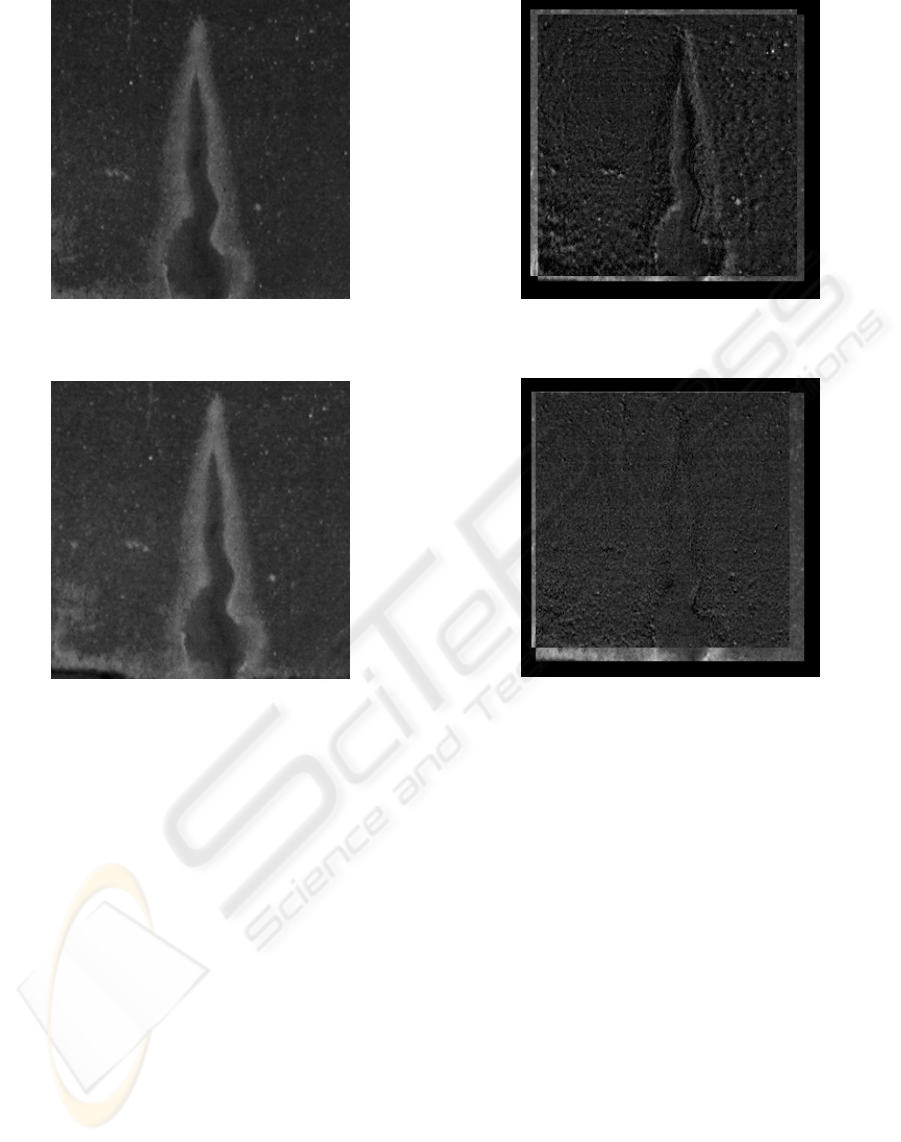
Figure 6: Reference image.
Figure 7: Input image.
relative scaling r of the input image is 0.966, the tilt
τ =9.22(deg.), the slant ρ =0(deg.), and the rota-
tion angle θ =0(deg.). Figure 8 shows the difference
of the reference image and the recovered image from
the input image using the estimated r, τ , ρ and θ. The
whiter pixels have the larger differences. Comparing
with Figure 9 showing the difference between the re-
covered and original input image, the differences are
reduced greatly by this method. The images compen-
sation by this method is clearly effective.
4 CONCLUSIONS
This paper proposes the method to detect the rela-
tive difference of camera positions (including the dis-
tance, the tilt and the slant) of two images of an
object. In the experiments, it is showed that pro-
posed methods can be applied to the images with
non]homogeneous and non-isotopic textures, such as,
the images of the concrete surface, corkboards and
Figure 8: Difference image (no compensation).
Figure 9: Difference image.
the steel surface. The Proposed method can detect the
differences of camera positions with high accuracy.
Currently we are applying this method to observe the
growth of concrete cracks in an accelerated test envi-
ronment.
REFERENCES
Wen L. Hwang, Chun-Shien Lu, and Pau-Choo Chung.
(1998). Shape from Texture: Estimation of Pla-
nar Surface Orientation Through the Ridge Surfaces
of Continuous Wavelet Transform. IEEE Trans. Im.
Proc., 7(5):773-780.
Eraldo Ribeiro, Edwin R. Hancock. (2000). Texture Plane
Orientation from Spectral Accumulation ICPR.,Vol
I:802-806.
K. Takita, T. Aoki, Y. Sasaki, T. Higuchi, K. Kobayashi.
(2003). High-Accuracy Subpixel Image Registra-
tion Based on Phase-Only Correlation. IEICE Trans.
Fundam. Electron. Commun. Comput. Sci. , E86-
A(8):1925-1934.
VISAPP 2006 - IMAGE ANALYSIS
392
