
CFA DEMOSAICKING BY ADAPTIVE ORDER OF
APPROXIMATION
J.S. Jimmy Li and Sharmil Randhawa
School of Informatics and Engineering, Flinders University, GPO Box 2100, Adelaide SA 5001, Australia
Keywords: CFA demosaicking, adaptive order, approximation, colour smoothness.
Abstract: Colour filter array (CFA) demosaicking refers to determining the missing colour values at each pixel when a
single-sensor digital camera is used for colour image capture. It has recently been shown that missing
colour values can be interpolated or extrapolated using Taylor series. The accuracy of approximation
depends on the number of high order derivative terms included in the Taylor series. For a smooth region of
an image, the higher the order, the higher the accuracy in the approximation of the missing colour values.
However, the estimation of high order derivative terms requires pixel values from a wider area of
neighbourhood. When an image contains features closely spaced together, extrapolation using pixels from a
smaller region of neighbourhood is preferred and a low order of approximation should be applied. In order
to achieve more accurate results, we propose an algorithm using an adaptive order of approximation
depending on the colour smoothness of the image. It has been shown that our algorithm outperforms other
techniques for various images, and in particular for images with the above mentioned characteristics.
1 INTRODUCTION
Colour filter array (CFA) demosaicking is the
determination of missing colour values at each pixel
when using a single-sensor digital camera for colour
image capture. In this paper, we introduce an
algorithm using an adaptive order of approximation
to recover missing colour information which
depends on the colour smoothness of an image. Our
method is divided into two stages. In the first stage,
we use the local colour smoothness of the image to
adaptively determine the appropriate order of
extrapolation for the green plane. This will be
applied independently to produce one estimate for
each of the four possible directions, namely up,
down, left and right.
The second stage determines the best estimate
out of the possible four directional estimates, using a
classifier instead of a linear combiner. Other
demosaicking methods (Kimmel 1999, Lu&Tan
2003) determine the missing colour values by
combining weighted estimates from corresponding
directions. Inaccurate estimation of weightings will
produce artifacts which manifest themselves in the
demosaicked output.
The remainder of the paper is organized as
follows. Section 2 details the extrapolation method
of various orders. Section 3 presents the
experimental results, and compares this method with
other existing methods, with the conclusion given in
Section 4.
2 ADAPTIVE ORDER OF
APPROXIMATION
The most common colour filter array used is the
Bayer CFA (Bayer 1976). Figure 1 shows an 8 x 8
window of a Bayer array neighbourhood, where the
index (i,j) denotes the row and column of each
colour pixel. For the Bayer pattern, the green colour
is sampled at twice the rate of the red and blue
values. This is due to the peak sensitivity of the
human visual system which lies in the green
spectrum (Bayer 1976).
To estimate the green value at position x (G
x
) at
which only the blue value (B
x
) is known, consider
the one-dimensional case with an edge boundary on
the left-hand side of B
x
, as shown in Figure 2.
5
S. Jimmy Li J. and Randhawa S. (2006).
CFA DEMOSAICKING BY ADAPTIVE ORDER OF APPROXIMATION.
In Proceedings of the First International Conference on Computer Vision Theory and Applications, pages 5-10
DOI: 10.5220/0001366800050010
Copyright
c
SciTePress
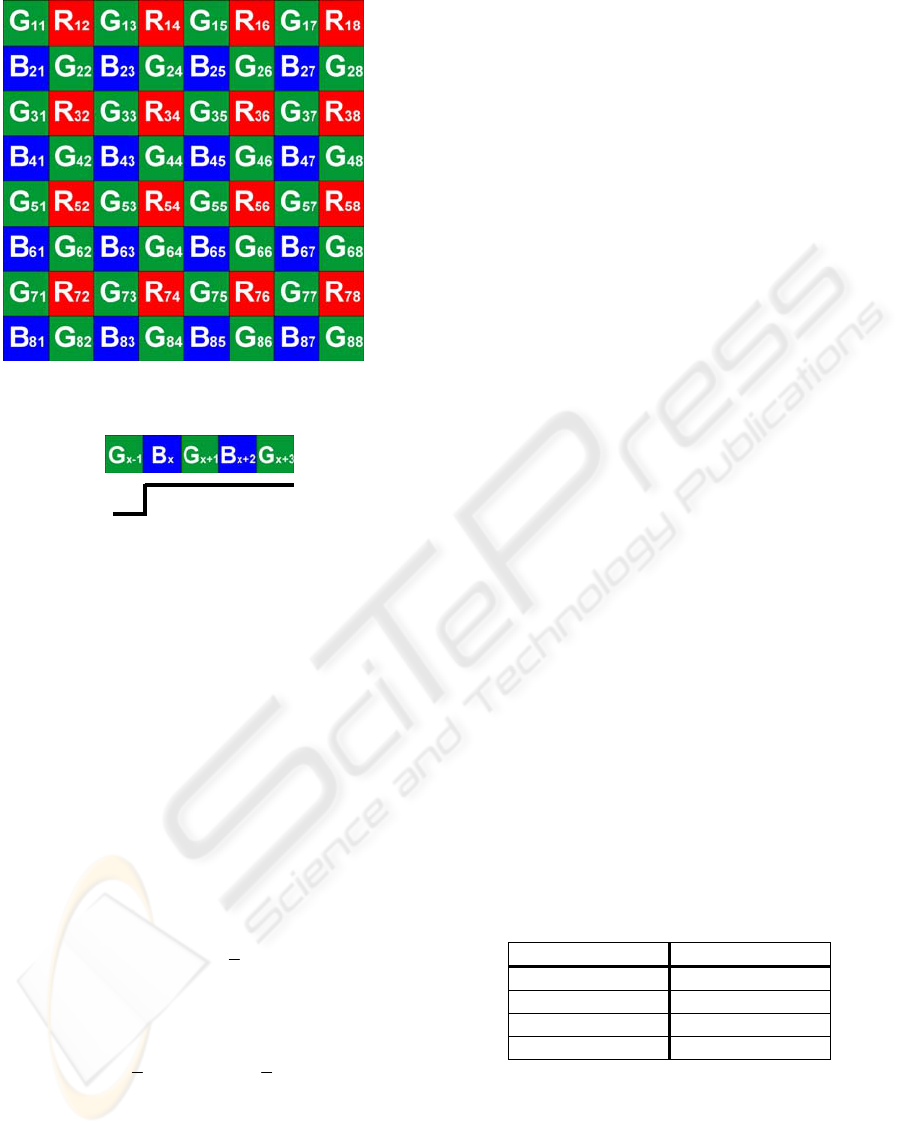
Figure 1: 8x8 Bayer pattern.
Figure 2: 1D Bayer Pattern and Edge Boundary on the
left-hand-side of B
X
.
(1), (2) and (3) are the zero, first and second
order extrapolation equations for the determination
of the missing green colour
x
G
ˆ
respectively
(Li&Randhawa 2005a). From these equations the
higher the order of approximation, the more higher
order correction terms are included to improve the
accuracy. However this implies that more samples
from an extended area of neighbourhood are
required for the approximation.
Zero Order:
1xx
GG
ˆ
+
= (1)
First Order:
)BB(GG
ˆ
2xx
2
1
1xx ++
−+=
(2)
Second Order:
)GG()BB(GG
ˆ
3x1x
4
1
2xx
4
3
1xx ++++
−−−+= (3)
Zero order approximation uses the nearest
neighbour to estimate the missing colour value in the
direction of the extrapolation. It gives satisfactory
results for regions containing features closely spaced
together. In this case, the zero order avoids using
pixels from other nearby non-related features in the
estimation.
For regions with little colour variation, the
general assumptions for demosaicking will hold
(Lu&Tan 2003), and the second order will give the
best accuracy. For regions with moderate colour
variation, the first order will be applied.
The second order will provide adequate
accuracies for most applications, and third or higher
orders of approximation are not required
(Li&Randhawa 2005a).
For the red/blue missing colour values, it has
been shown that first order extrapolation will give
satisfactory results for most images ((Li&Randhawa
2005b).
2.1 Ideal Selector
To confirm that different orders of approximation
will perform better in different regions of an image,
we apply an ideal selector to determine which order
is the best choice for each missing pixel in the green
plane.
To illustrate the above mentioned concept, we
use the pixels in the original image to select one of
the twelve estimates (four directional estimates from
each order) based on the minimum mean square
error criterion. Figures 3 and 4 show the original
and the ideal selector output of the popular
Lighthouse image. These two images are visually
indistinguishable from each other (MSE = 0.0122)
and this indicates clearly that the selected output is a
very good approximation of the original. This
confirms the presence of a highly accurate estimate
within the twelve extrapolated choices. Table 1
gives the proportion for each order as the best choice
for Figure 3. (The undecided proportion in Table 1
represents those pixels that have identical values for
different orders and hence no unique order can be
decided.)
Table 1: Best choices for each order.
Order Best Choice
Zero 30 %
First 24 %
Second 30 %
Undecided 16 %
In general, different images will have different
proportions for different orders but will normally
have some proportion for each order. Hence we
propose an adaptive algorithm to select one of the
three orders according to the colour smoothness of
the image to achieve better results.
VISAPP 2006 - IMAGE FORMATION AND PROCESSING
6
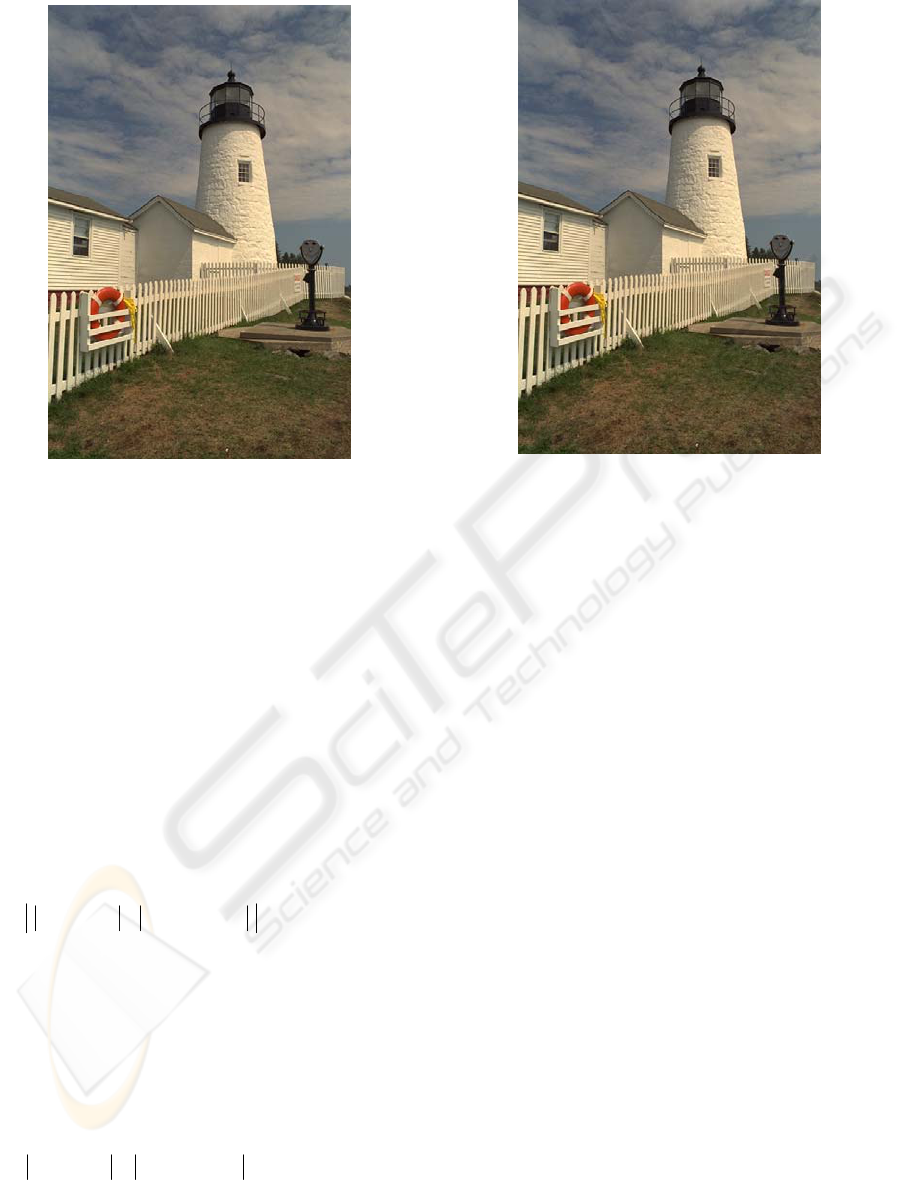
Figure 3: Original Lighthouse image.
2.2 Adaptive Algorithm
An indicator to determine the colour smoothness is
proposed as follows. Based on the idea of the hue
assumption (Cok 1987), we define that the colour is
smooth when (4) is satisfied when estimating a
missing green value at a blue pixel location. A
similar equation applies for the estimation of a
missing green value at a red pixel location. In this
case, when the difference between the variations in
blue and green is small, the hue assumption is valid,
and hence we can apply the highest (second) order
of extrapolation to obtain the best results.
Experimentally, a normalised value of 0.7 for
ε will
give satisfactory results for most images.
ε≤−−−
+++
GGBB
3X1X2XX
(4)
Otherwise, if the variation in blue (or red) is
greater than the variation in green (5), this may
indicate a colour edge in blue (or red) and so the hue
assumption does not apply. Hence the zero order is
preferred. In this case the application of the invalid
hue assumption in the estimation of the missing
colour pixel can be avoided.
3X1X2XX
GGBB
+++
−>−
(5)
Figure 4: Ideal selector output.
However, if the variation in green is greater than
the variation in blue, the first order is chosen
because this indicates that there is no colour edge in
blue, and so half of the small variation in blue will
be included to improve the accuracy in the
estimation of the green value as shown in (2).
Similarly, one estimate for each of the four
directions, namely up, down, left and right, can be
found by (1) to (5). The next step is to use a
classifier to select the best choice out of the four
candidates. Since a linear combiner, as used in other
methods (Kimmel 1999, Lu&Tan 2003) will blur an
edge, a median-based classifier (Li&Randhawa
2005a) which will preserve sharp edges is used
instead.
In the classifier stage, an orientation matrix for
every pixel is produced using the CFA image input.
This is used to indicate the possible orientation of an
edge for that pixel. The underlying assumption
made is that the neighbourhood orientation must be
aligned in a direction along an edge (Li&Randhawa
2005b).
The orientation matrix (Li&Randhawa 2005a) is
used to reject one sample before we apply median
filtering. This is because an odd window width for
the median filtering is preferred in order to avoid
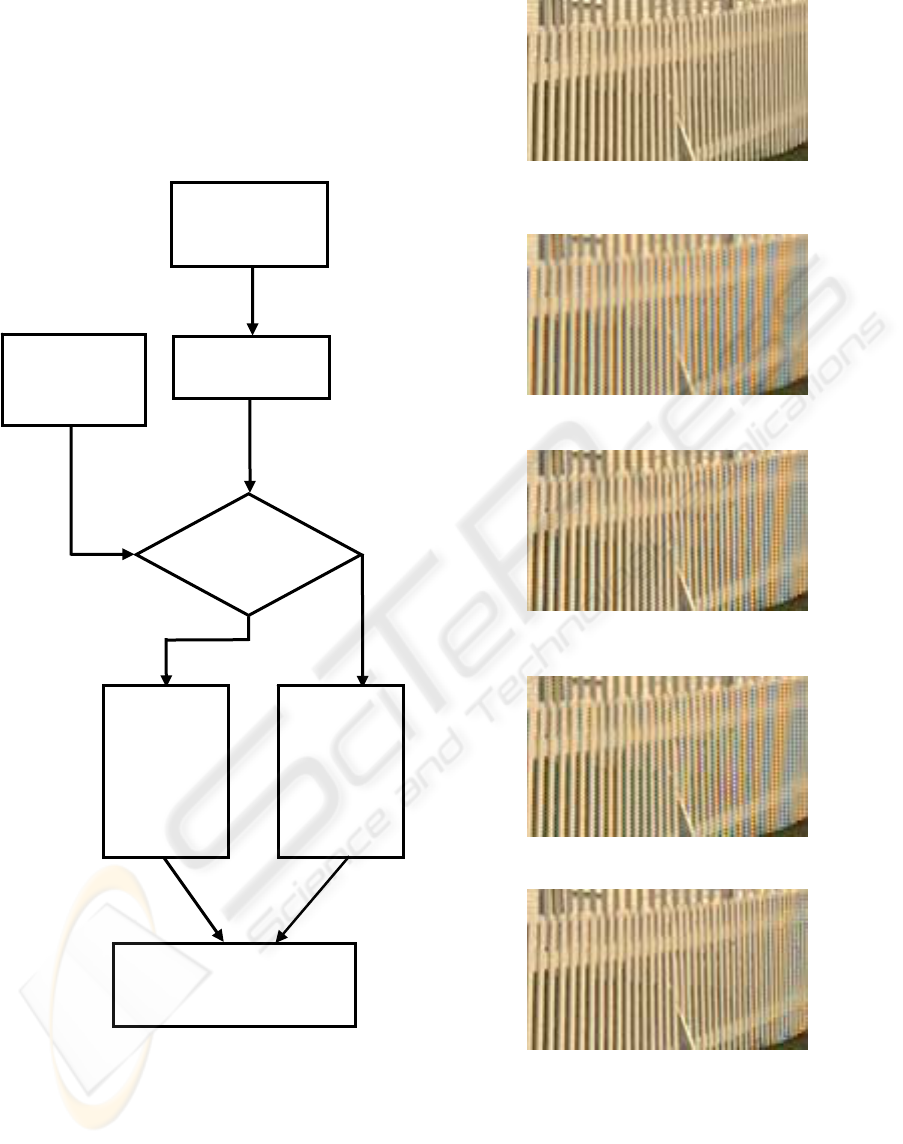
blurring an edge. The classifier algorithm is
depicted as a flowchart in Figure 5. If it is a ‘1’ in
the orientation matrix, a possible vertical edge exists
and hence one of the two estimates in the horizontal
direction will be rejected. Similarly for a ‘0’ in the
orientation matrix, we reject an estimate in the
CFA DEMOSAICKING BY ADAPTIVE ORDER OF APPROXIMATION
7
vertical direction. The one out of the two to be
rejected has the greatest difference in magnitude
from the median of the four extrapolated estimates.
3 RESULTS
To evaluate the performance of our method against
other demosaicking methods, the picket-fence region
of the Lighthouse image in Figure 3 was used. This
area represents a challenge for many demosaicking
methods due to the presence of many edges close
together. The image quality performance measures,
using normalized color difference (NCD)
(Plataniotis 2000) and mean squared difference
(MSE), of the various demosaicking methods:
Freeman (1988), Kimmel (1999), Hamilton (1997),
Plataniotis (2004), Lu&Tan (2003), and Gunturk
(2002), are tabulated as shown in Table 2. Our
proposed method, with
ε = 0.7, has the smallest error
value among all the methods. Figures 6 to 14 show
the sample demosaicked results from our proposed
method and other methods under comparison. This
supports our quantitative measures and illustrates
that our method is also visually superior to other
demosaicking methods as it has the least false
colours in the high-frequency picket-fence region.
Table 2: Image Quality Performance Measure.
Method NCD MSE
Bilinear 0.1036 24.65
Freeman 0.0587 14.75
Kimmel 0.0687 17.35
Hamilton 0.0268 8.85
Plataniotis 0.0637 16.25
Lu&Tan 0.0163 5.05
Gunturk 0.0153 4.01
Our Proposed
Method
0.0115 3.77
We also applied other types of images for the
evaluation of our proposed method as shown in
Figures 15 and 16. The results are tabulated in
Table 3, and they confirm that our method is
superior to other techniques.
4 CONCLUSION
An adaptive order of approximation algorithm has
been proposed for colour filter array demosaicking.
This method uses the colour smoothness of an image
to determine a suitable order of approximation. It
has been shown that our method outperforms other
techniques visually and quantitatively. Research on
its implementation for real-time processing is
underway.
Table 3: NCD results for the demosaicking methods.
NCD
Method Statue Image
Red Door
Image
Bilinear 9.9222E-03 5.4689E-03
Freeman 5.9773E-03 4.1314E-03
Kimmel 7.2663E-03 5.8250E-03
Hamilton 6.9636E-03 4.0047E-03
Plataniotis 371.35E-03 530.98E-03
Lu&Tan 5.5855E-03 4.6519E-03
Gunturk 5.3888E-03 4.7444E-03
Our Proposed
Method
5.1359E-03 3.9169E-03
REFERENCES
Bayer, B.E. (1976): Color Imaging Array. US Patent 3
971 065.
Cok, D.R. (1987): Signal Processing Method and
Apparatus for Producing Interpolated Chrominance
Values in a Sampled Color Image Signal. US Patent 4
642 678.
Freeman, W. T. (1988): Median Filter for Reconstructing
Missing Colour Samples. US Patent 4 724 395.
Gunturk, B. K., Altunbasak, Y. and Mersereau, R. M.
(2002): Colour Plane Interpolation Using Alternation
Projections. IEEE Transactions on Image Processing,
11:997-1013.
Hamilton Jr., J. F. and Adams Jr., J. E. (1997): Adaptive
Colour Plan Interpolation in Single Sensor Colour
Electronic Camera. US Patent 5 629 734.
Kimmel, R. (1999): Demosaicing: Image Reconstruction
from Colour CCD Samples. IEEE Transactions on
Image Processing, 8:1221-1228.
Li, J.S.J. and Randhawa, S. (2005a): High Order
Extrapolation using Taylor Series for Color Filter
Array Demosaicing. Lecture Notes in Computer
Science, M. Kamel and A. Campilho, Eds., Springer-
Verlag, 2005, 3656:703-711.
Li, J.S.J. and Randhawa, S. (2005b): Improved Accuracy
for Colour Filter Array Demosaicking using High
Order Extrapolation. Proceedings of ISSPA 2005,
Sydney, 331-334.
Lu, W. and Tan, Y.-P. (2003): Colour Filter Array
Demosaicking: New Method and Performance
Measures. IEEE Transactions on Image Processing,
12:1194-1210.
Plataniotis, K. N. and Venetsanopoulos, A. N. (2000):
Colour Image Processing and Applications, Springer
Verlag.
Plataniotis, K. N. and Lukac, R. (2004): An Efficient
Demosaicing Approach with a Global Control of
Correction Steps. IEEE International Conference on
VISAPP 2006 - IMAGE FORMATION AND PROCESSING
8
Acoustics, Speech, and Signal Processing
Proceedings, pp. III 469-472.
Randhawa, S. and Li, J.S.J. (2005): CFA Demosaicking
with Improved Colour Edge Preservation. Proceedings
of IEEE Tencon’05, 21-24 November 2005,
Melbourne Australia.
Figure 5: Flowchart of Classifier.
Figure 6: Original picket-fence from Lighthouse image.
Figure 7: Bilinear Output.
Figure 8: Freeman Output.
Figure 9: Kimmel Output.
Figure 10: Hamilton Output.
no
Orientation
= 1?
y
es
Classifer output =
Median{remaining 3
Extrapolated Estimates
}
Orientation
matrix of
CFA image
Proposed
Adaptive
Al
g
orith
m
4 Extrapolated
Estimates
Reject one
vertical
estimate
which is
furthest
from the
median
Reject one
horizontal
estimate
which is
furthest
from the
median
CFA DEMOSAICKING BY ADAPTIVE ORDER OF APPROXIMATION
9
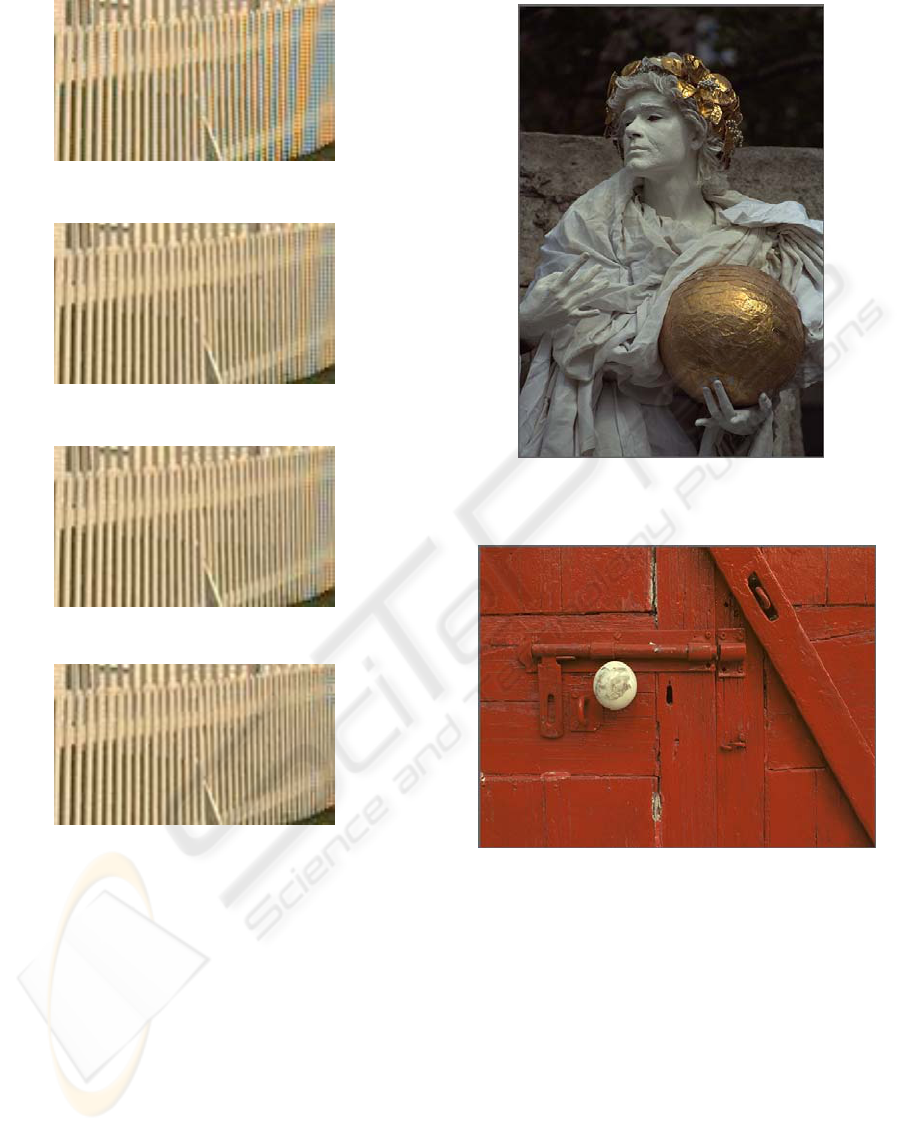
Figure 11: Plataniotis Output.
Figure 12: Lu&Tan output.
Figure 13: Gunturk output.
Figure 14: Our proposed method.
Figure 15: Statue Image.
Figure 16: Red Door Image.
VISAPP 2006 - IMAGE FORMATION AND PROCESSING
10
