
CORTICAL OBJECT SEGREGATION AND CATEGORIZATION
BY MULTI-SCALE LINE AND EDGE CODING
Jo
˜
ao Rodrigues
University of Algarve - Escola Superior de Tecnologia
Campus da Penha, 8005-139 Faro, Portugal
J. M. Hans du Buf
University of Algarve - Vision Laboratory - FCT
Campus de Gambelas, 8005-139 Faro, Portugal
Keywords:
Visual cortex, line and edge detection, multi-scale, visual reconstruction, recognition, categorization.
Abstract:
In this paper we present an improved scheme for line and edge detection in cortical area V1, based on re-
sponses of simple and complex cells, truly multi-scale with no free parameters. We illustrate the multi-scale
representation for visual reconstruction, and show how object segregation can be achieved with coarse-to-fine-
scale groupings. A two-level object categorization scenario is tested in which pre-categorization is based on
coarse scales only, and final categorization on coarse plus fine scales. Processing schemes are discussed in the
framework of a complete cortical architecture.
1 INTRODUCTION
The visual cortex detects and recognizes objects by
means of the “what” and “where” subsystems. The
“bandwidth” of these systems is limited: only one ob-
ject can be attended at any time (Rensink, 2000). In
a current model (Deco and Rolls, 2004), the ventral
what system receives input from area V1 which pro-
ceeds through V2 and V4 to IT
1
. The dorsal where
system connects V1 and V2 through MT to area PP.
Both systems are controlled, top-down, by attention
and short-term memory with object representations
in PF, i.e. a what component from PF46v to IT and
a where component from PF46d to PP. The bottom-
up (visual input code) and top-down (expected object
and position) data streams are necessary for obtaining
size, rotation and translation invariance.
Signal propagation from the retinas through the
LGN and areas V1, V2 etc., including feature extrac-
tions in V1 and groupings in higher areas, takes time.
Object recognition is achieved in 150–200 msec, but
category-specific activation of PF cortex starts after
about 100 msec (Bar, 2004). In addition, IT cortex
first receives coarse-scale information and later fine-
scale information. Apparently, one very brief glance
is sufficient for the system to develop a gist of the
1
IT = inferior-temporal cortex, MT = medial tempo-
ral, PP = posterior parietal, PF = prefrontal, LGN = lateral
geniculate nucleus.
contents of an image. This implies that some infor-
mation propagates very rapidly and directly to “at-
tention” in PF in order to pre-select possible object
templates and positions that then propagate down the
what and where systems. This process we call ob-
ject categorization, which cannot be obtained by the
CBF model (Riesenhuber and Poggio, 2000) because
categorization (e.g. a cat) is obtained by grouping de-
tection cells (cat1, cat2, cat3). In other words, catego-
rization would be obtained after recognition. In con-
trast, the LF model (Bar, 2004; Oliva et al., 2003) as-
sumes that categorization is obtained before recogni-
tion: Low Frequency information that passes directly
from V1/V2 to PF, although the LF information actu-
ally proposed consists of lowpass-filtered images but
not e.g. outputs of simple and complex cells in V1
tuned to low spatial frequencies.
In this paper we present an improved scheme for
multi-scale line/edge extraction in V1, and explore
the importance of this multi-scale representation for
object segregation and categorization. Since exper-
iments with possible LF models based on lowpass-
filtered images—following (Bar, 2004)—gave rather
disappointing results, which is due to smeared blobs
of objects that lack any structure, we propose that cat-
egorization is based on coarse-scale line/edge repre-
sentations. The multi-scale keypoint representation
also extracted in V1, which was shown to be very im-
portant for Focus-of-Attention and e.g. face detection
(Rodrigues and du Buf, 2005a; Rodrigues and du Buf,
5
Rodrigues J. and M. Hans du Buf J. (2006).
CORTICAL OBJECT SEGREGATION AND CATEGORIZATION BY MULTI-SCALE LINE AND EDGE CODING.
In Proceedings of the First International Conference on Computer Vision Theory and Applications, pages 5-12
DOI: 10.5220/0001365600050012
Copyright
c
SciTePress

2005b), will not be employed here. This means
that different models, including simple, complex and
end-stopped cells (Heitger et al., 1992), texture in-
hibition (Grigorescu et al., 2003), keypoint detec-
tion (Rodrigues and du Buf, 2004b), line/edge detec-
tion (Grigorescu et al., 2003; Rodrigues and du Buf,
2004b; van Deemter and du Buf, 1996; Elder and
Zucker, 1998), disparity (Fleet et al., 1991; Rodrigues
and du Buf, 2004a), figure-ground segregation (Hupe
et al., 2001; Zhaoping, 2003), Focus-of-Attention (Itti
and Koch, 2001; Rodrigues and du Buf, 2005b) and
face/object recognition (Smeraldi and Bigun, 2002)
must be integrated into a multi-feature and multi-layer
framework, e.g. (Rasche, 2005; Hubel, 1995).
In Section 2 we present line/edge detection. Sec-
tion 3 deals with the multi-scale representation, and
Section 4 with visual reconstruction. In Section 5 a
possible scheme for figure-ground segregation is pre-
sented, followed by categorization in Section 6. We
conclude with a discussion in Section 7.
2 LINE AND EDGE DETECTION
Gabor quadrature filters provide a model of receptive
fields (RFs) of cortical simple cells, e.g. (Grigorescu
et al., 2003; Rodrigues and du Buf, 2004b).
We apply filters with an aspect ratio of 0.5 and half-
response width of one octave. The scale s will be
given by λ, the wavelength, in pixels. We can ap-
ply a linear scaling with hundreds of quasi-continuous
scales, although we will exploit much less scales here.
Responses of even and odd simple cells, which cor-
respond to the real and imaginary parts of a Gabor fil-
ter, are denoted by R
E
s,i
(x, y) and R
O
s,i
(x, y), s being
the scale, i the orientation (θ
i
= iπ/(N
θ
− 1)) and
N
θ
the number of orientations (here we use N
θ
= 8).
Responses of complex cells are modelled by the mod-
ulus C
s,i
(x, y) = [{R
E
s,i
(x, y)}
2
+ {R
O
s,i
(x, y)}
2
]
1/2
.
A basic scheme for single-scale line and edge de-
tection based on responses of simple cells works as
follows (van Deemter and du Buf, 1996): a positive
(negative) line is detected where R
E
shows a local
maximum (minimum) and R
O
shows a zero crossing.
In the case of edges the even and odd responses are
swapped. This gives 4 possibilities for positive and
negative events. An improved scheme (Rodrigues and
du Buf, 2004b) consists of combining responses of
simple and complex cells, i.e. simple cells serve to de-
tect positions and event types, whereas complex cells
are used to increase the confidence. Since the use of
Gabor modulus (complex cells) implies a loss of pre-
cision at vertices (du Buf, 1993), increased precision
was obtained by considering multiple scales (neigh-
boring micro-scales).
The algorithms described above work reasonably
well but there remain a few problems: (a) either one
scale is used or only a very few scales for increas-
ing confidence, (b) some parameters must be opti-
mized for specific input images or even as a function
of scale, (c) detection precision can be improved, and
(d) detection continuity at curved lines/edges must be
guaranteed.
Here we present an improved algorithm with no
free parameters, truly multi-scale, and with new so-
lutions for problems (c) and (d). With respect to pre-
cision, simple and complex cells respond beyond line
and edge terminations, for example beyond the cor-
ners of a rectangle. In addition, at line or edge cross-
ings, detection leads to continuity of the dominant
events and gaps in the sub-dominant events. These
gaps must be reduced in order to reconstruct continu-
ity. Both problems can be solved by introducing new
inhibition schemes, like the radial and tangential ones
used in the case of keypoint operators (Rodrigues and
du Buf, 2004b). Here we use lateral (L) and cross-
orientation (C) inhibition, defined as
I
L
s,i
(x, y) = [C
s,i
(x + dC
s,i
, y + dS
s,i
)
−C
s,i
(x − dC
s,i
, y − dS
s,i
)]
+
+ [C
s,i
(x − dC
s,i
, y − dS
s,i
)
−C
s,i
(x + dC
s,i
, y + dS
s,i
)]
+
and
I
C
s,i
(x, y) =
C
s,(i+N
θ
/2)
(x + 2dC
s,i
, y + 2dS
s,i
)
−2.C
s,i
(x, y)
+C
s,(i+N
θ
/2)
(x − 2dC
s,i
, y − 2dS
s,i
)
+
,
where [·]
+
denotes suppression of negative values,
(i + N
θ
/2) ⊥ i, C
s,i
= cos θ
i
, S
s,i
= sin θ
i
and d = 0.6s. Inhibition is applied to com-
plex cell responses, where β controls the strength
of the inhibition (we use β = 1.0), i.e.
ˆ
C
s,i
=
C
s,i
(x, y) − β(I
L
s,i
(x, y) + I
C
s,i
(x, y))
.
Line/edge detection is achieved by constructing a
few cell layers on top of simple and complex cells.
The first layer serves to select active regions and dom-
inant orientations. At each position, responses of
complex cells are summed (
ˆ
C
s
=
P
N
θ
−1
i=0
ˆ
C
s,i
), and
at positions where
ˆ
C
s
> 0 an output cell is activated.
At active output cells, the dominant orientation is se-
lected by gating one complex cell on the basis of non-
maximum suppression of
ˆ
C
s,i
. The gating is con-
firmed or corrected by excitation/inhibition of dom-
inant orientations in a local neighborhood.
In the second layer, event type and position are de-
termined on the basis of active output cells (1st layer)
and gated simple and complex cells. A first cell com-
plex checks simple cells R
E
s,i
and R
O
s,i
for a local max-
imum (or minimum by rectification) using a dendritic
VISAPP 2006 - IMAGE UNDERSTANDING
6
field size of ±λ/4, λ being the wavelength of the sim-
ple cells (Gabor filter). The active output cell is inhib-
ited if there is no maximum or minimum. A second
cell complex does exactly the same on the basis of
complex cells. A third cell complex gates four types
of zero-crossing cells on the basis of simple cells,
again on ±λ/4. If there is no zero-crossing, the output
cell is inhibited. If there is a zero-crossing, the active
output cell at the position of the zero-crossing cell de-
termines event position and the active zero-crossing
cell determines event type.
In the third layer, the small loss of accuracy due to
the use of complex cells in the second layer is com-
pensated. This is done by correcting local event con-
tinuity, considering the information available in the
second layer, but by using excitation of output cells
by means of grouping cells that combine simple and
complex cells tuned to the same and two neighboring
orientations. The latter process is an extension of lin-
ear grouping (van Deemter and du Buf, 1996) and a
simplification of using banana wavelets (Kr
¨
uger and
Peters, 1997). In the same layer event type is cor-
rected in small neighborhoods, restoring type conti-
nuity, because the cell responses may be distorted by
interference effects when two events are very close
(du Buf, 1993).
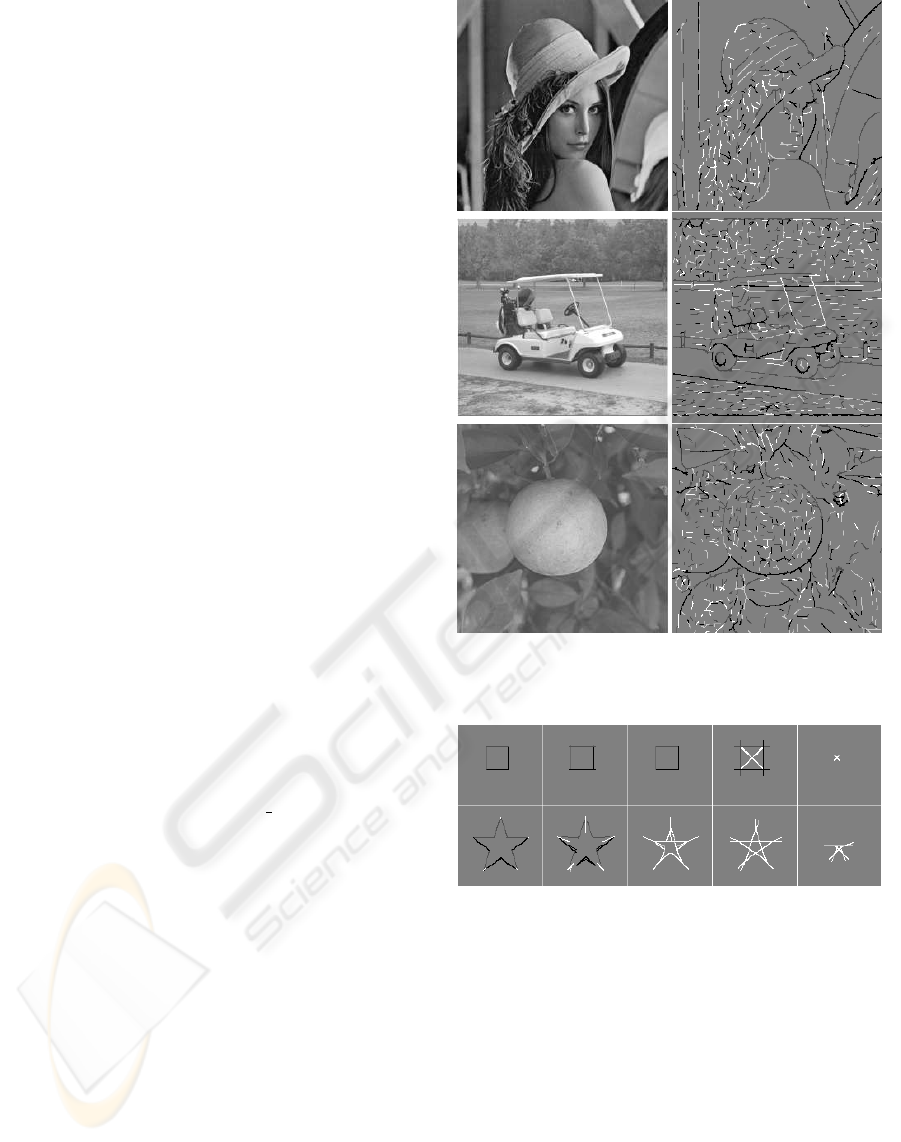
Figure 1 shows three input images together with
fine-scale detection results in which positive and neg-
ative lines and edges are coded by different gray
levels. Detection accuracy is very good and there
are many small events due to low-contrast textures—
Fig. 1 does not show event amplitudes—and the
fact that there is no threshold value in the detection
scheme. For comparing results with those obtained
by standard, edge-only (!) detection algorithms we
refer to (Heath et al., 2000) and
http://marathon.csee.usf/edge/edge
detection.html
3 MULTIPLE SCALES
For illustrating scale space we can create an almost
continuous, linear scaling with hundreds of scales on
λ = [4, 52] , but here we will present only a few
scales to show complications. Figure 2 shows events
detected at five scales in the case of ideal, solid square
and star objects. At fine scales (at the left) the edges
of the square are detected, as are most parts of the
star, but not at the very tips of the star. This illustrates
an important difference between normal computer vi-
sion and developing cortical models. The latter must
be able to construct brightness maps, and at the tips of
the star, where two edges converge, there are very fine
lines. The same effect occurs at coarser scales, until
entire triangles are detected as lines and even pairs
of opposite triangles (at the right). In the case of the
Figure 1: Fine-scale line/edge detection.
Figure 2: Multi-scale representation of a square and a star,
left to right λ = {4, 12, 18, 24, 40}.
square, lines will be detected at diagonals, which van-
ish, also with small amplitudes, at very coarse scales.
Figure 3 shows, left to right, multi-scale event de-
tection in the case of a leaf with, top to bottom, differ-
ent criteria for scale stability: single scale (no stability
check), micro-scale stability (Rodrigues and du Buf,
2004b) over a few neighboring scales, and stability
over 10 and 40 scales. This illustrates that detected
lines and edges are stable over many scales, which is
very important for tasks like visual reconstruction and
object recognition.
CORTICAL OBJECT SEGREGATION AND CATEGORIZATION BY MULTI-SCALE LINE AND EDGE CODING
7
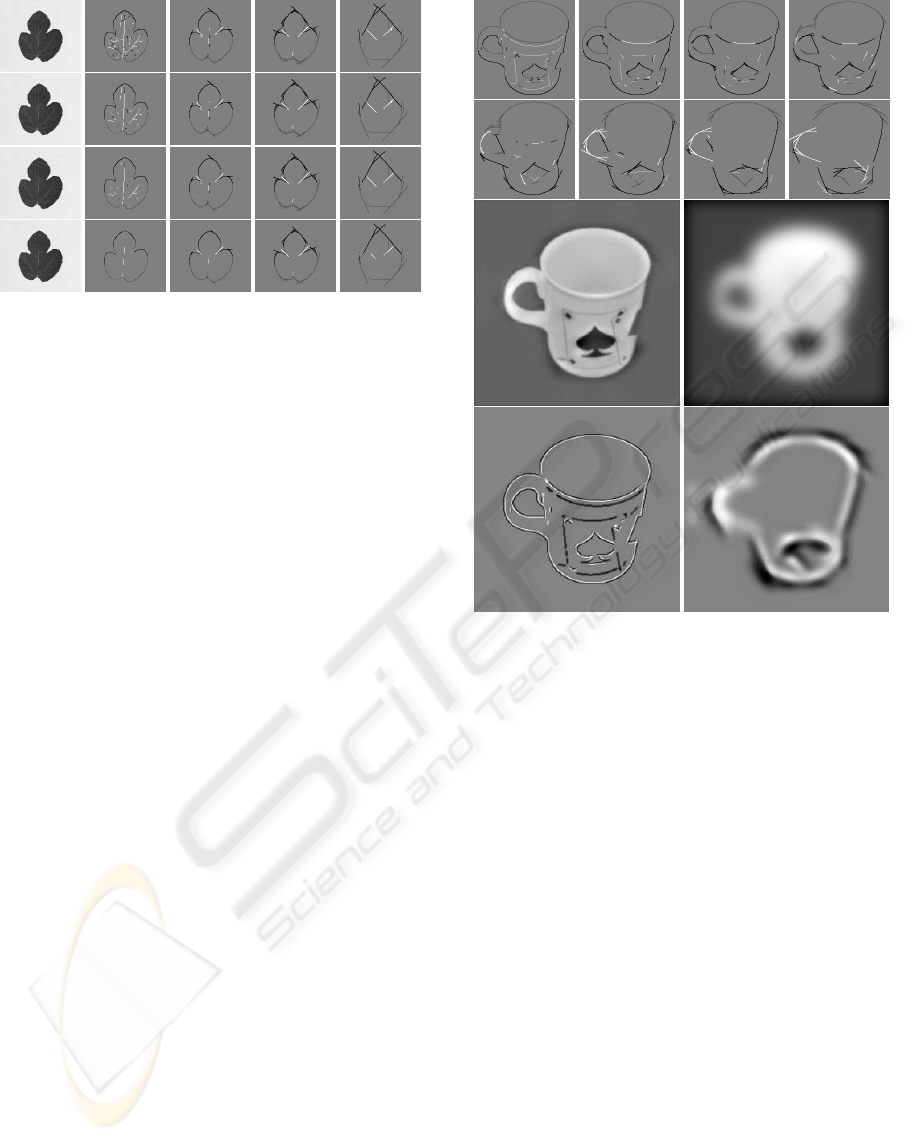
Figure 3: Left to right: original and multi-scale event de-
tection (λ = {4, 9, 16, 36}); top to bottom: single scale,
micro-scale stability, and stability over 10 and 40 scales.
4 VISUAL RECONSTRUCTION
Image reconstruction can be obtained by assuming
one lowpass filter plus a complete set of (Gabor)
wavelets that cover the entire frequency domain—this
concept is exploited in image coding. The goal of our
visual system is to detect objects, with no need, nor
capacity, to reconstruct a complete image of our vi-
sual environment, see change blindness and the lim-
ited “bandwidth” of the what and where subsystems
(Rensink, 2000). Yet, the image that we perceive in
terms of brightness must somehow be created. A nor-
mal image coding scheme, for example by summing
responses of simple cells, requires accumulation in
one cell layer which contains a brightness map, but
this would require yet another “observer” of this map
in our brain. A solution for this dilemma is to assume
that detected lines and edges are interpreted symbol-
ically: an active “line cell” is interpreted as a Gaus-
sian intensity profile with a certain orientation, ampli-
tude and scale, the size of the profile being coupled to
the scale of the underlying simple and complex cells.
An active “edge cell” is interpreted the same way,
but with a bipolar, Gaussian-truncated, error-function
profile. As for image coding, this representation must
be complemented with a lowpass filter, a process that
happens to exist by means of retinal ganglion cells
with photoreceptive dendritic fields not (in)directly
connected to rods and cones (Berson, 2003).
One brightness model (du Buf, 1994) is based
on the symbolic line/edge interpretation. It explains
Mach bands (Pessoa, 1996) by the fact that responses
of simple cells do not allow to distinguish between
lines and ramp edges, and it was shown to be able
to predict many brightness illusions such as simulta-
neous brightness contrast and assimilation, which are
two opposite induction effects (du Buf and Fischer,
Figure 4: Multi-scale representation of a mug (top). Recon-
struction (middle-left) by combining lowpass (middle-right)
and line/edge interpretations (bottom).
1995). Here we will not go into more detail; we will
only illustrate the symbolic reconstruction process in
2D (the model referred to above was tested in 1D).
Figure 4 (top) shows the multi-scale line/edge rep-
resentation in the case of a mug that will be used
in categorization (Fig. 7 shows the original image).
Figure 4 also illustrates visual reconstruction based
on a lowpass-filtered image (middle-right), symbolic
line/edge interpretations at six scales, two of which
are shown (bottom), and the combination (middle-
left). The fuzzy contour of the lowpass image is cor-
rected by adding the line/edge interpretations. Using
more scales leads to better reconstructions, but the rel-
ative weighting of the lowpass and scale components
requires further investigation.
5 OBJECT SEGREGATION
Until here we have illustrated multi-scale line/edge
detection in area V1 and the symbolic interpretation
for reconstruction, but the goal of the visual cor-
VISAPP 2006 - IMAGE UNDERSTANDING
8
tex is to detect and recognize objects by means of
the what and where systems. An essential step, re-
lated to object categorization, is figure-ground segre-
gation. Figures 2, 3 and 4 show typical event maps
of different objects, with detail at fine scales and re-
duced, “sketchy” information at coarse scales. At a
coarse level, each individual event (group of respond-
ing line/edge cells) or connected group of events cor-
responds to one object. Each event at a coarse scale
is related to events at one finer scale, which can be
slightly displaced or rotated. This relation is mod-
eled by downprojection using grouping cells with a
dendritic field, the size of which defines the region
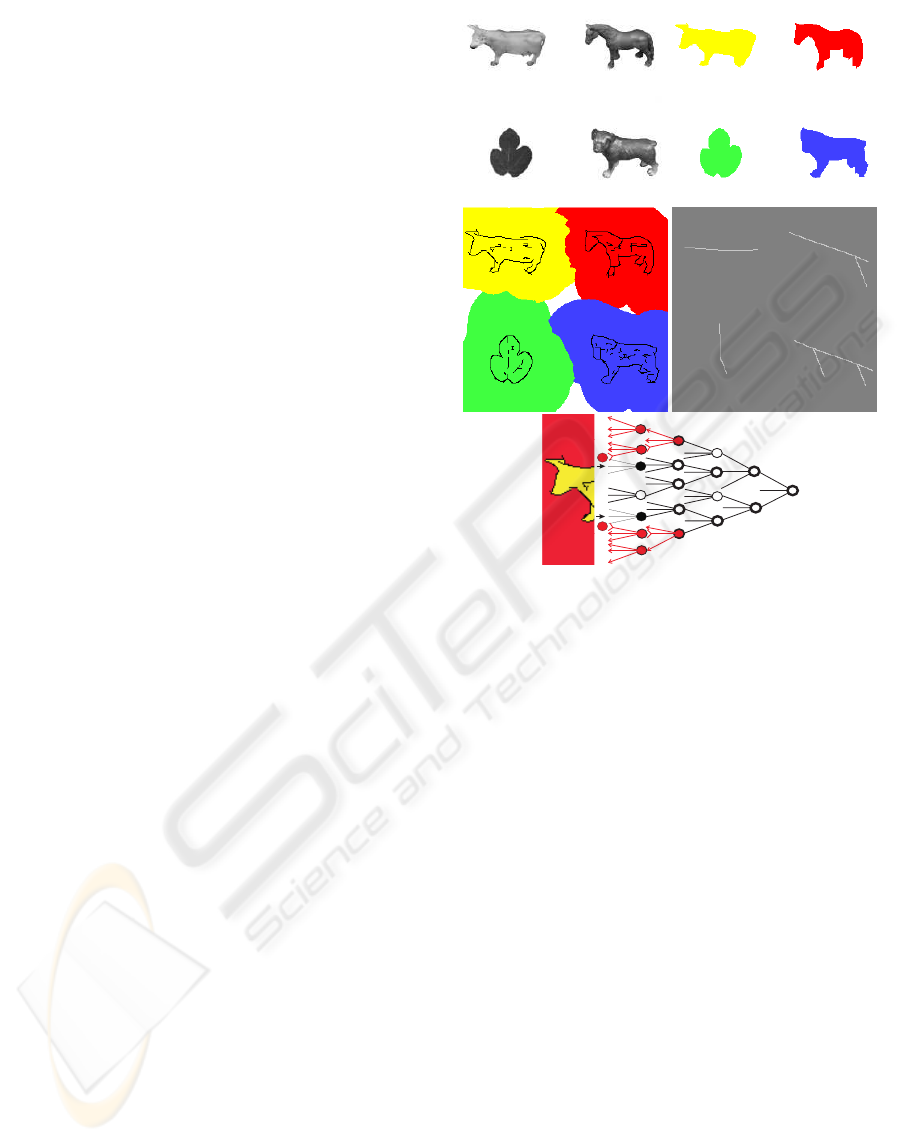
of influence. Responding event cells at all scales ac-
tivate grouping cells, which yields regions of influ-
ence (Fig. 5 middle-left). This coarse-to-fine-scale
process is complemented by inhibition: other group-
ing cells at the finest scale are activated by respond-
ing event cells at that scale and these grouping cells
excitate the grouping cells at the one coarser scale
but inhibit active grouping cells outwards, shown red
in Fig. 5 (bottom). This results in a figure-ground
map at the first coarser scale “above” the finest scale
(Fig. 5 top-right). Results shown were obtained with
λ = [4, 52], ∆λ = 4.
A process in V1 as described above can be part of
the where system, but it needs to be embedded into
a complete architecture (Deco and Rolls, 2004). In
addition, when two objects are very close, they will
become connected at coarse scales and separation is
only possible by the what system that checks features
(lines, edges, keypoints) of individual objects at finer
scales. In other words, object segregation is likely
to be driven by “attention” in PF cortex, for exam-
ple by means of templates that consist of coarse-scale
line/edge representations, and this process is related
to object categorization.
6 OBJECT CATEGORIZATION
Object recognition is a clearly defined task: a cer-
tain cat, like the neighbors’ red tabby called Toby,
is recognized or not. Categorization is more diffi-
cult to define because there are different levels, for
example (a) an animal, (b) one with four legs, (c) a
cat, and (d) a red tabby, before deciding between our
own red tabby called Tom and his brother Toby living
next door. It is as if we were developing categoriza-
tion by very young children: once they are familiar
with the family’s cat, every moving object with four
legs will be a cat. With age, more features will be
added. Here we explain our experiments with a two-
level approach; three types of objects (horses, cows,
dogs) are first grouped (animal), which we call pre-
categorization, after which categorization determines
Figure 5: Input image with four objects (top-left), coarse-
scale representation (middle-right; λ = 52), regions of in-
fluence (middle-left), final segregation (top-right), and acti-
vation/inhibition of grouping cells (bottom).
the type of animal. Instead of creating group tem-
plates in memory on the basis of lowpass-filtered im-
ages as proposed by the LF model (Bar, 2004; Oliva
et al., 2003), we will exploit coarse-scale line and
edge templates. In addition, pre-categorization will
be based on line/edge templates of contours, i.e. solid
objects, available through segregation (Fig. 5), to gen-
eralize shape and to eliminate surface detail.
We used the ETH-80 database (Leibe and Schiele,
2003), in which all images are cropped such that
they contain only one object, centered, against a
20% background. Images were rescaled to a size of
256 × 256 pixels. We selected 10 different images of
8 groups (dogs, horses, cows, apples, pears, tomatos,
cups/mugs and cars), in total 80 images. Figure 7
shows examples. Because views of objects are
also normalized (e.g. all animals with the head to
the left), and because different objects within each
group are characterized by about the same line/edge
representations at coarser scales, group templates
can be constructed by combining randomly selected
images. The multi-scale line/edge representation was
computed at 8 scales equally spaced on λ = [4, 32].
CORTICAL OBJECT SEGREGATION AND CATEGORIZATION BY MULTI-SCALE LINE AND EDGE CODING
9

Pre-categorization
Here the goal is to select one of the groups: an-
imal, fruit, cup or car. We used the three coarsest
scales with λ equal to 24, 28 and 32 pixels. Group
templates were created by combining all images
(30 animals, 30 fruits, 10 cups, 10 cars), and by
random selections of half (15 and 5) and one third
(10 and 3) of all images. By using more images, a
better generalization can be obtained, for example the
legs of animals can be straight down or more to the
front (left). Figure 6 shows examples of segregated
objects and line/edge templates when using half of
all images. For each group template, at each of the
three scales, a positional relaxation area was created
around each responding event cell, by assuming
grouping cells with a dentritic field size coupled to
the size of underlying complex cells (Bar, 2003).
These grouping cells sum the occurence of events
in the input images around event positions in the
templates, a sort of local correlation, and activities of
all grouping cells were then grouped together (global
correlation). The final groupings were compared over
the 4 templates, scale by scale, and the template with
maximum response was selected. Finally, the tem-
plate with the maximum number of correspondences
over the 3 scales was selected. The following table
summarizes results (misclassified images) in the form
mean(st. deviation):
template
all half third
construction
30/10 15/5 10/3
no relaxation 0 5.7(0.6) 8.0(1.7)
with relaxation
0 3.0(1.0) 4.3(0.6)
Obviously, positional relaxation leads to better
results when not all images are used in building the
templates, and using more images is always better.
Using relaxation and more images increases shape
generalization, however with the risc of running
into over-generalization, which did not occur in our
tests. On the average, different random selections
gave very similar results when the three sub-groups
(horses/cows/dogs and apples/pears/tomatos) were
about equally represented. Most errors occurred,
with and without relaxation, between car/animal and
cup/fruit.
Categorization
After pre-categorization, assuming zero errors,
there remains one problem in our test scenario: the
animal group must be separated into horse, cow and
dog, and the fruit group into apple, pear and tomato.
We could have used 6 templates (cups and cars have
already been categorized), but we experimented
with 8 templates and all 80 images, and applied the
multi-scale line/edge representations at all 8 scales
(λ equal to 4, 8, 12, 16, 20, 24, 28 and 32) of the real
input images (not solid objects). We did this because
categorization is supposed to be done after pre-
categorization, i.e., when also fine-scale information
has propagated to IT cortex (see Introduction).
Templates were constructed as above with random
selections. Final groupings (global correlation) were
compared over the 8 scales and the one with most co-
herent (maximum) correspondences was selected (in
the case of 4–4 we simply took the last one). The fol-
lowing table presents results (misclassifications) ob-
tained with positional relaxation:
template
all half third
construction
10 5 3
errors 0 9.3(2.1) 12.7(4.0)
Again, by using more images in building the tem-
plates, generalization is improved and the number of
mis-categorized images decreases. When using half
(5) or even one third (3) of all images, all car and cup
images were correctly categorized, and no fruits were
categorized as animals and vice versa. Typical mis-
categorizations were dog/cow, horse/dog, horse/cow
and apple/tomato. Figure 7 shows, apart from exam-
ples of images and group templates created by com-
bining 5 images (top), more difficult images with a
white triangle in the bottom-right corner. It should be
stressed that this is an extremely difficult test, because
no color information has been used and apples and
tomatos have the same, round shape. By contrast, all
pear images, with a tapered shape, have been correctly
categorized. The fact that most problems occurred
with the animals was expected, given the minute dif-
ferences of heads, necks and tails (Fig. 7). Catego-
rization is the final step before recognition in which
attention shifts to finer scales that reflect minute dif-
ferences. Nevertheless, only about 9 errors in 80
images (the 50/50 “training and testing” scenario) is
a very promising starting point for refining the al-
gorithms, for example by using a more hierarchical
scenario with more categorization steps, in which at-
tention is systematically steered from coarse to fine
scales.
7 DISCUSSION
Computer vision for realtime applications requires
tremendous computational power because all images
must be processed from the first to the last pixel.
Probing specific objects on the basis of already ac-
quired context may lead to a significant reduction of
processing. This idea is based on a few concepts
from our visual cortex (Rensink, 2000): (1) our phys-
ical surround can be seen as memory, i.e. there is no
need to construct detailed and complete maps, (2) the
bandwidth of the what and where systems is limited,
VISAPP 2006 - IMAGE UNDERSTANDING
10
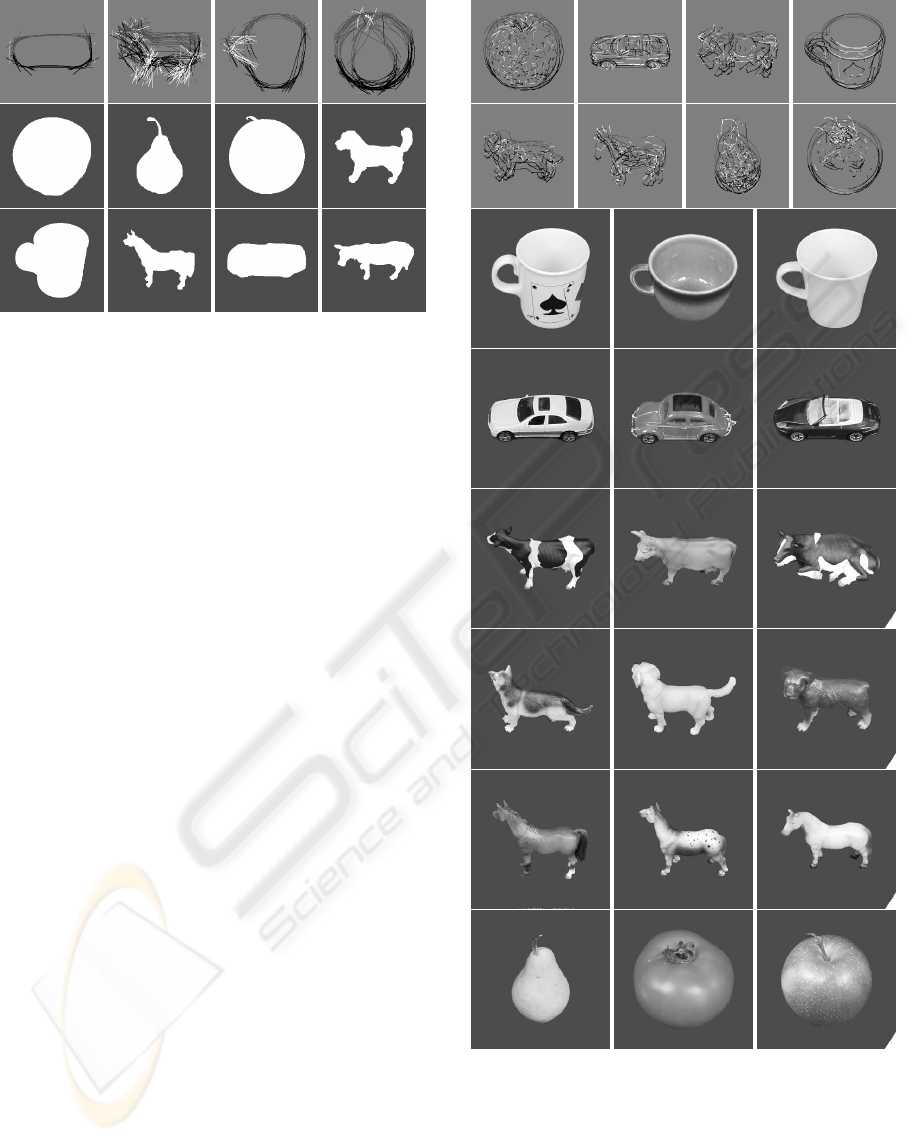
Figure 6: Top: templates for pre-categorization based on 15
and 5 images at λ = 32. Bottom: examples of segregated
objects.
i.e. only one object can be probed at any time, and
(3) bottom-up, low-level feature extraction is comple-
mented by top-down hypothesis testing, i.e. there is
a rapid convergence of activities in dendritic/axonal
cell connections from V1 to PF cortex.
In previous papers we have shown that keypoint
scale-space is ideal for constructing saliency maps
for Focus-of-Attention (FoA) (Rodrigues and du Buf,
2005a), and that faces can be detected by grouping fa-
cial landmarks defined by keypoints at eyes, nose and
mouth (Rodrigues and du Buf, 2005b). On the other
hand, line/edge scale-space may be ideal for object
and face recognition. Obviously, these two represen-
tations in V1 complement each other and both can be
used for object detection, categorization and recogni-
tion. Our impression is that keypoints are used more
in the fast where system (FoA), whereas lines and
edges are exploited more in the slower what system.
However, this still needs to be tested in the context of
a complete cortical architecture with ventral and dor-
sal data streams that link V1 to attention in PF cortex
(Deco and Rolls, 2004).
In this paper we presented an improved scheme
for line and edge detection in V1, and illustrated the
multi-scale representation for visual reconstruction.
This representation, in combination with a lowpass
filter, yields a reconstruction that is suitable for ex-
tending our brightness model (du Buf and Fischer,
1995) from 1D to 2D, for example for modelling
brightness illusions.
We also presented a plausible scheme for object
segregation, which results in binary, solid objects that
can be used to obtain a rapid pre-categorization on the
basis of coarse-scale information only. This approach
works much better if compared to using lowpass-
filtered images, i.e., smeared blobs that lack object-
specific characteristics (Bar, 2004; Oliva et al., 2003).
Figure 7: Top: templates for final categorization based on 5
images at λ = 8. Bottom: examples of object images, the
more difficult ones with a white triangle in the bottom-right
corner.
Final categorization was tested by using real objects
and more scales, coarse and fine. The results obtained
CORTICAL OBJECT SEGREGATION AND CATEGORIZATION BY MULTI-SCALE LINE AND EDGE CODING
11

are very promising, taking into account that the tested
schemes are extremely simple. Only a fraction of
available information, i.e., the line/edge code with-
out amplitude and color information, and without a
linking of scales as explored in the segregation model,
has been used so far. More extensive tests are being
conducted, with more images and objects, concentrat-
ing on a linking of scales and a steering of attention
from coarse to fine scales. Such improved schemes
are expected to yield better results, from very fast de-
tection (where) to slower categorization (where/what)
to recognition (what). The balance between keypoint
and line/edge representations is an important aspect.
ACKNOWLEDGEMENTS
This research is partly financed by PRODEP III Me-
dida 5, Action 5.3, and by the FCT program POSI,
framework QCA III.
REFERENCES
Bar, M. (2003). A cortical mechanism for triggering top-
down facilitation in visual object recognition. J. Cogn.
Neuroscience, (15):600–609.
Bar, M. (2004). Visual objects in context. Nature Reviews:
Neuroscience, 5:619–629.
Berson, D. (2003). Strange vision: ganglion cells as cir-
cadian photoreceptors. TRENDS in Neurosciences,
26(6):314–320.
Deco, G. and Rolls, E. (2004). A neurodynamical cortical
model of visual attention and invariant object recogni-
tion. Vision Res., (44):621–642.
du Buf, J. (1993). Responses of simple cells: events, inter-
ferences, and ambiguities. Biol. Cybern., 68:321–333.
du Buf, J. (1994). Ramp edges, Mach bands, and the func-
tional significance of simple cell assembly. Biol. Cy-
bern., 70:449–461.
du Buf, J. and Fischer, S. (1995). Modeling brightness per-
ception and syntactical image coding. Optical Eng.,
34(7):1900–1911.
Elder, J. and Zucker, S. (1998). Local scale control for
edge detection and blur estimation. IEEE Tr. PAMI,
20(7):699–716.
Fleet, D., Jepson, A., and Jenkin, M. (1991). Phase-based
disparity measurement. CVGIP: Image Understand-
ing, 53(2):198–210.
Grigorescu, C., Petkov, N., and Westenberg, M. (2003).
Contour detection based on nonclassical receptive
field inhibition. IEEE Tr. IP, 12(7):729–739.
Heath, M., Sarkar, S., Sanocki, T., and Bowyer, K. (2000).
A robust visual method for assessing the relative per-
formance of edge-detection algorithms. IEEE Tr.
PAMI, 19(12):1338–1359.
Heitger, F., Rosenthaler, L., von der Heydt, R., Peterhans,
E., and Kubler, O. (1992). Simulation of neural con-
tour mechanisms: from simple to end-stopped cells.
Vision Res., 32(5):963–981.
Hubel, D. (1995). Eye, brain and vision. Scientific Ameri-
can Library.
Hupe, J., James, A., and Bullier, J. (2001). Feedback con-
nections act on the early part of the responses in mon-
key visual cortex. J. Neurophysiol., 85(1):134–144.
Itti, L. and Koch, C. (2001). Computational modeling
of visual attention. Nature Reviews: Neuroscience,
2(3):194–203.
Kr
¨
uger, N. and Peters, G. (1997). Object recognition with
banana wavelets. Proc. 5th Europ. Symp. Artificial
Neural Networks, pages 61–66.
Leibe, B. and Schiele, B. (2003). Analyzing appearance
and contour based methods for object categorization.
Proc. Int. Conf. Comp. Vision Pattern Recogn, Madi-
son (Wisconsin), pages 409–415.
Oliva, A., Torralba, A., Castelhano, M., and Henderson, J.
(2003). Top-down control of visual attention in object
detection. Int. Conf. Im. Proc., 1:253–256.
Pessoa, L. (1996). Mach bands: how many models are pos-
sible? Recent experimental findings and modeling at-
temps. Vision Res., 36:3205–3227.
Rasche, C. (2005). The making of a neuromorphic visual
system. Springer.
Rensink, R. (2000). The dynamic representation of scenes.
Visual Cogn., 7(1-3):17–42.
Riesenhuber, M. and Poggio, T. (2000). Cbf: A new frame-
work for object categorization in cortex. 1st IEEE
Int. Worksh. Biologically Motivated Computer Vision,
Seoul (Korea), pages 1–9.
Rodrigues, J. and du Buf, J. (2004a). Vision frontend with
a new disparity model. Early Cogn. Vision Worksh.,
Isle of Skye (Scotland)
www.cn.stir.ac.uk/ecovision-ws/.
Rodrigues, J. and du Buf, J. (2004b). Visual cortex fron-
tend: integrating lines, edges, keypoints and disparity.
Proc. Int. Conf. Image Anal. Recogn., Springer LNCS
3211(1):664–671.
Rodrigues, J. and du Buf, J. (2005a). Multi-scale cortical
keypoint representation for attention and object detec-
tion. 2nd Iberian Conf. on Patt. Recogn. and Image
Anal., Springer LNCS 3523:255–262.
Rodrigues, J. and du Buf, J. (2005b). Multi-scale keypoints
in V1 and face detection. 1st Int. Symp. Brain, Vi-
sion and Artif. Intell., Naples (Italy), Springer LNCS
3704:205–214.
Smeraldi, F. and Bigun, J. (2002). Retinal vision applied to
facial features detection and face authentication. Pat-
tern Recogn. Letters, 23:463–475.
van Deemter, J. and du Buf, J. (1996). Simultaneous detec-
tion of lines and edges using compound Gabor filters.
Int. J. Patt. Recogn. Artif. Intell., 14(6):757–777.
Zhaoping, L. (2003). V1 mechanisms and some figure-
ground and border effects. J. Physiology, 97:503–515.
VISAPP 2006 - IMAGE UNDERSTANDING
12
