
DETECTION OF ISOLATED NEMATODES IN CLUTTER
ENVIRONMENTS USING SHAPE FEATURE HISTOGRAMS
Daniel Ochoa, Sidharta Gautama
Telecomunication and Information Processing Department, Ghent University, St Pieternieuwstraat 41, Ghent, Belgium
Boris Vintimilla
Computer Vision and Robotics Center, Department of Electrical and Computer Science Engineering, ESPOL University,
Km 30.5 via Perimetral,Guayaquil, Ecuador
Keywords: feature extraction, segmentation, recognition.
Abstract: We present an approach for detection of isolated Caenohabditis Elegans nematodes in clutter environments.
The method is based on shape feature histograms which describe the distribution of features of second-order
derivative responses of linear image structures. The shape features are able to distinguish isolated from
overlapping nematodes and clutter, thereby improving the automated image analysis of nematode
populations where accurate assessment of shape is needed. An evaluation is performed on a database of
manually segmented images. Shape continuity features proved to have the highest discriminative power.
This is consistent with the morphological structure of this kind of organism. Our experiments suggest that
similar techniques can be used for identification of other linear shaped biological objects.
1 INTRODUCTION
The increasing amount of digital image data in
biological studies requires efficient and robust image
analysis tools to generate accurate and reproducible
quantitative results. In contrast to medical images
where imaging conditions and sampling methods are
highly controlled, biological images are inherently
difficult to analyse because of sample variation,
noise and clutter. Techniques need to be developed
and constantly adapted to specific tasks, which
requires substantial domain knowledge.
In biotechnology industry, one of the most
common procedures in research labs is the
measurement of microscopic structures to
characterize the interaction of organism population
with chemical substances (e.g. the effect of newly
developed pesticides). This task is typically carried
out by a technician who takes a number of
specimens from a sample to measure their length
and width. The new data is then analysed
statistically to find correlations with certain
chemical compounds. As the number of specimens
and the complexity of the analysis rises, manual
processing of these images becomes less of an
option. Automated image analysis can aid in this
process by identifying and measuring the structures
of interest in the images.
In this paper we work on images containing C.
Elegans nematode populations. This microorganism
has a well-described nervous system, and a complete
genome sequence which makes it attractive for
research and development in biotechnology. In an
earlier paper images containing single nematodes are
examined (Fdez-Valdivia et al., 1992). After
background correction, the image is thresholded and
skeletonized, after which contour curvature patterns
are used to identify the head and tail of the
nematode. By means of an interactive detection
procedure, (Palhares et al., 1997) proposed a method
for nematode recognition based on the stylet contour
morphology. A template matching algorithm
compared it with stylets of nematodes of known
taxonomy. In a first step towards classifying
C.Elegans behavioral phenotypes quantitatively,
(Baek et al., 2002) identified motion patterns by
means of a one-nematode tracking system,
morphological operators and geometrical related
features. All these papers relied on features extracted
486
Ochoa D., Gautama S. and Vintimilla B. (2006).
DETECTION OF ISOLATED NEMATODES IN CLUTTER ENVIRONMENTS USING SHAPE FEATURE HISTOGRAMS.
In Proceedings of the First International Conference on Computer Vision Theory and Applications, pages 486-491
DOI: 10.5220/0001365504860491
Copyright
c
SciTePress

from images with single, isolated nematodes,
segmented using a combination of intensity and
morphological based methods. Nematode
populations were studied in (Van Osta et al., 2002).
In this work scale space principles are applied to line
detection instead of intensity thresholding. The use
of anisotropic diffusion to improve the response of
the line detection algorithm is proposed but no
attempt is made to extract single specimens from the
population. This distorts the reporting of shape
measurements of the detected specimens, like
specimen size and width, if overlapping specimens
are regarded as one.
In contrast to previous efforts aimed at
characterizing individual nematodes, we focus on
detecting isolated nematodes in images of
populations. Given the nature of these images, we
study how to extract reliable shape information for
object identification with a restricted amount of
image data, clutter and structural noise. We consider
identification as a necessary step before any post-
processing task, in particular if a computer vision
based software tool is to be incorporated in daily lab
work where accurate measurements need to be
calculated.
This paper is organized as follows. Section 2
discusses the procedure used to detect the initial
lines that approach to nematodes. Shape
characteristics of isolated nematodes are discussed
and measurements proposed in Section 3. Results
are shown in Section 4, and finally conclusions and
further improvements are presented in Section 5.
2 SEGMENTATION USING
RIDGE DETECTION
In general, nematodes in an image can be thought of
as lines of varying width at each point along their
length, wide in the center and narrow near both ends.
Since nematodes appear as narrow valleys or ridges
in the intensity surface we exploit these properties
for segmentation. There has been a considerable
research into linear object detection in the medical
field particularly for vessel/neurite detection, the
reader is referred to (Kirbas and Quek, 2003) for a
survey of line detection algorithms.
In our work, a scale space method for line
detection is used (Steger, 1998). The intensity
surface f(x,y) is locally approximated by a 2-
dimensional second order Taylor polynomial at
every pixel. Ridges are detected by considering
eigenvectors and eigenvalues λ
± of the Hessian
matrix H:
x
xxy
x
yyy
ff
H
ff
⎡
⎤
=
⎢
⎥
⎣
⎦
(1)
2
xy
yyxxyyxx
f+)f(f±f+f=λ± 4
2
−
(2)
Ridge points show a vanishing second order
derivative in the direction of the eigenvector
corresponding to the maximum eigenvalue λ+.
Calculation of the partial derivatives f
xx
, f
yy
and f
xy
is
done by convolving (*) the image f(x,y) with
(separable) Gaussian derivative kernels:
(3)
(4)
2
2
2
''
,
,
1
()
2
(, ) () ()
*
x
xx
xx xx
g
xe
g
xy g yg x
f
gf
σ
σ
σ
σσ
σ
πσ
−
=
=
=
(5)
The ridge detector response R is defined as the
value of the maximum eigenvalue λ+ normalized for
a selected scale
σ
and an estimate of the local
contrast h. To approximate h at every point, the
output of a morphological closing (•) was subtracted
from the image:
)),((),(
σ
seyxfyxfh •
−
=
(6)
|
|
hσλ=R
+
/
2
⋅
(7)
Detection is performed by placing a threshold t
on R to select salient ridge pixels. To form line
segments, pixel chaining which groups connected
pixels belonging to the same line segment, is
required. This is done by taking salient pixels and
adding neighbouring pixels which show evidence of
being part of the same linear structures. The
direction of the eigenvector is used and should lie
within an error margin for pixels to be grouped.
We must point out that the aim of the
segmentation step is to extract linear objects. This of
course implies that many non-nematode objects will
also be segmented. In addition, overlapping
nematodes will be segmented as one or several
objects. When performing a shape analysis of the
segmented objects, the noise structures and
overlapping nematodes will introduce errors if shape
statistics are used to describe the population. It is
therefore important to detect isolated nematodes to
DETECTION OF ISOLATED NEMATODES IN CLUTTER ENVIRONMENTS USING SHAPE FEATURE
HISTOGRAMS
487
be able to produce a reliable reporting on the
properties of the population.
The correct estimation of segmentation
parameters (
σ
, t) still poses a problem and has
motivated different approaches to improve initial
segmentation results (Aylward and Bullitt, 2002;
Amri et al., 2005). In (Steger, 1998), a theoretical
model is developed to determine the optimal
parameters based on the expected line width. This
methodology is used in our work, where we have
derived the optimal parameters for the most common
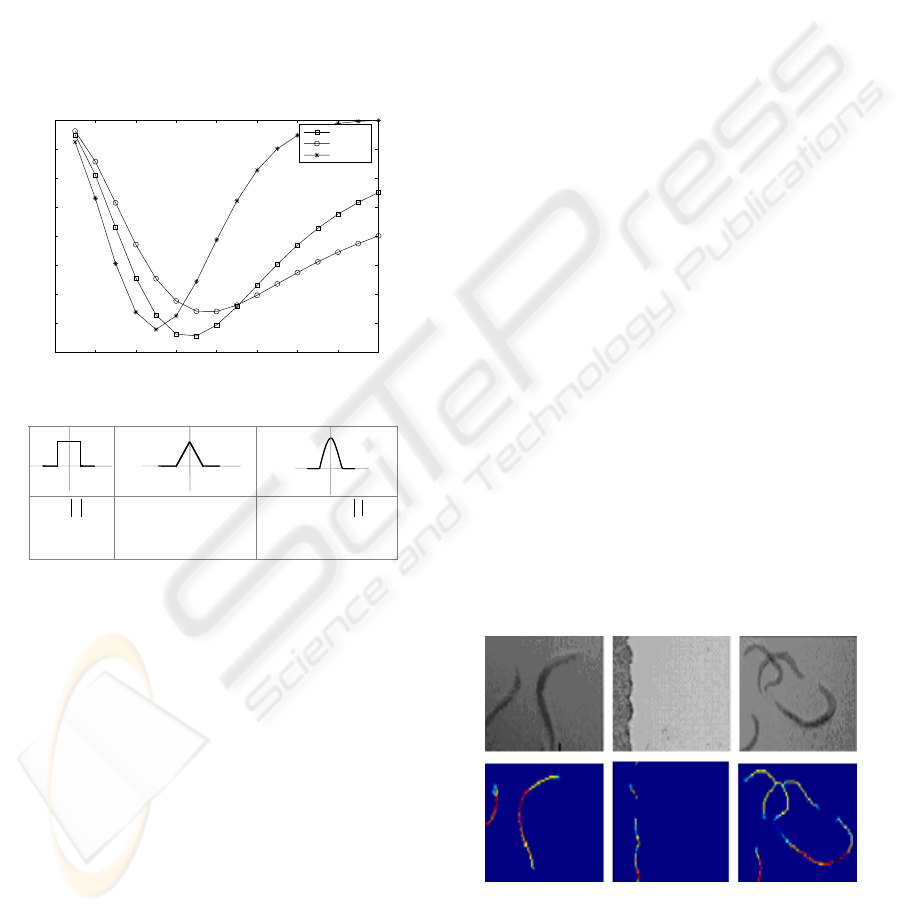
line profiles found in this kind of image (cfr. Fig 1).
For details, we refer to (Steger, 1998).
Res
p
onse
0 0.5 1 1.5 2 2.5 3 3.5 4
−0.4
−0.35
−0.3
−0.25
−0.2
−0.15
−0.1
−0.05
0
Square
Parabolic
Triangular
w
/σ
h
-w w
h
-w w
h
-w w
h
-w w
h
-w w
h
-w w
wxh ≤
0))/(1( ≤<−+ xwwxh
wxwxh ≤<− 0))/(1(
wxwxh ≤− ))/(1(
22
Figure 1: (top) Normalized response R as a function of line
width w and scale
σ
; (bottom) Line profiles equations.
We examined triangular and parabolic line
profiles, common in nematodes images by
approximating their 2D shapes with polynomial and
piecewise functions (cfr. Fig.1, bottom plot). Bar
shaped profile was also included as a reference since
it is used in road, neuron and blood vessel detection.
From derived analytic expressions we found that
despite the profile type, R at center line points can be
expressed as a function of w/
σ
. According to our
estimations the best values for detection task range
from w/
σ
. = 1.8 to 2.5 .The threshold t was set
accordingly to the estimated response R (cfr. Fig.1,
top plot).
3 SHAPE CHARACTERIZATION
Even when pixels with strong ridge responses are
connected into line segments, it is still impossible to
say whether a segment correspond to an isolated
nematode. The lack of salient contour points along
nematode body and overlapping make traditional
approaches such as contour and shape-based
methods difficult to apply. Recognition by means of
appearance/shape models on biological images
(Cootes et al., 1995; Hicks et al., 2002) is a complex
task given the small size of the nematodes in the
image, and the lack of stable landmark points.
Moreover, complex motion patterns prevent the use
of linear systems to create a simple shape model.
Although nonlinear systems have been devised
(Twining and Taylor, 2001) the complete range of
nematode body configurations is still far from being
model.
In this paper, we discuss the use of shape feature
histograms to characterize objects. The idea comes
from the analysis of 2D synthetic line profiles. There
is a relationship between the response R, line
contrast h and line width w. In the case of a line of
constant contrast as scale
σ
gets closer to the
nematode width the response R increases. (cfr. Fig
1)
As can be seen in Fig. 2, isolated nematodes
have a high response R in the middle of the
nematode and lower responses towards the ends. For
isolated nematodes, the response R varies smoothly
in the object compared to the responses of noise
structures and overlapping nematodes. Both
properties can be explained by the fact isolated
nematodes tend to have fairly constant contrast and a
continuous contour while noisy structures have an
unstructured shape and abrupt contrast variations.
Figure 2: Response spatial distribution for: free lying
nematode (left column), paraffin (middle column), and
overlapping nematodes (right column).
The Response distribution in overlapping
nematodes is more complex. Not all the nematodes
VISAPP 2006 - IMAGE ANALYSIS
488

in the group necessarily have the same size, so when
two or more nematodes of different sizes overlap the
number of low response values at junction points is
prone to increase. Also, since those locations
constitute saddle points, second order derivatives
tend to zero and so does the response. This effect is
more considerable when overlapping takes place
near the center of the nematodes body. We can use
this behavior to discriminate overlapping from
isolated nematodes.
Since for each line point response encapsulates
both width and contrast information in one number,
it seems logical to presume that the normalized line
detector response R contains valuable shape
information for recognition. We propose to utilize
this information by examining the histogram of the
response R or related features for each segmented
object. The shape of the histogram is then exploited
to characterize shape specific properties of the
object. The approach is related to shape feature
histograms used for content based image retrieval
(Gagaudakis and Rosin, 2002). Two types of
histograms have been examined: 1) a standard 1D
histogram of the response R, and 2) 2D co-
occurrence matrices.
The standard 1D histogram captures the
frequency distribution of the response R over a
segmented object. Three statistical features have
been chosen to summarize the histogram: mean,
variance and skewness. The variance of the
histogram is useful since variation of the response R
in isolated nematodes is gradual so they are expected
to show a smaller dispersion compared to noisy
structures. The skewness of the histogram is
measured using the third central moment. Skewness
is useful since almost two-thirds of the total length
of the nematodes have approximately the same
width. Therefore it is reasonable to expect that the
histogram for isolated nematodes may exhibit one
peak biased towards the right side and a long left
tail. This type of distribution tends to show negative
values of skewness.
To include spatial information, for each point on
every line segment response values were taken on 2
neighbouring points in every line direction. These
values populated an object co-occurrence matrix C.
Every cell of C is an estimate of the joint probability
P that a pair of points will have values z
i
and z
j
.
When response values are close to each other higher
values will accumulate near the main diagonal of C.
),(
jiij
zzPc =
(8)
EDM = ∑ ∑ (i - j)
k
c
i j
(9)
Regarding C as a 2D histogram the element
difference moment EDM, can be use to measure
value dispersion from the main diagonal. In our
experiments EDM of order one was calculated.
Typically used in texture analysis this feature
measures quantitatively how closed are intensity
values in neighbouring pixels. Because objects
corresponding to isolated nematodes are supposed to
display continuous transitions EDM will show
smaller values for objects with smooth contours and
contrast variations (cfr. Fig 3). EDM of higher
orders did not give better results and were therefore
not included in this paper.
Figure 3: Response histogram and Co-occurrence matrix
for free lying nematode (top row), overlapping nematodes
(bottom row).
In addition, length and mean response value of
line segments are also calculated. The length is a
simple and appealing feature to apply since one
could think that the longer the segment the higher
the possibility of corresponding to a nematode. The
mean response has been applied before to detect
salient paths in networks of lines (Geusebroek et al.,
2001). In our dataset, it is difficult to establish a
direct relationship between the mean and nematode
structures but we did not discard the feature.
4 EXPERIMENTAL RESULTS
All these histogram features have been computed on
a set of 20 population images corresponding to
juvenile and adult stage nematodes, captured using
the phase contrast microscopy technique. (cfr. Fig
4).
All images have been segmented manually and
line segments have been classified in isolated and
noise categories. Isolated refers to nematodes that lie
DETECTION OF ISOLATED NEMATODES IN CLUTTER ENVIRONMENTS USING SHAPE FEATURE
HISTOGRAMS
489
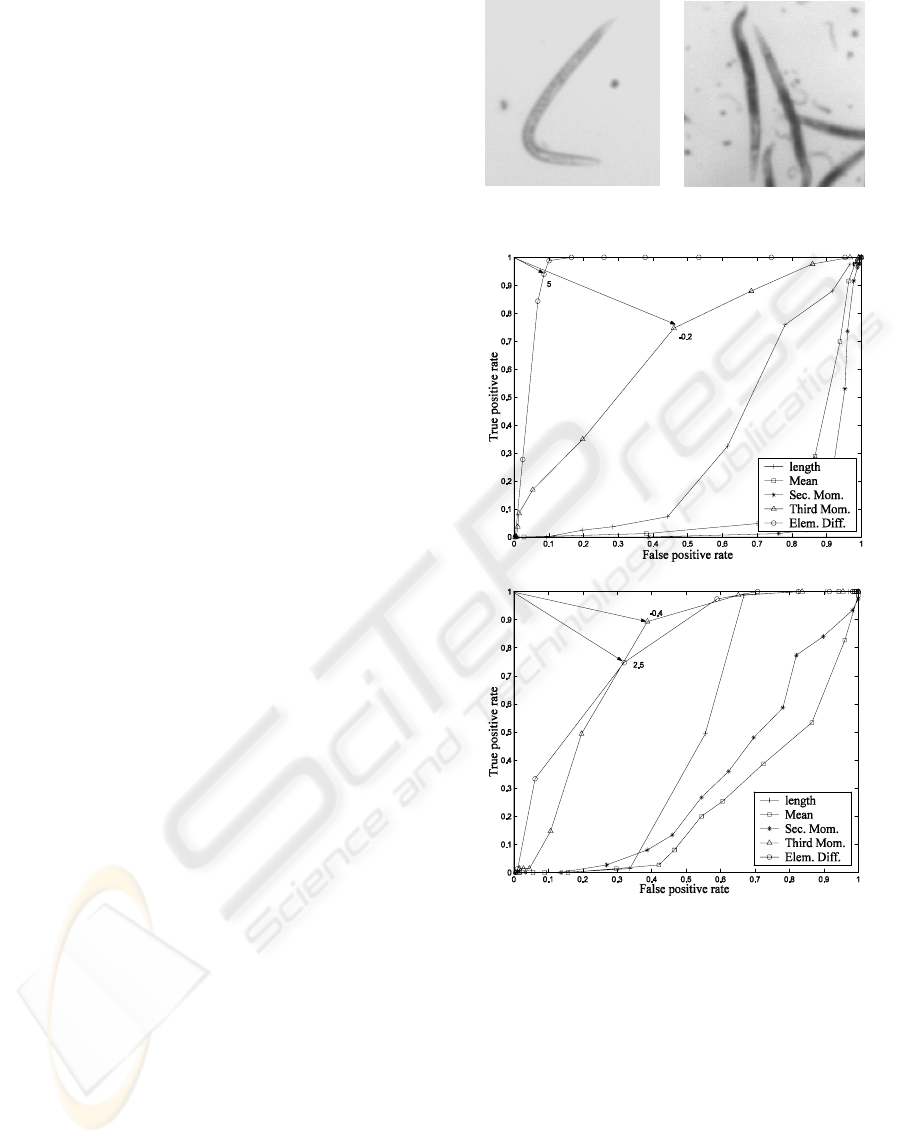
freely on the agar substract; noise includes
overlapping nematodes and everything that is not a
nematode such as paraffin, eggs, and dirt.
Once all the features were measured for our
dataset, the range between maximum and minimum
value was binned into 100 intervals after which the
median value was used as threshold for binary
classification. The performance of the classifier is
summarized in receiver-operating-characteristic
(ROC) curves, which represent the trade-off between
sensitivity and specificity of a classifier. For each
histogram feature a ROC curve is drawn,
considering true positives isolated nematodes and
counting overlapping nematodes and noise as
negative.
In Fig. 5, ROC curves for isolated nematodes
detection are displayed. As can be observed
invariably element different moment, EDM exhibits
the best performance. This feature better captures
the smooth variation that characterizes nematode
line segments. A 90% true positive detection rate is
achieved for isolated nematodes in juvenile
nematode populations with only 10% false positives
(cfr. Fig.5, top plot). For this data set we found
recognition consistency even when isolated
nematodes display complex motion patterns. False
negative results occur when a nematode intersects
itself. In this case the presence of junction can cause
a drop in the response value. Skewness along with
mean, length and variance performs poorly.
The experiments were repeated on a second set
of adult nematode population images. Now
nematode's internal organs, which are normally
transparent, were made visible. Our aim was to test
our features in very poor conditions when structural
noise covers most of the nematode body. We found
that intensity variations inside the nematode's body,
particularly in the sections corresponding to the
digestive and reproductive systems negatively
affected the continuity of response values and
consequently the trade off between true and false
detection. (cfr. Fig.5 bottom plot).
The results show that under controlled conditions
it is possible to identify structures of interest by
measuring perceptual clues like smoothness of shape
indirectly without having to fit a specific shape
model to the image.
Figure 4: Juvenile (left), Adult (right) nematodes.
Figure 5: ROC for isolated nematode classification:
normal contrast (top), high contrast (bottom).
5 CONCLUSIONS
In these experiments we have demonstrated that
distributions of second-order derivative responses
are useful to determine shape characteristics of
linear structures applied to nematode detection.
Tests carried out on manually segmented images of
nematode populations show that shape continuity
related features prove to have the most
discriminative power. It seems promising for
VISAPP 2006 - IMAGE ANALYSIS
490

recognition purposes in cases when there is a limited
amount of image data and for biological linear
objects where geometrical configurations are
difficult to model analytically.
Structural noise remains a problem in high
contrast images. Since they can be associated with
the transition between specific parts of the nematode
we are considering extending our methodology to
part detection schemes. The influence of these
features on other types of biological linear structures
such as plant pathogen or cell micro tubular
structures remains as an interesting field for future
work.
ACKNOWLEDGEMENTS
This work was supported by the VLIR-ESPOL
program. Daniel Ochoa is PhD student from VLIR-
ESPOL program. Images were kindly provided by
DevGen corporation, and the Marine Biology
Department of Ghent University.
REFERENCES
Amri Muhammad, Karim Abdul, Roysam Badrinath,
Dowell-Mesfin Natalie M., Jeromin Andreas, Yuksel
Murat, Kalyanaraman Shivkumar, 2005. Automatic
Selection of Parameters for Vessel/Neurite
Segmentation Algorithms. IEEE transactions on
Image processing, 14,1338 – 1350.
Aylward S. R. and Bullitt E., 2002. Initialization, noise,
singularities, and scale in height ridge traversal for
tubular object centerline extraction. IEEE Trans. Med.
Imag., 21, 61–75.
Baek J., Cosman P., Baek J., Feng Z.,Silver J., Schafer W.
2002. Using machine vision to analyze and classify C
Elegant behavioral phenotypes quantitatively. Journal
of Neuroscience Methods, 118, 9-21.
Cootes TF., Taylor C.J., Cooper C.H., 1995. Active shape
model: their training and application. Computer
Vision and Image understanding,6, 38-59.
Fdez-Valdivia J., Perez De la Blanca N., Castilllo P.,
Gomez-Barcina A., 1992. Detecting nematode
features from Digital Images. Journal of Nematology,
24,289-298.
Gagaudakis G., Rosin P. ,2002 Incorporating shape into
histograms for CBIR. Pattern Recognition, 35, 81-91.
Geusebroek J., Smeulders A., Geerts H., 2001. A
minimum cost approach for segmenting networks of
lines. International Journal of Computer Vision, 43,
99-111.
Hicks Y., Marshall D., Martin R.R., Rosin P.L., Bayer
M.M., Mann D.G., 2002. Automatic landmarking for
biological shape model. Proceedings International
Conference on Image Processing, 2. 801-804.
Kirbas Cemil and Quek Francis K.H., 2003. Vessel
Extraction Techniques and Algorithms : A Survey.
Proceedings of the Third IEEE Symposium on
BioInformatics and BioEngineering, 238-246.
Palhares L. ,Bastos R., 1997. A preliminary study for
constructing a computational procedure for nematodes
identification based on morphological aspects.
European Conference for information Technology in
Agriculture, 1,15-18
Steger C., 1998 An unbiased detector of curvilinear
structures. IEEE Trans. Pattern Anal Machine Intell.,
20, 113-125.
Twining C. J., Taylor C. J., 2001.
Kernel Principal
Component Analysis and the Construction of Non-
Linear Active Shape Models. In BMVC 2001, British
Machine Vision Conference.
Van Osta P., Geusebroek J.M., Ver Donck K., Bols L.,
Geysen J., ter Haar Romeny B.M., 2002. The
principles of scale space applied to structure and
colour in light microscopy. Proceedings Royal
Microscopical Society, 37, 161-166.
DETECTION OF ISOLATED NEMATODES IN CLUTTER ENVIRONMENTS USING SHAPE FEATURE
HISTOGRAMS
491
