
PROGRESSIVE TRANSMISSION AND RENDERING OF FOVEATED
VOLUME DATA
Chen Chen, Zhiyong Huang, Hang Yu, Ee-Chien Chang
Department of Computer Science, School of Computing
National University of Singapore, Singapore 117543
Keywords:
Progressive Transmission and Volume Rendering, Wavelet Foveation, Multiresolution.
Abstract:
With development of biomedical and networking technology, interactive volume rendering with data trans-
mitted via the network becomes an interesting topic. Two technical problems are data transmission and fast
volume rendering. In this paper, two schemes using Wavelet foveation are proposed and implemented: the
region-based and coarse-to-fine. The first scheme transmits and renders the region of interest (ROI) of volume
data on the client site at highest resolution for the first time, and consequently it iteratively expands the region
layer by layer towards to the peripheral. While the second one gives a complete image in a low resolution for
the first time on the client. The detail coefficients will be transmitted continuously and the rendering result
will be progressively refined depending on the distance to the ROI.
1 INTRODUCTION
Modern scanners such as CT and MRI provide de-
tailed cross-sections of objects at a very high resolu-
tion. These data sets occupy huge amount of memory
space. Some super computer centers maintain large
data repositories on servers whose data sets will be ac-
cessed through networks and rendered on clients for
researchers around the world to collaborate in their
research (Hancock and Hubbold, 1997) (Bhaniramka
and Demange, 2002).
The network’s bandwidth is relatively low for the
large scientific data sets. Lossy compression is typi-
cally employed to reduce data size. However, for very
large data sets, such reduction is still insufficient, es-
pecially when interactivity is required. Region of in-
terest (ROI) is another approach to further reduce the
data size. The ROI is determined from the user’s in-
tention, which in turns prioritizes the data transmis-
sion. Hence, a few design issues are on how to trans-
late the user’s interactive feedback to the transmission
order of the data, and how to render and present the
partial information received in the client’s side. The
above design issues are the focus of this paper.
Many state-of-the-art lossy image compression
schemes are based on Wavelet transform. For natural
images and many medical volume data sets, a large
number of their Wavelet coefficients have small val-
ues. The lossy compression is obtained by discarding
coefficients lower than a threshold, and such thresh-
old determines the quality and compression rate. To
compress with ROI, different thresholds are set for co-
efficients correspond to different spatial location. A
foveated volume can be viewed as a volume with mul-
tiple levels of ROI. The spatial resolution is highest at
a location known as fovea, but decrease gradually for
as the distance from the fovea increases.
We adopt the following approach of interactive
transmission and rendering. The Wavelet coefficients
are progressively transmitted by the server and pro-
gressively rendered by the client, in an order deter-
mined by the location of the fovea indicated by the
user. There are two ways of progressive transmis-
sion/rendering. One is region-based, that is, the pri-
ority of an coefficient will be inversely proportional
to its distance to the center fovea. The center fovea
will have the highest priority thus will be transmit-
ted and rendered first on client site with highest res-
olution. The user on the client site will see a small
portion of the volume which he/she is most interested
in. It will then be expanded progressively until the
whole foveated volume is received (Figures 11 and
13). The other one is coarse-to-fine scheme. The vol-
ume in lowest resolution will be transmitted and ren-
dered first. More coefficients will arrive successively
to refine region near the fovea Thus, the user will first
67
Chen C., Huang Z., Yu H. and Chang E. (2006).
PROGRESSIVE TRANSMISSION AND RENDERING OF FOVEATED VOLUME DATA.
In Proceedings of the First International Conference on Computer Graphics Theory and Applications, pages 67-75
DOI: 10.5220/0001357400670075
Copyright
c
SciTePress
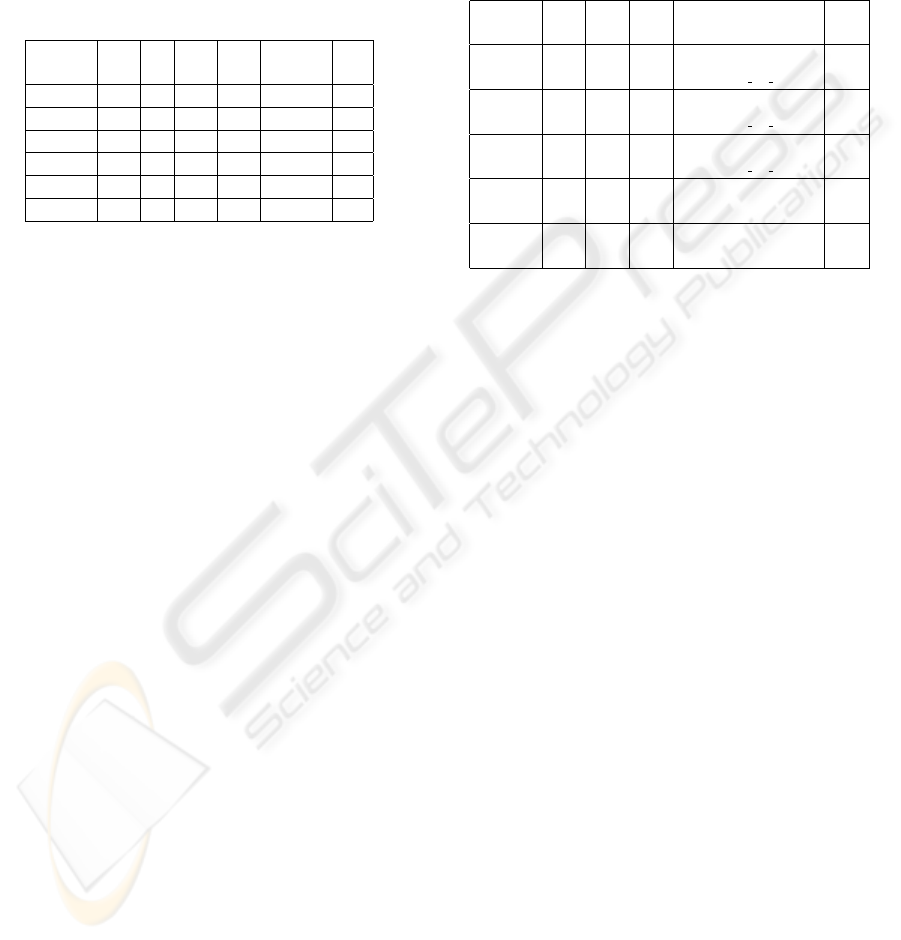
Table 1: Comparison of various data preprocessing meth-
ods: 1(Lacroute and Levoy, 1994), 2(Gross et al., 1997),
3(Ihm and Park, 1998), 4(Kim and Shin, 1999), 5(Guthe
et al., 2002), 6(Norton and Rockwood, 2003) (Wavelet-
Based (WB): y-yes, n-no. Output (O): 1-a list of voxel scan-
line, 2-the whole data set, 3-the significant and near cubes,
4-the coefficients of the visible frontal cubes; Data Access
(DA): 1-sequential, 2-random, 3-hierarchical; Compression
Rate (CR): –not applicable, l-low, m-medium, h-high; Re-
construction of a Single Voxel (RSV); Progressive Refine-
ment (PR): y-yes, n-no).
Methods RB O DA CR RSV PR
1 n 1 1 - - n
2 y 2 2 m O(n) n
3 y 2 2 m O(1) n
4 y 2 2 h O(1) n
5 y 3 3 h O(log n) n
6 y 4 3 m O(log n) y
see a low resolution image, and next an image with
2 levels of details, follow by 3 levels of details and
so forth (Figures 12 and 14). We have implemented
the above two transmission/rendering schemes. The
results are compared and reported.
2 RELATED WORK
The huge amount of data is the most significant prob-
lem both in data transmission and volume rendering.
The technical solution includes data compression and
fast volume rendering.
Many researchers employed Wavelet transform in
their compression schemes for volume rendering.
They usually contain four steps: Wavelet transform,
normalization, thresholding, and encoding. First,
transform the data into Wavelet domain. Second,
the Wavelet coefficients are normalized to the inter-
val [0,1]. Third, those coefficients that are smaller
than a certain threshold value are discarded. Fourth,
the data are encoded using some coding schemes like
run-length or Huffman. Data extraction is employed
further to extract the most important data and trans-
fer with priority for rendering. A comparison of some
compression methods is listed in Table 1.
There are four techniques that are particular pop-
ular in volume rendering: raycasting, splatting,
shear-warp and texture-mapping hardware-based ap-
proaches (Meissner et al., 2000). Raycasting and
splatting give better image quality but have lower ren-
dering speed. Raycasting casts a ray for each im-
age pixel into the volume and accumulate the sam-
ple value along the ray by resampling. In contrast
with ray casting, splatting, first proposed in (West-
Table 2: Comparison of various rendering methods: 1(Pin-
namaneni et al., 2002), 2(Pinnamaneni, 2003), 3(Guthe
et al., 2002), 4(Lacroute and Levoy, 1994), 5(Kim and
Shin, 1999) (Output Resolution (OR): u-uniform, m-
multiresolution; Output Quality (OQ): l-low, m-medium, h-
high; Rendering Algorithm (RA): 1-2D texture mapping, 2-
3D texture mapping, 3-shear-warp; Rendering Time Com-
plexity (RTC); Rendering Space Complexity (RSC): l-low,
m-medium, h-high).
Methods OR OQ RA RS MC
1 u l 1 3 ∗ n(slice) m
∗n(voxel in slice)
2 u m 2 n(slice) h
∗n(voxel in slice)
3 m m 2 n(slice) l
∗n(voxel in slice)
4 u h 3 n(v o xel)− h
n(transparent)
5 u h 3 n(v oxel) m
−n(transparent)
over, 1990), is a feed forward algorithm calculating
the footprint which is the weight of the voxel con-
tributing to its neighboring pixel. Both methods have
been combined with Wavelet transform in order to re-
duce the size of volume data to fit into core memory
(Westenberg and Roerdink, 2000) (Gross et al., 1997).
Texture-mapping is a hardware based method
which is very fast but gives lower image quality.
When the data set is too large that the texture is hard
to be loaded totally into texture memory, texture swap
will occur and rendering speed will reduce dramati-
cally. Shear-warp (Lacroute and Levoy, 1994) is the
fastest software-based algorithm and gives similar im-
age quality with raycasting and splatting. However,
when the magnification is high, significant aliasing is
present. A comparison of some methods is listed in
Table 2. The image quality has been significantly im-
proved in (Engel et al., 2001).
3 OUR WORK
Our method contains three steps: data preprocessing,
progressive transmission and progressive volume ren-
dering.
Volume data is first transformed to Wavelet form
and divided into 8x8x8 blocks, each block is en-
coded using RLE (run-length encoding) in server site.
Blockwise structure is employed in order to enable
efficient data compression as well as convenient com-
munication between server and client. When a client
request is received, a compressed foveated volume is
extracted. A foveated volume has highest resolution
GRAPP 2006 - COMPUTER GRAPHICS THEORY AND APPLICATIONS
68
at the fovea while the resolution falls off when the
distance with the fovea increases. We use Wavelet
foveation to approximate foveation operator (Chang
et al., 2000). For an original data set with size 1024
3
and fovea size 48
3
, the Wavelet foveated volume will
have approximately 24
3
∗ 36 = 497664 coefficients,
which is reduced by a factor of 2,000 comparing with
the original size. Details of Wavelet transform and ex-
traction of foveated volume will be described in sub-
sections 3.1.1 and 3.1.2.
Data is then progressively transmitted in se-
quence. Data blocks of the Wavelet foveated volume
are reordered according to two priority assignment
schemes: region-based and the coarse-to-fine. They
will be discussed in detail in subsection 3.2.
To be consistent with progressive data transmis-
sion, progressive rendering algorithm is employed. In
region-based scheme, the volume are displayed on
client site layer by layer from fovea toward the pe-
ripheral. The fovea area will be rendered in high res-
olution using data received earlier and in each suc-
cessive step, one immediate outer layer is displayed
in half resolution of its inner layer. In coarse-to-
fine scheme, the client will first show a rough aver-
age image of the volume and iteratively refines the
fovea area. Two progressive rendering algorithms are
described in subsection 3.3.1. Viewing from a non-
orthogonal direction will be discussed in subsection
3.3.2.
3.1 Data Preprocessing
3.1.1 Data Compression
Haar Wavelet is implemented because it is simple and
has a good correspondence with octree that enables
easy data searching and reconstruction.
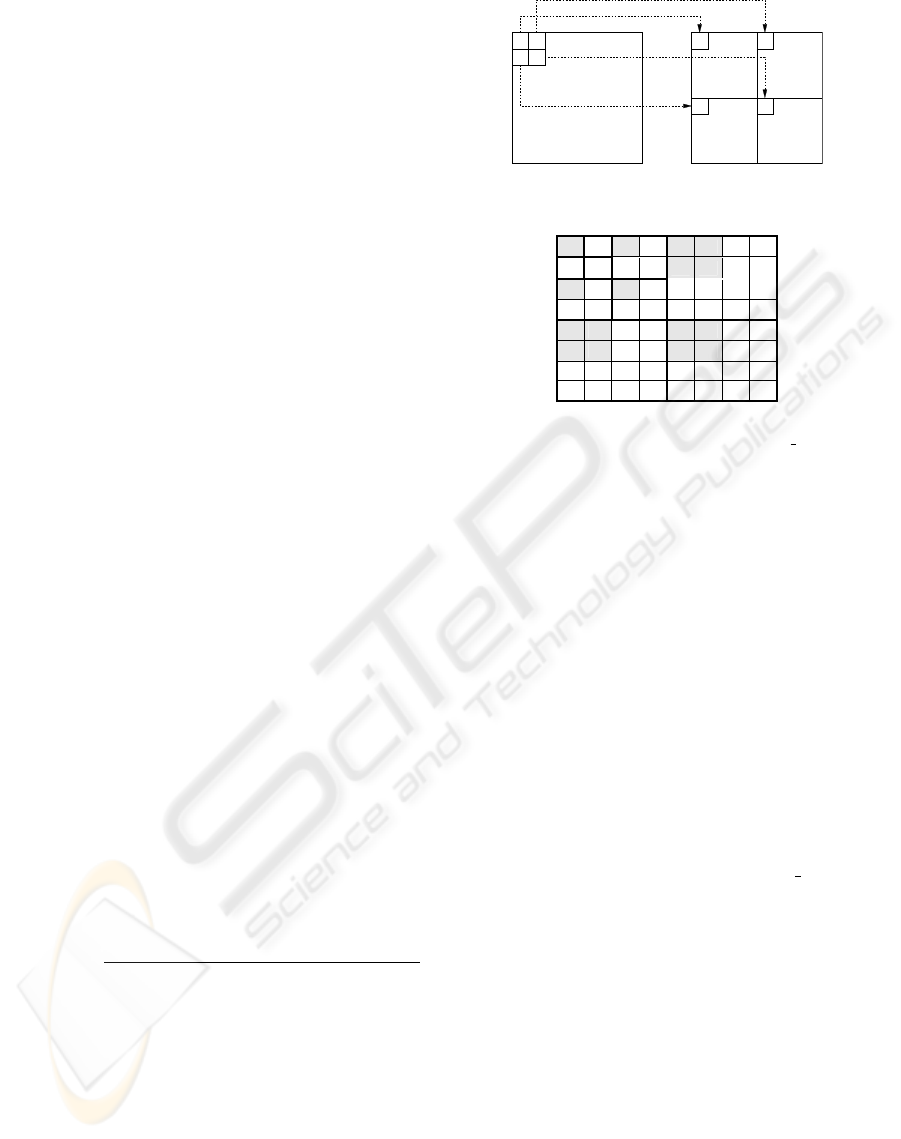
Haar Wavelet transform We will illustrate it in 2D
case first. Let I be an image of size 2
N
× 2
N
. Four
images can be generated from I after one pass of Haar
Wavelet transform, where
I
00
(i, j)=
I(2i, 2j)+I
10
(i, j)+I
01
(i, j)+I
11
(i, j)
4
I
10
(i, j)=I(2i +1, 2j)
I
01
(i, j)=I(2i, 2j +1)
I
11
(i, j)=I(2i +1, 2j +1)
i, j =0...2
N −1
− 1
As illustrated in Figure 1, image I
00
is an aver-
age image of image I with half resolution. The rest
three images are called detail images. We recursively
perform this process on the average image of each it-
eration until the average image has only 1 pixel or
reaches some pre-defined resolution. The result will
be the Wavelet representation of the original image I.
dc
AB
CD
I
II
II
00 10
01 11
(a+b+c+d)/4
b
d
c
ba
Figure 1: Illustration of Wavelet transform.
L0 L1 L2
A
00
A
01
HL
00
HL
01
HL
00
HL
01
HL
02
HL
03
A
10
A
11
HL
10
HL
11
HL
10
HL
11
HL
12
HL
13
LH
00
LH
01
HH
00
HH
01
HL
20
HL
21
HL
22
HL
23
LH
10
LH
11
HH
10
HH
11
HL
30
HL
31
HL
32
HL
33
LH
00
LH
01
LH
02
LH
03
HH
00
HH
01
HH
02
HH
03
LH
10
LH
11
LH
12
LH
13
HH
10
HH
11
HH
12
HH
13
LH
20
LH
21
LH
22
LH
23
HH
20
HH
21
HH
22
HH
23
LH
30
LH
31
LH
32
LH
33
HH
30
HH
31
HH
32
HH
33
Figure 2: Wavelet Transform of a (8k)
2
∗ blk sz data set.
Blockwise hierarchical compression scheme In
the server site, we use a blockwise hierarchical com-
pression scheme similar to (Guthe et al., 2002). Di-
vide the volumes into blocks of (2k)
3
, then apply
generic Haar Wavelet transform on it to get 8 blocks
of size k
3
. One of them will be average block, the
other 7 are detail blocks. Group 8 adjacent average
blocks again to obtain a block of size (2k)
3
. Re-
peat this procedure until the size of the average image
reaches m. These m blocks are the low pass filtered
volume of the whole volume data. The value of k has
a tradeoff between compression rate and date redun-
dancy during transmission. Since the block will be
regarded as a unit during data transmission. Large k
value will cause data redundancy since we will trans-
mit more data than we actually needed. Small k value
usually gives low compression rate. In our case, k will
be 8 and m will be 16.
Give a 2D data set of size (8k)
2
∗ blk sz, repeat
the procedure described previously 2 times and ob-
tain 4 average blocks marked as A
00
,A
01
,A
10
and
A
11
(Figure 2). Each of them associates with a
quadtree (Figure 3). Take A
00
as example, the co-
efficients marked in grey color are all the component
nodes in quadtree of A
00
. Local coordinate in a level
v corresponds with 3 blocks: HL, LH and HH, which
are the 3 components of node(v,i,j) in the quadtree.
Four child nodes of this node (v,i,j) in level v+1 can
be simply identified by (2i,2j), (2i,2j+1), (2i+1,2j) and
(2i+1,2j+1), which forms a pointless quadtree.
3D case is almost the same with 2D, the only dif-
ference is each node will have 7 component nodes:
LLH, LHL, LHH, HLL, HLH, HHL and HHH, and
each node has 8 child nodes.
After Wavelet volume are divided into data blocks.
RLE(run-length encoding) is performed on it block by
PROGRESSIVE TRANSMISSION AND RENDERING OF FOVEATED VOLUME DATA
69
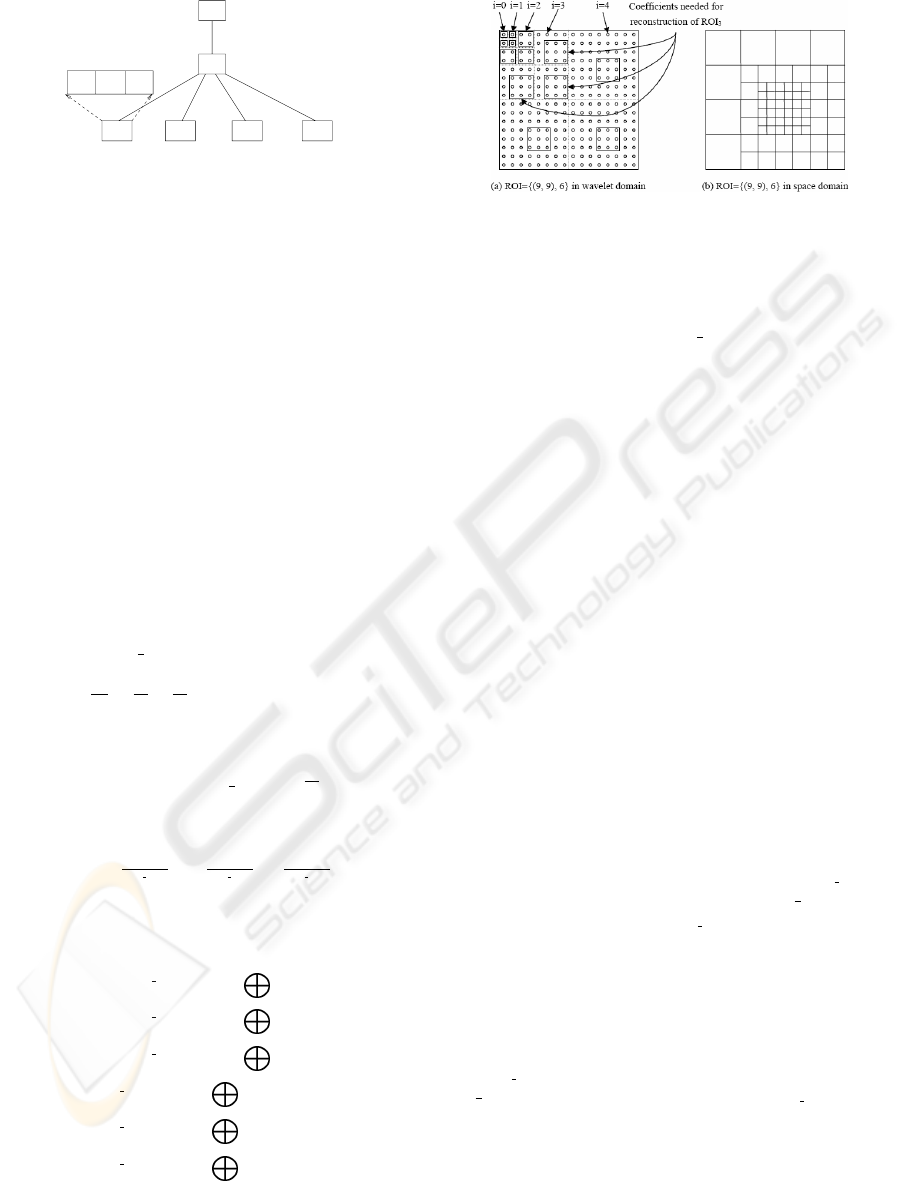
A00
HH00LH00HL00
1,1 0,1 0,0 1,0
0,0
Figure 3: Quadtree of data set in Figure 2.
block in order of front to back, top to bottom and left
to right. The compressed block is a list of value(v)
and length(l) pairs.
3.1.2 Derive Foveated Volume in Wavelet
Domain
Having a volume W in Wavelet domain and ROI de-
fined by a viewer, we need to derive the foveated vol-
ume W
f
. The ROI is defined as ROI{(x, y, z),r
3
},
where (x, y, z) is the center of fovea and r indicates
its region.
The lowest resolution image of W is defined as
layer 0 image, and the second lowest resolution im-
age as layer 1 image and so on. layer 0 is actu-
ally the average image of W , and layer i image can
be obtained by performing inverse Wavelet transform
to layer i-1 with the corresponding detailed coeffi-
cients(corresponding detailed coefficients are layer i
details). The highest resolution image in W is de-
noted as layer max
layer. In general, the volume data
is of size W*H*D, and the size of the lowest resolu-
tion layer is
W
m
∗
H
m
∗
D
m
(assuming W, H and D are
multiples of m and m is power of 2). In case the vol-
ume data V is cubic with size of N
3
(N is power of
2), and the Wavelet transform is processed until the
average image has size m
3
, m l = log
2
N
m
.
W
f
is extracted from W. It consists of all voxels
that are needed for reconstructing ROI
i
, where ROI
i
is the region of interest in the ith layer of W. The cen-
ter of ROI
i
is (
x
2
m l−i
),
y
2
m l−i
,
z
2
m l−i
) and the
size of ROI
i
is r
3
.
For convenience of calculation, the boundary of
ROI
i
can be defined as
begin
i
.x =(x/2
(m l−i)
− s/2) (0XFFFE) (1)
begin
i
.y =(y/2
(m l−i)
− s/2) (0XFFFE) (2)
begin
i
.z =(z/2
(m l−i)
− s/2) (0XFFFE) (3)
end
i
.x =(x/2
(m l−i)
+ s/2) (0XFFFE) − 1 (4)
end
i
.y =(y/2
(m l−i)
+ s/2) (0XFFFE) − 1 (5)
end
i
.z =(z/2
(m l−i)
+ s/2) (0XFFFE) − 1 (6)
begin
i
.t, end
i
.t ∈ [0,minlen∗ 2
i
− 1],t = x, y, z
Figure 4: Extraction of the foveated data in Wavelet do-
main.
Figure 4 gives an 2D example of ROI={(9,9),6} for
a 16*16 image, where m=1, that is, the average image
size is 1
2
. In this example, m l = log
2
16 = 4. Take
layer 3 as an example, ROI
3
= {(4, 4), 6}, pixels in
layer 3 image with coordinate (i,j), i, j ∈ [2, 7] are in
ROI
3
. In order to reconstruct ROI
3
, layer 3 details
with coordinate (i,j), i, j ∈ [1, 3] are needed. Figure
4(b) represents the reconstructed foveated image.
3.2 Progressive Transmission
Progressive transmission is to re-order the coefficients
such that more important coefficients will be regarded
as high priority and being sent first. These coefficients
can be rendered in the client site separately with other
data. Less important coefficients will be sent progres-
sively, step by step, to refine the result image.
There are two ways of progressive transmission in
Wavelet volume rendering schemes: the region-based
and coarse-to-fine.
The first method is intuitive to implement. We just
send the Wavelet foveated volume data from inner
layer to outer layer progressively. Coefficients in each
layer should be wrapped as an atomic package.
The basic idea of the second method is to send
all data blocks for constructing ROI
i
in each itera-
tion. At the first iteration, boundary of ROI
m l
will
be computed and data blocks in layer m
l − 1 that
contain coefficients for ROI
m l
will be added into the
data queue. All parent blocks of these blocks will also
be added into the data queue. A block is regarded as
a parent block of another block if it’s a parent node of
that block in the octree they belong to. The index of
the data block will be added into the data list when it is
added into the data queue. In iteration i, boundary of
ROI
m l−i+1
will be computed. Data blocks in layer
m
l − i that contain coefficients for ROI
m l−i+1
and
all parent blocks of these blocks will be added into
the data queue if that block does not exist in the data
list. Repeat this procedure until coefficients of ROI
0
are added into the data queue. If the data list doesn’t
contain all data blocks in average image after above
procedure, append the remaining average blocks into
the data queue.
GRAPP 2006 - COMPUTER GRAPHICS THEORY AND APPLICATIONS
70
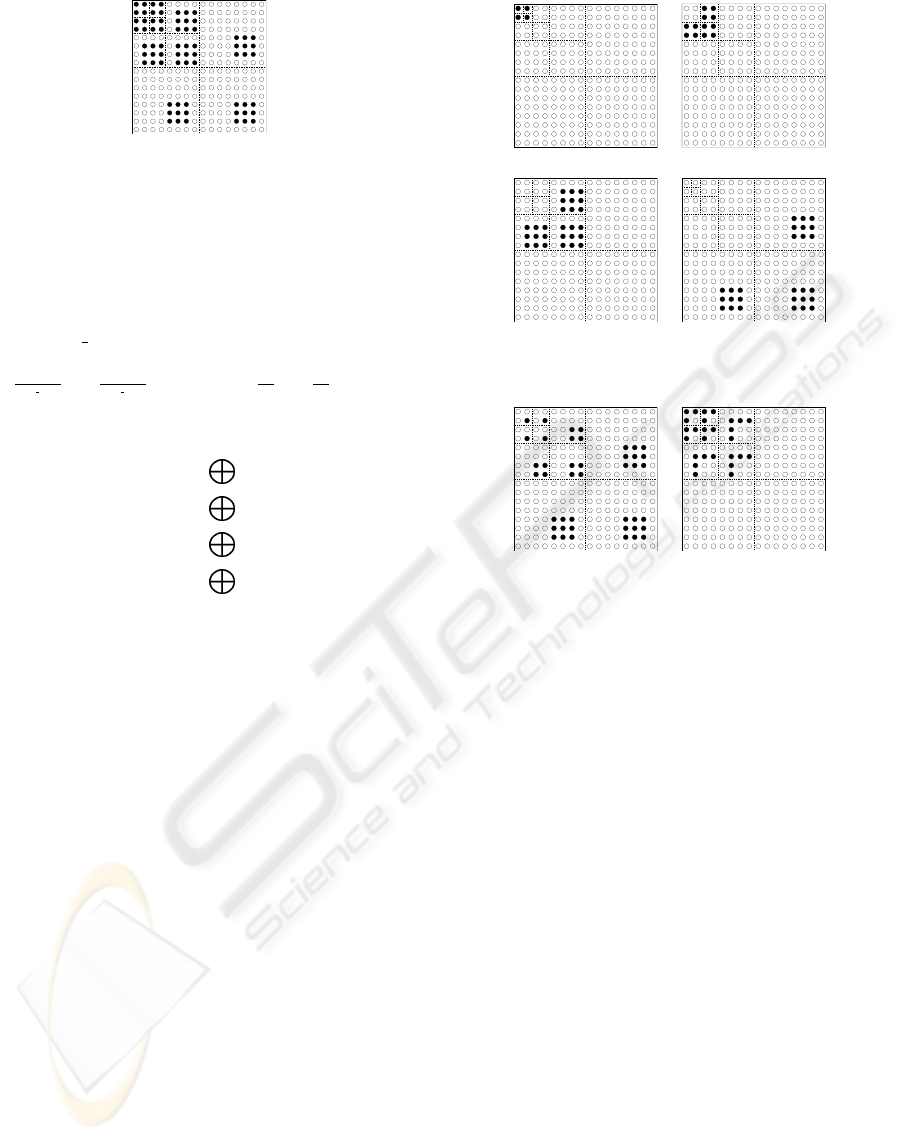
Figure 5: Wavelet foveated image.
Let’s illustrate the procedure using a 2D example.
Given a 2D image with size 128 ∗ 128, where m=16,
k=8 and ROI=(86,86),45. The average image has size
16 ∗ 16, which contains 4 data blocks, the fovea cen-
tered at coordinate (86,86) with size (45,45). In this
example, m
l = log
2
(128/16) = log
2
8=3.
Take ROI
2
as an example, ROI
2
=
{(
x
2
m l−i
),
y
2
m l−i
),d} = {(
86
2
2
),
86
2
2
), 45} =
{(43, 43), 45}.
begin
i
.x =(43− 45/2) (0XFFFE)=20
begin
i
.y =(43− 45/2) (0XFFFE)=20
end
i
.x = (43 + 45/2) (0XFFFE) − 1=63
end
i
.y = (43 + 45/2) (0XFFFE) − 1=63
begin
i
.x, begin
i
.y, end
i
.x, end
i
.y ∈ [0, 63]
Pixels in layer 2 image with coordinate (i,j),
i, j ∈ [20, 63] are in ROI
2
. In order to reconstruct
ROI
2
, layer 2 details with local coordinates (i,j),
i, j ∈ [10, 31] are needed, represented as block in-
dex (blk
i
,blk
j
), blk
i
,blk
j
∈ [1, 3]. Similarly,
ROI
3
= {(86, 86), 45} = [64, 107], level 3 details:
(blk
i
,blk
j
), blk
i
,blk
j
∈ [4, 6]
ROI
2
= {(43, 43), 45} = [20, 63], level 2 details:
(blk
i
,blk
j
), blk
i
,blk
j
∈ [1, 3]
ROI
1
= {(21, 21), 45} =[0, 31], level 1 details:
(blk
i
,blk
j
), blk
i
,blk
j
∈ [0, 1]
ROI
0
= {(10, 10), 45} =[0, 15], average blocks:
(blk
i
,blk
j
), blk
i
,blk
j
∈ [0, 1].
Figure 5 illustrates in 2D using a Wavelet foveated
image, each circle represents one data block with size
8 ∗ 8. Circles in black are data blocks that belongs to
ROI
i
,i ∈ [0, 3]. Figure 6 and 7 show the procedure
of the first and second transmission methods, sepa-
rately. Black circles represents data blocks being sent
in each step. In method 2, there are only 2 steps rather
than 4. That is because we use a blockwise structure,
each block is regarded as an atomic unit. During each
iteration, we may send more data than there is actually
needed to reconstruct ROI
i
. Thus, detail coordinates
needed in step 3 and 4 have been sent in previous steps
as redundant data.
Step 1 Step 2
Step 3 Step 4
Figure 6: Four iterations of the region-based method.
Step 1 Step 2
Figure 7: Two iterations of the coarse-to-fine method.
3.3 Progressive Volume Rendering
3.3.1 Rendering with Orthogonal Viewing
Direction
Corresponding to the two progressive transmission
methods, there are two ways of rendering: region-
based and coarse-to-fine.
Algorithm 1: region-based
• Partial Volume reconstruction
Given a starting and ending coordinate (begin
x
,
begin
y
, begin
z
) and (end
x
, end
y
, end
z
) of a
volume and a desired resolution scale 2
k
(as a
power of 2). We determine its Wavelet coefficients
in each layer and reconstruct the original volume
data at a desired resolution.
Define the average image and inner most
layer to be layer 0 and outer most layer, that
is, the desired resolution layer, to be layer
l. Wavelet coefficients at layer i is from
(begin
x
/2
(l−i)
, begin
y
/2
(l−i)
,begin
y
/2
(l−i)
)
to (end
x
/2
(l−i)
,end
y
/2
(l−i)
,end
z
/2
(l−i)
). Re-
construction starts from the average image and
the inner most detail coefficients until desired
PROGRESSIVE TRANSMISSION AND RENDERING OF FOVEATED VOLUME DATA
71
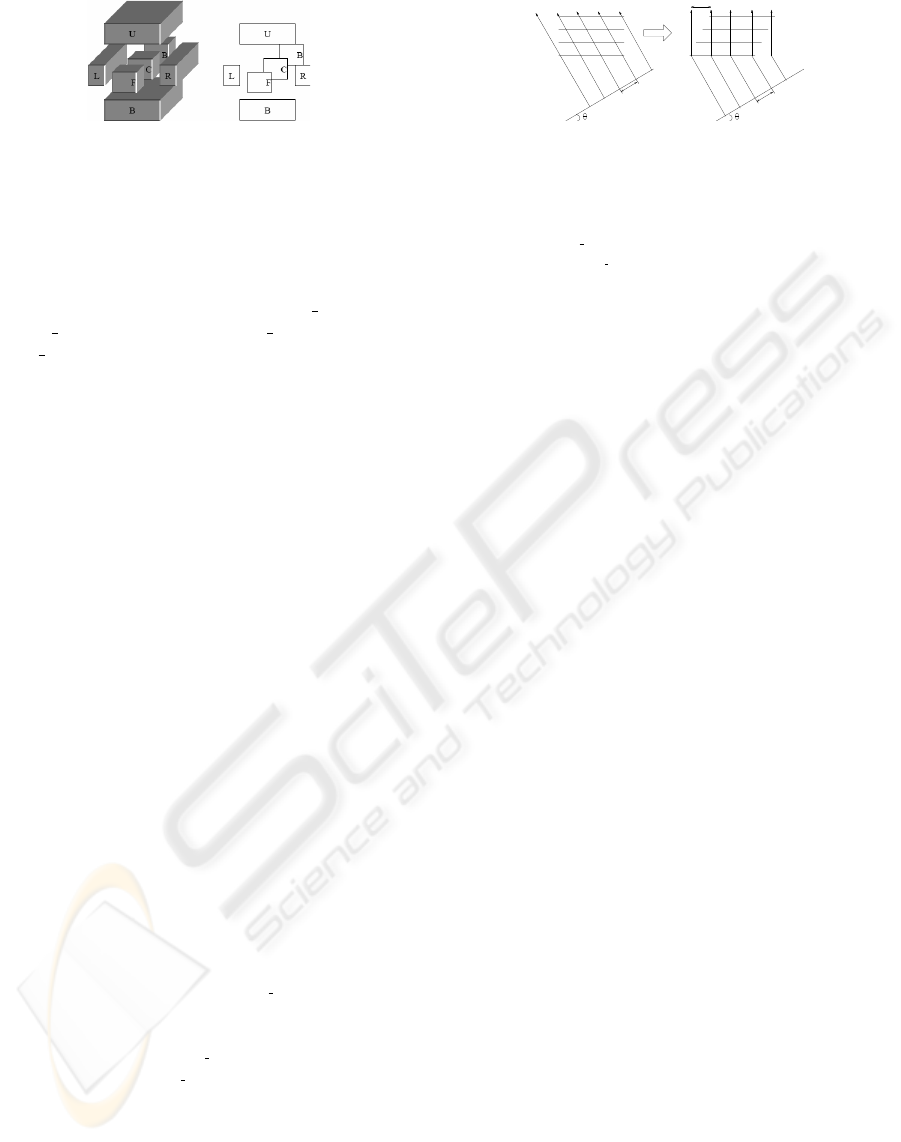
Figure 8: Image composition.
resolution is reached.
• Progressive rendering
Given a mask with Mask
size=(s,s,s),
Mask
center=(x,y,z), num layer=L and
min
length=minlen. In the first iteration, the
center fovea is reconstructed and rendered using
partial volume reconstruction, which is described
in previous section. In a later iteration i, 6 sub-
volumes: top, bottom, left, right, front and back are
separately reconstructed at a resolution scale 2
i−1
,
rendered using standard rendering algorithm and
combine the rendered result to previous rendering
image.
• Image composition
The top, bottom, left and right rendering images
obtained in each iteration are simply added to the
previous rendering image at their right position,
while front and back image needs image compo-
sition (Figure 8). For each rendering result, the
system obtains both density value and alpha value
of each pixel. An over operator is performed on
front, inner and back image, that is, (front) over
(inner) over (back).
over operator can be performed pixel by pixel.
Given image pixel A(d
a
,α
a
) and B(d
b
,α
b
). Re-
sulting pixel is C(d
c
,α
c
), where C =(A)over(B)
and d
c
= d
a
+(1− α
a
) ∗ d
b
.
Algorithm 2: coarse-to-fine
Definition of ROI
0
to ROI
m l
are exactly as
described in algorithm 1. We start the rendering
procedure from ROI
0
, which is the average block to
the inner most layer ROI
m l
. Each layer, exclude the
inner most layer ROI
m l
, can be divided into seven
parts, denoted as, Top, Bottom, Left, Right, Front,
Back and Center. The Center part is actually the
average information for the inner layer and will be
kept for the next iteration. The process is as follows:
Take layer iROI
i
as an example, which is con-
structed by the Center part of ROI
i−1
and level i
detail coefficients. It is divided into seven parts and
d
Image
Viewing Rays
Plane
m
d
Plane
Image
Slices
Volume
Figure 9: Volume being transformed to sheared object
space.
rendered. In ROI
i
, the number of voxels each voxel
represent is 2
m l−i
, so the intensity for each voxel in
ROI
i
is I =
2
m l−i
i=1
qα(1 − α)
i−1
.
Seven parts will be rendered separately and inte-
grated. The center part C
i
and the rendering results
of Front and Back RF
i
and RB
i
parts will be taken
down for the next iteration. C
i
is the average pass
for iteration i +1, and the rendering result of itera-
tion i +1, R
i+1
, will be combined with RF
i
and RB
i
using the following equation to refine the rendering
result of iteration i. R =(RF
i
+(1− alphaRF
i
) ∗
R
i+1
)+(1− alphaRF i ∗ alphaR
i+1
) ∗ RB
i
Repeat
this procedure until the inner most layer is reached.
3.3.2 Rendering When Viewing From a
Non-Orthogonal Viewing Direction
When viewing from a non-orthogonal direction, the
volume transformation can be simplified by trans-
form each slice to an intermediate coordinate system,
sheared object space, for which there is a very simple
mapping from the object coordinate system and al-
lows efficient projection. Then warp the intermediate
image to the image plane to produce the final result.
Given a viewing direction θ, adjacent voxel slice
distance b and adjacent pixel distance d, the rotation
can be approximated by shifting each slice to the right
by a distance of l = b ∗ tan θ. To ensure the pixel
distance in the resulting image is still d after shear-
ing, the ray distance in the sheared object coordinate
should be m = d/ cos θ (Figure 9). After shearing,
re-sampling by interpolation should be performed to
get the voxel density value along the viewing ray.
In our schemes, we use Wavelet shear-warp fac-
torization. The difference with the above shear-warp
algorithm is we perform it in the Wavelet domain
instead of spatial domain. Factorization of the low
sub-band LLL
i
coefficients in fovea area in each
level will approximate that of the whole volume. As
mentioned above, coefficients in fovea area of all
levels is approximately 2000 times smaller than the
original volume data size, thus Wavelet shear-warp
avoids tedious shearing of the whole data set and
tremendously reduces the computational complexity.
After shearing of Wavelet coefficients, they will be
input to the algorithm mentioned in orthogonal ren-
GRAPP 2006 - COMPUTER GRAPHICS THEORY AND APPLICATIONS
72
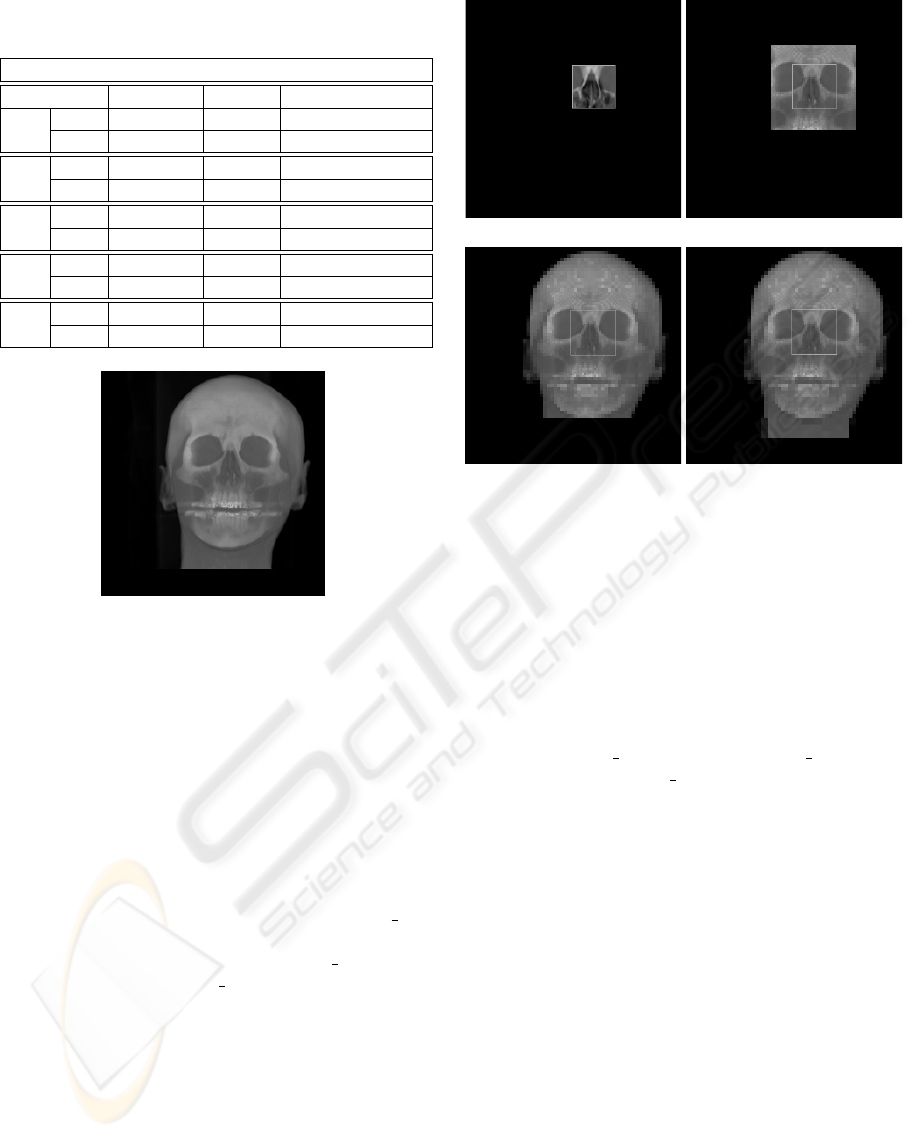
Table 3: Experiment results of the two progressive render-
ing schemes.
Experiment Results
Data(int) Image Trans/Render(s)
Itr Sche1 529,054 Fig 11(a) 0.381/0.0472
I Sche2 56,564 Fig 12(a) 0.1468/0.047
Itr Sche1 384,860 Fig 11(b) 0.125/0.0154
II Sche2 353,946 Fig 12(b) 0.1154/0.0222
Itr Sche1 296,938 Fig 11(c) 0.0938/0.0156
III Sche2 440,340 Fig 12(c) 0.1404/0.0156
Itr Sche1 0 Fig 11(d) 0.0/0.0
IV Sche2 360,002 Fig 12(d) 0.1092/0.0158
Sum Sche1 1,210,852 – 0.5998/0.0782
Sche2 1,210,852 – 0.5118/0.1006
Figure 10: Direct rendering result.
dering and produce an intermediate image by normal
projection. Warp function will then be executed on
the intermediate image to produce the final image.
4 EXPERIMENTAL STUDY
In our experiment, we use cross-section of human
head as our example. The size of the volume data
is 256
3
, size of the average image is 16
3
, thus m l =
log
2
(256/16) = 4. Wavelet volume W is divided
into blocks of size 8
3
.Givenmask center =
{128, 128, 128} and mask
size = {50, 50, 50},we
will compare in each iteration, the result image, data
amount being transmitted and time of two schemes.
The experiment showed that, in the first region-
based algorithm. The client can see his most inter-
ested region-of-interest(ROI) at the first iteration. and
the client will have to wait more than two times of
the time (0.5118 second comparing to 0.381 second)
for the inner most ROI to arrive in second algorithm:
coarse-to-fine, which is not desirable. Furthermore,
region-based rendering algorithm can give a clearer
rendering result of ROI. In coarse-to-fine algorithm,
low resolution details arrive first and high resolution
(a) (b)
(c) (d)
Figure 11: Four iterations of the region-based scheme.
inner layer arrives later. Thus its clarity will be in-
terfered by low resolution coefficients. However, the
client waits less time for the first rendering result to
be displayed on the client site in coarse-to-fine al-
gorithm, 0.1468 second comparing to 0.381 second.
ROI is highlighted with a square in each figure.
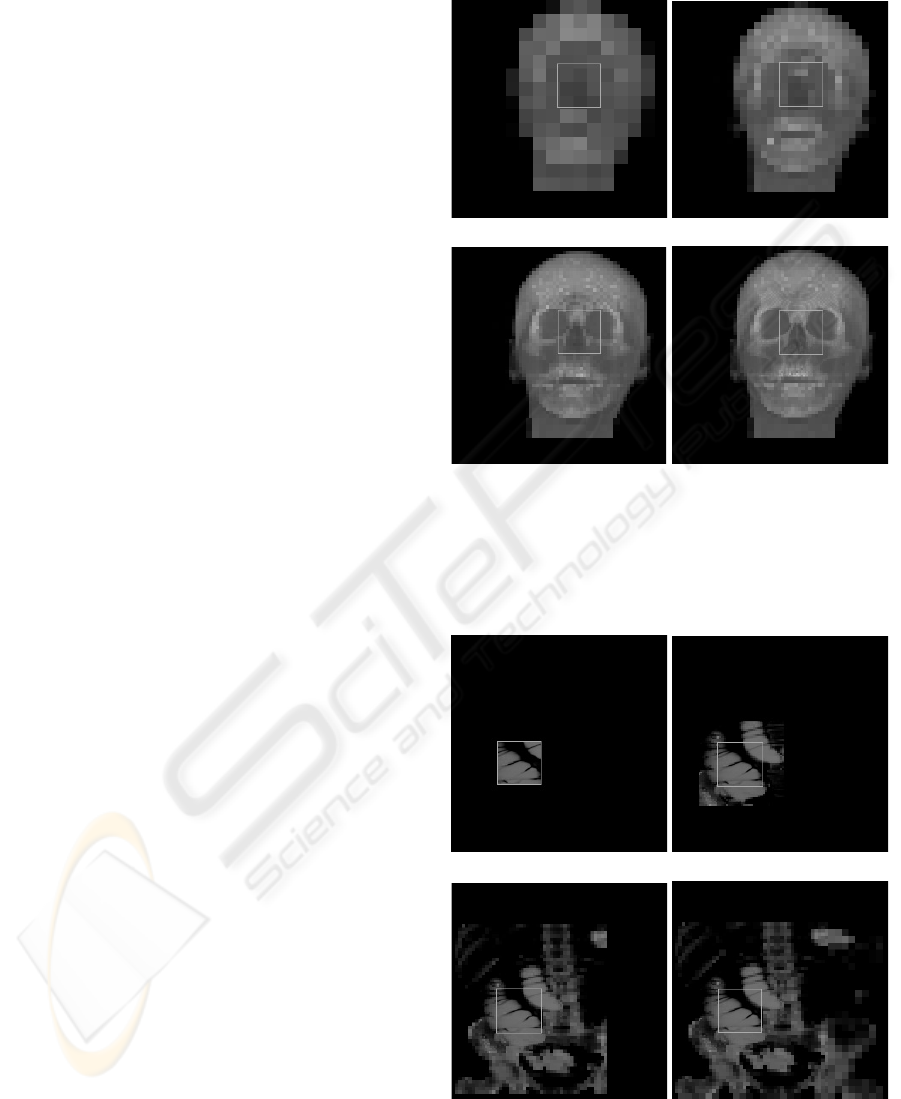
Another example we take here is cross-section of
human dummy with size 256
3
. Size of the average
image is 16
3
, m l =4.Givenmask center =
128, 128, 128 and mask
size =50, 50, 50. (Figure
13 and Figure 14)
5 CONCLUSION
Our work in this paper aimed at accessing to large
scale volume data stored on server repository and pro-
gressively rendered on client site in multiresolution.
In our solution, there are two ways of progressive
transmission/rendering: region-based and coarse-to-
fine schemes. They are based on Wavelet foveation.
The experimental study confirmed the effectiveness of
the solution.
REFERENCES
Bhaniramka, P. and Demange, Y. (2002). Opengl volu-
mizer: a toolkit for high quality volume rendering of
large data sets. In Proc. of IEEE VolVis, pages 45–54.
PROGRESSIVE TRANSMISSION AND RENDERING OF FOVEATED VOLUME DATA
73
Chang, E. C., Mallat, S., and Yap, C. (2000). Wavelet
foveation. Applied and Computational Harmonic
Analysis, 3(4):312–336.
Engel, K., Kraus, M., and Ertl, T. (2001). High-quality
pre-integrated volume rendering using hardware-
accelerated pixel shading. In Proc. of Eurographics /
SIGGRAPH Workshop on Graphics Hardware, pages
9–16.
Gross, M. H., Lippert, L., Dittrich, R., and Haring, S.
(1997). Two methods for wavelet-based volume ren-
dering. Computer & Graphics, 21(2):237–252.
Guthe, S., Wand, M., Gonser, J., and Strasser, W. (2002). In-
teractive rendering of large volume data sets. In Proc.
of IEEE Visualization, pages 53–60.
Hancock, D. J. and Hubbold, R. J. (1997). Efficient image
synthesis on distributed architectures. In R. Earnshaw
and J. Vince, editors, The Internet in 3D, Information,
Images and Interaction, Academic Press, pages 347–
364.
Ihm, I. and Park, S. (1998). Wavelet-based 3d compres-
sion scheme for very large volume data. In Proc. of
Graphics Interface, pages 107–116.
Kim, T. and Shin, Y. (1999). An efficient wavelet-based
compression method for volume rendering. In Proc.
of Pacific Graphics, pages 147–156.
Lacroute, P. and Levoy, M. (1994). Fast volume rendering
using a shear-warp factorization of the viewing trans-
formation. In Proc. of SIGGRAPH, pages 451–458.
Meissner, M., Huang, J., Bartz, D., Mueller, K., and Craw-
fis, R. (2000). A practical evaluation of popular vol-
ume rendering algorithms. In Proc. of IEEE VolVis,
pages 81–88.
Norton, A. and Rockwood, A. P. (March 2003). Enabling
view-dependent progressive volume visualization on
the grid. IEEE Computer Graphics and Applications,
23(2):22–31.
Pinnamaneni, P. (2003). Wavelet-Based Volume Rendering.
PhD thesis, Mississippi State University.
Pinnamaneni, P., Saladi, S., and Meyer, J. (2002). Remote
transformation and local 3d reconstruction and visual-
ization of biomedical data sets in java3d. In Proc. of
SPIE Visualization and Data Analysis 2002, volume 2,
pages 44–54.
Westenberg, M. A. and Roerdink, J. B. (2000). X-ray vol-
ume rendering by hierarchical wavelet splatting. In
Proc. of ICPR, volume 3, page 3163.
Westover, L. (1990). Footprint evaluation for volume ren-
dering. In Proc. of the 17th annual conference on
Computer graphics and interactive techniques, pages
367–376.
(a) (b)
(c) (d)
Figure 12: Four iterations of the coarse-to-fine scheme.
(a) (b)
(c) (d)
Figure 13: Four iterations of the region-based scheme.
GRAPP 2006 - COMPUTER GRAPHICS THEORY AND APPLICATIONS
74
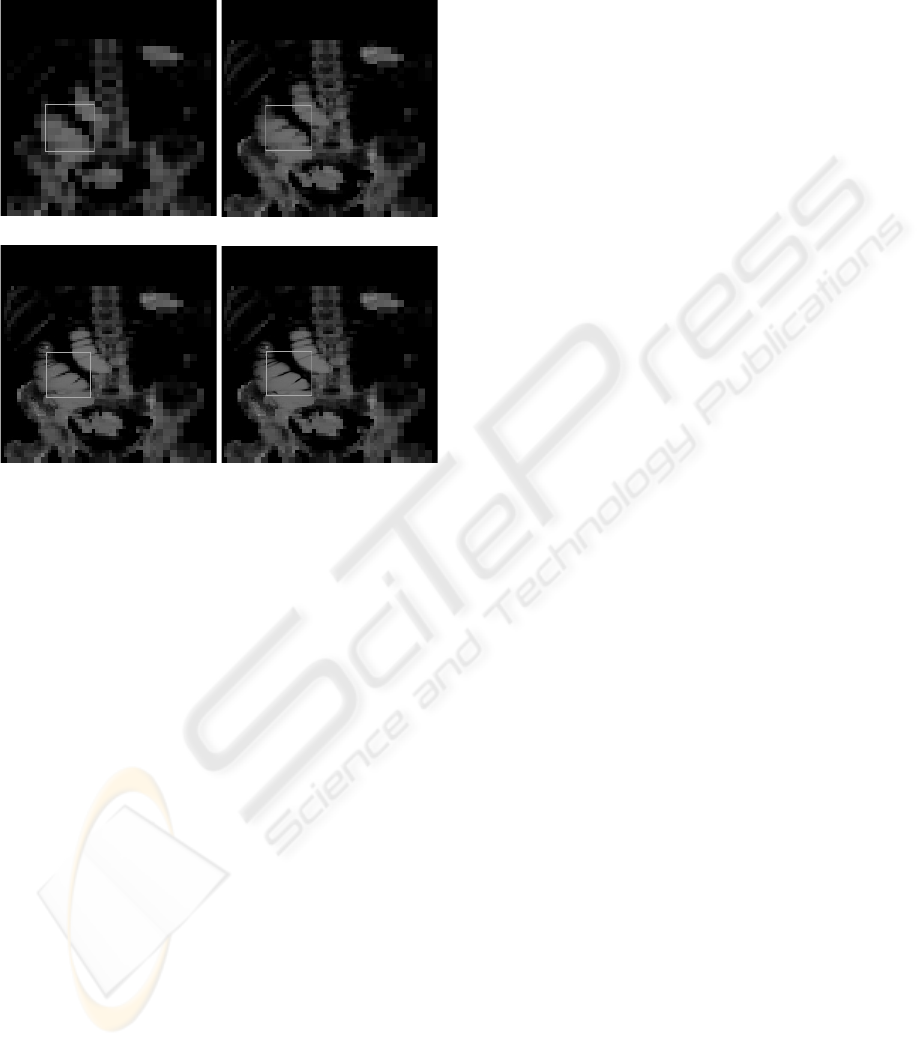
(a) (b)
(c) (d)
Figure 14: Four iterations of the coarse-to-fine scheme.
PROGRESSIVE TRANSMISSION AND RENDERING OF FOVEATED VOLUME DATA
75
