
URBAN CITY PLANNING IN
SEMI-IMMERSIVE VIRTUAL REALITY SYSTEMS
Frank Steinicke, Timo Ropinski, Klaus Hinrichs and J
¨
org Mensmann
Institut f
¨
ur Informatik, WWU M
¨
unster
Einsteinstraße 62, 48149 M
¨
unster, Germany
Keywords:
Urban planning, virtual reality, user interfaces, interaction metaphors.
Abstract:
Virtual reality based geographic information systems (VRGIS) have been successfully employed for urban
planning and architectural design in recent years. Tracking technologies and stereoscopic visualization of
three-dimensional structures allow a better insight into complex datasets. Unfortunately, these systems often
lack intuitive interaction concepts and therefore reduce VRGIS to advanced visualization environments, since
manipulation of the content is not or only rudimentarily possible. In this paper, we present a geographic infor-
mation system for urban planning tasks in semi-immersive virtual reality (VR) systems. The objective of this
approach is to provide professional city planners with an enhanced VR interface, which enables comfortable
interaction concepts similar to the interactions of the real-world planning task. To assure the usability and
relevance of the developed system, urban planners have cooperated closely in the development process. In this
paper both the hard- and software architecture of the entire system as well as VR related interaction metaphors
and their evaluation are discussed.
1 INTRODUCTION
Urban planning tasks are of major importance for civil
works since both the environment and the inhabitants
of a city are affected. The cityscape as well as the
quality of life of the residents essentially depend on
the appearance of buildings, road networks, planting,
green spaces, and recreation areas such as parks and
playgrounds. To facilitate a realistic impression of
how a building area would visually integrate into the
environment and to enable communication regarding
development proposals, it is important to present in-
termediate results of the planning process properly as
well as comprehensible.
Therefore, by using two-dimensional CAD con-
cepts urban planners design development plans for a
certain area based on existing cadastral data, which is
available for every town in Germany. As depicted in
Figure 1 (left) cadastral data usually contains build-
ing footprints, number of floors and floor’s height for
each building, parcel boundaries, and other informa-
tion. Within such a development plan, urban planners
define entities, for example buildings and recreation
areas, associated with a set of constraints, which spec-
ify what types of geobjects are allowed and what re-
quirements have to be incorporated. After urban plan-
ners have agreed to a certain development plan, two
different procedures are commonly used.
One approach is to deliver the development plan to
an architectural office. On the basis of this plan archi-
tects generate virtual 3D models and return exemplary
three-dimensional visualizations of these planned ar-
eas to the urban planner. This procedure has the fol-
lowing two major shortcomings. First, the returned
visualizations are static insofar as the 3D models can-
not be explored interactively by the urban planners.
Second, modifications to the 3D models, which, for
instance, have been proposed after reviewing the 3D
visualization, cannot be performed by urban planners.
Instead, the architectural office has to be asked again
to incorporate these modifications into the 3D model.
During a planning task, this usually takes several iter-
ations resulting in inefficiency as well as unnecessary
expense.
The second common alternative to communicate
urban development proposals is to build a physical
block model usually made of wood, plastic or pa-
per. Figure 1 (right) illustrates such a physical block
model for the development plan in Figure 1 (left).
After a physical block model has been finished, per-
192
Steinicke F., Ropinski T., Hinrichs K. and Mensmann J. (2006).
URBAN CITY PLANNING IN SEMI-IMMERSIVE VIRTUAL REALITY SYSTEMS.
In Proceedings of the First International Conference on Computer Graphics Theory and Applications, pages 192-199
DOI: 10.5220/0001353001920199
Copyright
c
SciTePress
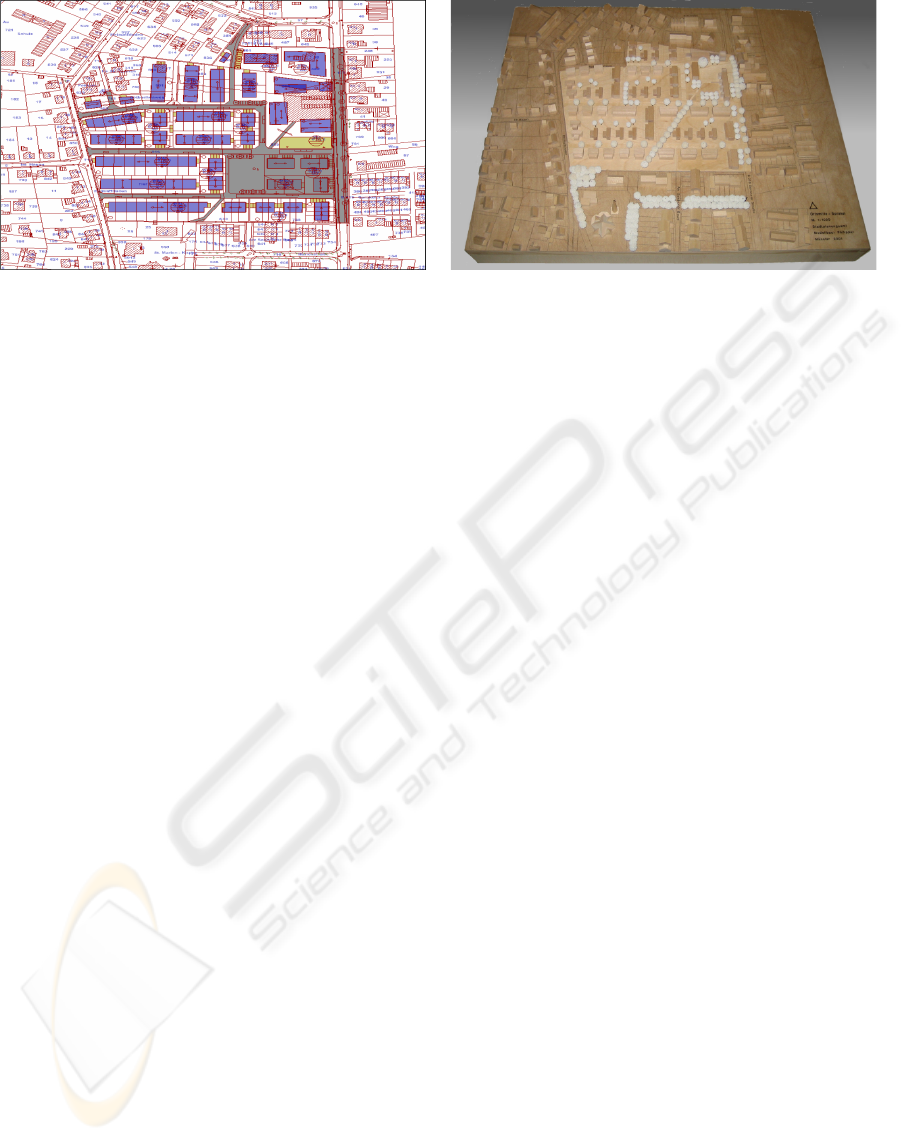
Figure 1: Example section of an urban development plan within cadastral information (left) and a corresponding physical
block model made of wood downscaled to 1:1000 (right).
forming modifications is often awkward, since most
elements are inflexible and fixated to the model, so
that they have to be removed and replaced by new el-
ements. Furthermore, the creation of these models is
a very time consuming task, which requires high ef-
forts in terms of money and manpower. Thus, simpler
solutions to visualize planned development areas are
desired.
In cooperation with the urban development, city
planning and transport planning office as well as the
land surveying and land registry office of the city of
M
¨
unster in Germany, we have developed solutions for
these problems. An objective of this cooperation is
to develop computer-aided concepts, which serve the
needs of professional urban planners and provide a
convenient alternative to current planning tasks. Ur-
ban planners demand that the developed strategies
should be based on their current processes resulting in
physical block models as well as computer generated
3D visualizations. However, the city planners desire
to have more independent and sophisticated control
over both approaches; they want to be able to generate
virtual 3D city models and create three-dimensional
visualizations autonomously. Furthermore, the intu-
itive comprehension when viewing a physical block
model should be obtained.
In consideration of these two major demands, we
decided to develop an interactive 3D residential city
planning software system, which runs in virtual re-
ality (VR) systems as well as in desktop-based envi-
ronments. To ensure the adaptation of the planning
system into already existing systems and databases,
a geographic information system (GIS) interface has
been integrated to import the required data. Virtual
reality based geographic information systems (VR-
GIS) are increasingly used for planning tasks, since
VR technologies provide better perception and com-
prehension of complex 3D structures (Beck, 2003).
Unfortunately, these systems often lack intuitive inter-
action concepts and therefore VRGIS are degraded to
exploration systems (Dodge et al., 1998; Beck, 2003).
In order to enhance the interaction in VRGIS we have
developed intuitive interaction metaphors which facil-
itate the efficient design of building plans in a highly-
interactive way.
In this paper, we present the system architecture
and setup of the 3D residential city planning sys-
tem. In particular, we propose advanced concepts for
generic interaction tasks, whose benefits have been
proven in usability studies. The paper is structured
as follows. In Section 2 the table-top-based VR sys-
tem and its benefits are discussed. In Section 3 the
architecture of the interactive 3D residential city plan-
ning software is explained in detail. In Section 4 con-
cepts which facilitate an intuitive interaction within
both VR systems as well as desktop environments are
proposed and their evaluation is discussed . Section 5
concludes the paper and gives an overview of future
research directions.
2 SEMI-IMMERSIVE VIRTUAL
REALITY SETUP
Since professional urban planners desire to main-
tain intuitive comprehension obtained when viewing
a physical block model, we have chosen a semi-
immersive RWB environment in combination with an
optical tracking system to visualize interactive vir-
tual 3D city models. In comparison to physical block
models, the usage of such a VR system setup enables
an improved interaction with potential building plans,
because interactive modification, e.g., texturing and
altering of building parameters, can be incorporated.
The components of the VR system are explained in
the next subsections.
URBAN CITY PLANNING IN SEMI-IMMERSIVE VIRTUAL REALITY SYSTEMS
193
1020mm
left camera
right camera
1000mm
400mm
1360mm
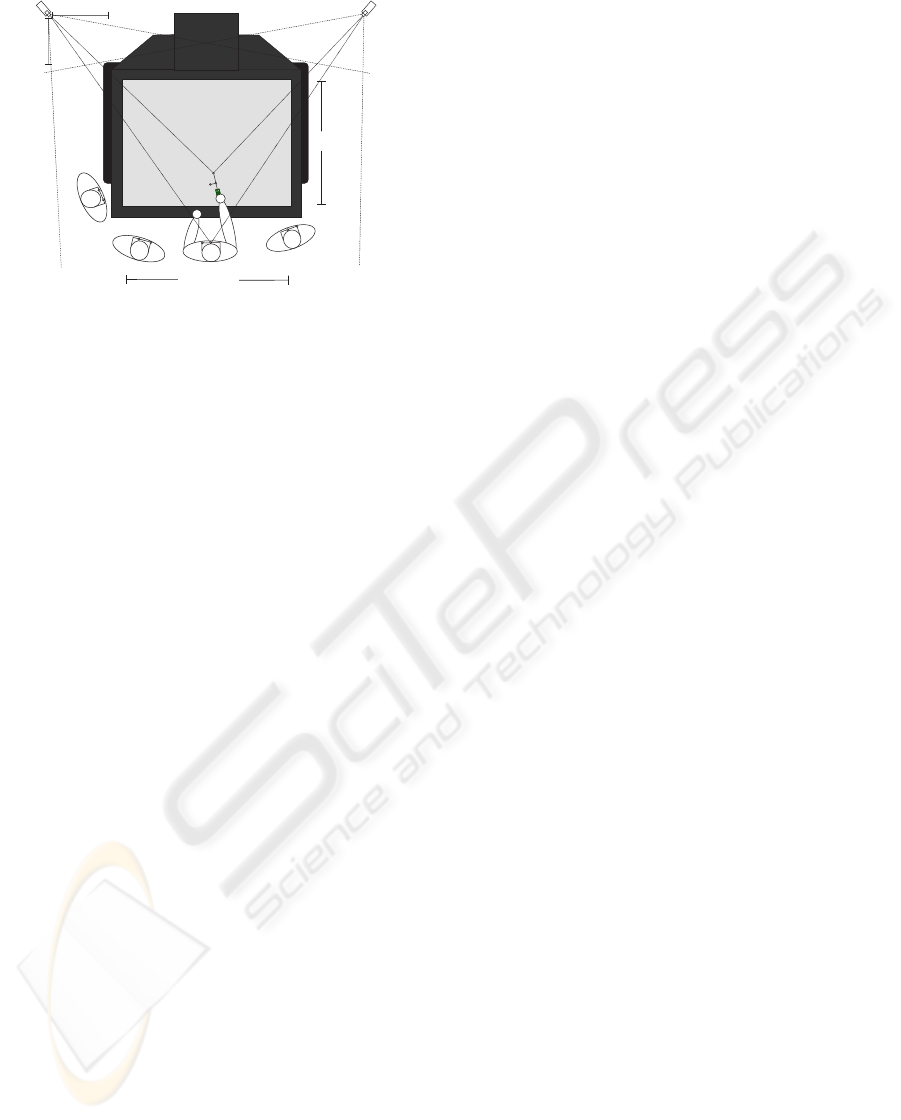
Figure 2: Conceptual view of the semi-immersive RWB.
Two cameras track the area in front of the RWB, where
four users collaborate (adapted from (Dorfm
¨
uller-Ulhaas,
2002)).
2.1 Responsive Workbench
A Barco BARON responsive workbench (RWB)
(Kr
¨
uger et al., 1995), is used to present 3D city mod-
els stereoscopically in a way that enables urban plan-
ners to work in an environment they are accustomed
to. The horizontal or tilted workspace of the RWB
is a well known table-top metaphor many profession-
als are familiar with (see Figure 2). The images are
projected onto the display’s surface so that planners
perceive virtual 3D models as being attached to the
surface (see Figure 3 (right) and Figure 5). This is
due to the fact that the images are rendered stereo-
scopically with negative parallax. The images are dis-
played in sequence and are synchronized with active
shutter glasses the professional urban planners have
to wear. The stereo glasses are transparent, therefore
real-world objects such as the RWB and input devices
can be seen and users are semi-immersed into the vir-
tual world.
The workbench is about 2m × 2m large and 1.2m
high. The display screen measures 1.36m × 1.02m
with a maximum pixel resolution of 1280× 1024. The
maximum refresh rate of 120Hz is ensured with a res-
olution of 1024× 768 pixels, which supports comfort-
able working without flickering effects. As illustrated
in Figure 2 the size and resolution of the workbench
allows several planners to view virtual 3D models
in a stereoscopic projection. City planners can walk
around the RWB in order to view the virtual 3D city
model from different perspectives. To enable such an
exploration from multiple view positions, the system
must be aware of the user’s current position, which
determines the virtual camera’s position and orienta-
tion accordingly. For this purpose tracking systems
are used.
2.2 Tracking System
High accuracy and wireless interaction is indispens-
able for precise and comfortable urban planning,
therefore an optical tracking system is used to deter-
mine the position of the planners as well as their in-
put devices. The accuracy of the stereo-based opti-
cal tracking systems is in the range of submillimeters,
and thus tracking errors are minor and precise interac-
tions with objects displayed on the RWB are possible.
Since lighting conditions around the RWB have to be
darkened because the brightness of the projection it-
self is limited, infrared (IR) light in combination with
IR-filters is used. The operation area of the track-
ing system is determined by the physical measures of
the workbench, a volume of about 3m × 3m × 1.5m
has to be scanned. To enable an optimal tracking
of this area two cameras are arranged above and be-
side the workbench as depicted in Figure 2. unit Be-
cause of the many drawbacks of IR-LEDs, we have
decided to use passive markers to be tracked by the
system. These markers are made of small spheres
covered with reflective material, so that light emitted
by an IR-spot, which is positioned close to the cam-
era lens, is reflected back to the camera. Only the re-
flected IR light of the markers passes through a filter,
which is attached to the front of the lens. With cor-
responding tracking algorithms (Dorfm
¨
uller-Ulhaas,
2002) the position of each marker and thus the po-
sition and orientation of unique rigid body arrange-
ments of such markers can be determined.
2.3 Input Devices
Passive marker tracking provides more flexibility in
comparison to other technologies, e.g., electronic or
magnetic approaches. Attaching certain devices with
a unique rigid body arrangement of at least three
markers results in arbitrary 6 degrees of freedom
(DoF) input devices, i.e., devices whose position and
orientation can be tracked. However, further input
events such as button events and gestures are required
to manipulate a development plan. For this purpose,
we have equipped urban planners with Fakespace
pinch data gloves, which provide a gesture-based
recognition system. Furthermore, we use a hap-
tic input device, which supports planning by vibra-
tion feedback. In combination with acoustic signals
this information can be used to give feedback about
invalid interactions, e.g., collisions between virtual
buildings during the planning process. This device is
equipped with two input buttons, passive markers and
the vibration unit, which enables transmission of hap-
tic signals with different intervals. The buttons can be
used similar to the buttons of a standard mouse, e.g.,
the left button for selection tasks, the right button to
open 3D context menus.
GRAPP 2006 - COMPUTER GRAPHICS THEORY AND APPLICATIONS
194

3 3D RESIDENTIAL CITY
PLANNER
The objective of the 3D residential city planning ap-
plication is to provide urban planners an intuitive and
natural interface to plan and modify residential areas
within desktop- and VR-based system environments.
In the following sections the architecture and main
components of this system are introduced.
3.1 Architecture
During the development phase of the application, city
planners express their desire for flexible approaches
for the visualization of generated virtual 3D city
models. Although photorealistic rendering is im-
portant, it is not the only requirement; especially
non-photorealistic rendering supports to comprehend
structures and relations similar to view physical block
models. Furthermore, during exploration interactive
frame rates are more important than photorealistic ap-
pearance. However, realistic visualizations similar to
the renderings provided by architectural offices are
desired.
Due to these demands, we have chosen VRS,
the Virtual Rendering System (D
¨
ollner and Hinrichs,
2002), as core graphics library for building 3D city
models. VRS is an object-oriented and scenegraph
based C++ graphics library. It introduces the usage of
two different graphs. Geometry graphs, which store
the visual appearance of virtual objects collected in
scene nodes, are combined with behavior graphs to
represent their behavior in terms of interaction and
animation. Different renderings are ensured with this
library, since VRS provides wrapping classes to pho-
torealistic renderers, such as POVRay or Radiance,
but also real-time renderers, e.g., OpenGL, are sup-
ported. Changing the used rendering system without
the need for modification of an application’s source
code. Furthermore, VRS is extensible to a VR soft-
ware system by using the Virtual Reality VRS (VR
2
S)
component (Steinicke et al., 2005a), which handles
all VR related issues.
3.2 Main Components
The 3D residential city planner consists of four con-
ceptual components:
1. Converter tool: The converter tool parses and con-
verts the cadastral data into a scenegraph structure,
which is used to represent the corresponding geo-
data.
2. Geoobject model: The geoobject model is the col-
lection of geoobjects and their properties. This
model is generated during the parser process of
the converter tool. Components of this model are
buildings, building and traffic areas, trees etc.
3. Visualization component: This component con-
structs the scenegraph representing the topological
structure of the city model. Each scene node in the
geometry graph representing a collection of geoob-
jects is associated with a visual appearance, e.g., by
assigning colors or textures.
4. Interaction component: The interaction compo-
nent manages required interactions with virtual 3D
city models. A graphical user interface (GUI)
based on wxWidgets allows to access certain inter-
actions. Alternatively, direct interaction concepts
such as arrangement of virtual buildings are incor-
porated.
The converter tool parses the cadastral data and gen-
erates a scenegraph data structure containing the cor-
responding geodata. Since the cadastral data is geo-
referenced, virtual 3D city models can be gener-
ated automatically. Because there is no overall ac-
cepted standard for storing cadastral information, we
have developed an interface which provides the re-
quired generality and flexibility to enable import of
cadastral data from different sources. For instance,
for the city of M
¨
unster the cadastral data stores
building footprints, number of floors, parcel bound-
aries and other information in Gauß-Kr
¨
uger coordi-
nates, which are converted during the reconstruction
process. Based on this information the system gen-
erates a geo-referenced virtual 3D city model of the
surrounding area, which is superimposed with aer-
ial photographs to provide more realism and higher
recognition.
Within the geoobject model all geoobjects are ag-
gregated in the class CityModel, which adminis-
trates all required information for a geo-referenced
city model. Instances of type GeoObject provide
the base from which all geoobjects, for example in-
stances of type Building or ParcelArea, inherit.
An instance of the class Building consists of one or
more BuildingParts for handling different types
of stories and roofs. The other geoobjects are orga-
nized analogously.
The visualization component is separated from the
geoobject model of the virtual city. All required
information to visualize the objects of an instance
of the class GeoObject is handled via the class
AppearanceManager. The visual appearance of
each geoobject can be assigned randomly, or the city
planner can define the appearance, for example by as-
signing specific textures to each geoobject. As men-
tioned above VRS uses a scenegraph to represent vir-
tual scenes. Since generated virtual 3D city mod-
els may consist of over 50,000 complex, textured
geoobjects, it is not recommend to store each of these
geoobjects in corresponding scene nodes, because
URBAN CITY PLANNING IN SEMI-IMMERSIVE VIRTUAL REALITY SYSTEMS
195
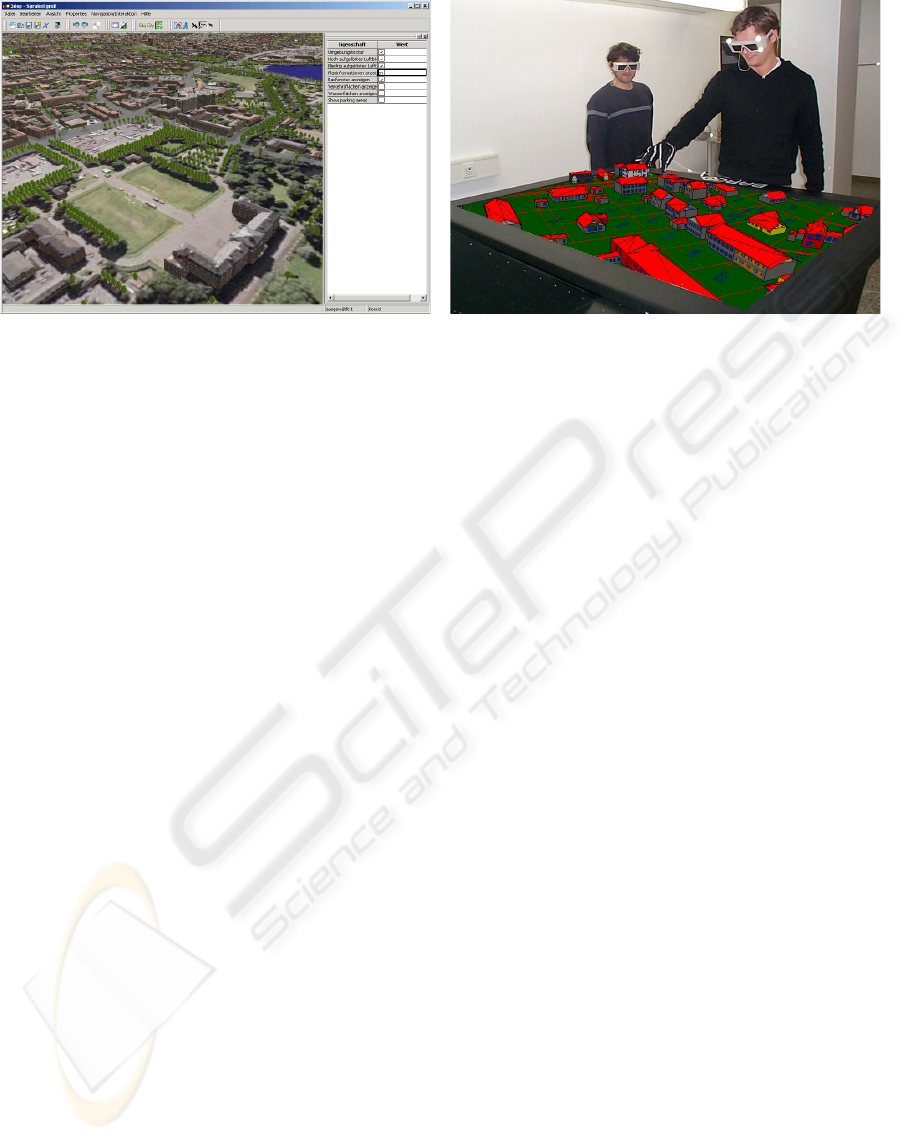
Figure 3: Example photorealistic visualization of a generated 3D city model within the GUI (left) and NPR of the cadastral
data shown in Figure 1 on the workbench (right).
this would inflate memory requirements for storing
the scenegraph and decrease performance when eval-
uating it. Due to the wrapping mechanism of VRS it
is possible to store these enormous datasets with ren-
derer specific optimization strategies.
To assist the city planners during the design process
the graphical representation of both the cadastral plan
as well as the building plan can be projected onto the
virtual 3D city model (see Figure 3 (right)). To further
increase performance, optional view-dependent level-
of-detail algorithms are integrated to enable switching
between different levels of realism. Furthermore, it
is possible to switch between non-photorealistic and
photorealistic rendering.
Besides the standard menu-based interaction con-
cepts, such as creation, arrangement or deletion of
virtual buildings, different navigation and traveling
metaphors can be chosen via menu entries. These ex-
ploration metaphors as well as arrangement of geoob-
jects can be performed in a direct way without us-
ing the menu. These techniques include flying, glid-
ing, walking and ufo-viewing metaphors, i.e., an ex-
ploration with orthogonal view onto the city model.
When exploring a city model, arbitrary locations can
be stored as visual bookmarks to be accessed later on,
for example to generate smooth camera motions along
a resulting path.
When working in desktop-base environments, pro-
fessional city planners have to handle 3D interactions
with 2D input devices, e.g., the standard mouse. To
reduce the cognitive effort for such 3D interactions,
we have integrated 3D widgets (D
¨
ollner and Hinrichs,
1998) into the manipulation process. 3D widgets pro-
vide an easy way to manipulate objects with 6 DoF
by reducing the simultaneously manipulated DoF to
one degree. 3D widgets provide handles for transla-
tion, rotation, and scaling of virtual geoobjects. Thus,
these manipulation tasks can be performed as easily
as in two-dimensions. However, as illustrated in Fig-
ure 5, 3D widgets can also be used in VR.
4 VIRTUAL REALITY
INTERACTION CONCEPTS
As mentioned above VRGIS environments lack intu-
itive interaction concepts. In this section VR-based
interaction metaphors integrated in the 3D residen-
tial city planner are introduced. These generic inter-
action tasks include exploration concepts for collab-
orative interaction in the RWB environment and ad-
vanced manipulation strategies to design, explore and
communicate virtual 3D development plans.
4.1 Collaborative Exploration
When designing a development plan, often several ur-
ban planners with different background, i.e., expertise
and knowledge, are involved. Such cooperations have
been proven to be advantageous since the bundling
of expert’s knowledge has the potential to increase
productivity. Consequently, it is desirable to develop
virtual environments simulating such shared space in
which collaboration can be performed as easily and
naturally as in the real world.
Although the described semi-immersive RWB sys-
tem provides enough space to enable several planners
to interact in a collaborative way, the teamworking
process is constrained due to the shortcoming that
usually only one user is head-tracked and thus per-
ceives a fully perspective-correct stereoscopic image.
Hardware-based solutions to this problem involve re-
duction of the refresh rate (Agrawala et al., 1997).
GRAPP 2006 - COMPUTER GRAPHICS THEORY AND APPLICATIONS
196
Because of physical constraints, these approaches are
hard to scale. Hence, we have developed a software-
based collaboration environment that allows several
city planners to work together in the RWB environ-
ment. The only requirement to enable such a col-
laboration is that each planner who wants to partic-
ipate in the collaboration process has to wear tracked
glasses so that the planners’ head positions can be
determined. Therefore, all input devices and tracked
glasses have to be registered by the tracking system.
If this prerequisite is fulfilled, group activity can be
performed by using two different strategies:
1. Cooperative interaction mode, i.e., tasks are ac-
complished consecutively. For example, one city
planner modifies the development plan and after-
wards a second planner continues the work.
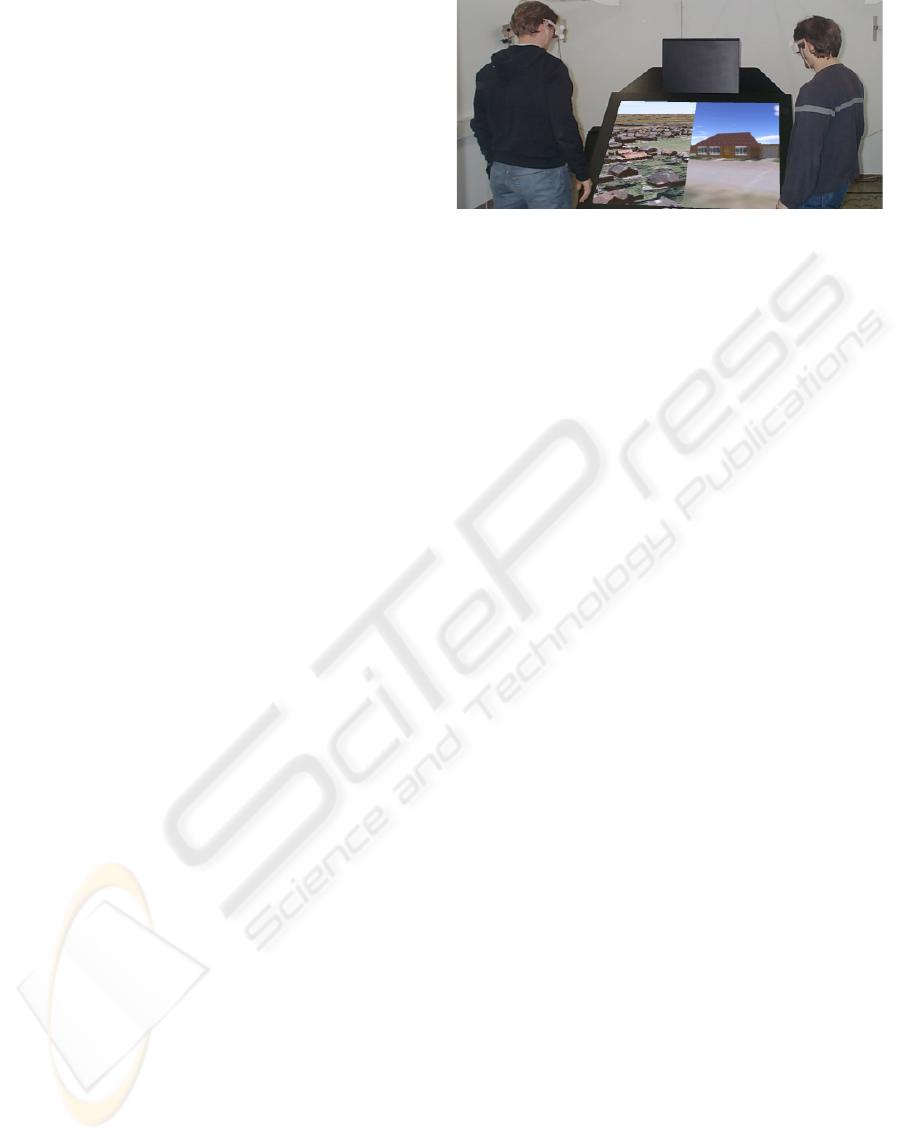
2. Split-screen collaboration mode, i.e., users col-
laborate simultaneously. For example, one city
planner creates virtual buildings and provides them
to another planner who arranges them on a building
area.
In both modes active planners, i.e., currently inter-
acting urban planners, perceive a perspective-correct
stereoscopic image either on the entire projection
screen or in different viewports on a tiled screen. Be-
fore any cooperative or collaborative interaction can
be started potential participants need to register. Reg-
istration can be performed by miscellaneous strate-
gies, e.g., posing gestures or using speech commands.
When an urban planner has registered for the coop-
eration and this registration has been accepted, e.g.,
an active planner or administrator confirms the reg-
istration by gestures, this registered planner gets ac-
tive, i.e., his head and input devices are tracked and
used for the interaction. In the case of the cooper-
ative interaction mode, the registered urban planner
switches the state from a passive planner, who only
observes the scene, to the active planner and the pre-
vious active planner gets passive. When a registration
process of an urban planner has been accepted in the
split-screen collaboration mode, the screen is tiled so
that the additional active collaborator is assigned his
own viewport, whereas the viewports of other active
collaborators are scaled down accordingly. Each ac-
tive collaborator perceives perspective-correct stereo-
scopic images in his viewport, therefore interactions
can be performed comfortably.
The introduced concepts allow city planners to
communicate and work together in a very natural
way. A typical planning situation benefiting from the
collaborative interaction mode divides the work into
two subprocesses. One urban planner creates virtual
buildings via the GUI by defining building footprints,
heights, roof types and textures etc., while a second
city planner arranges these buildings in the develop-
ment plan. Hence, planning processes can be accel-
Figure 4: Two users collaborating in the a tiled viewport
arrangement.
erated and optimized since several planners can com-
bine their knowledge and abilities. In Figure 4 the 3D
residential city planning software runs in a two-user
split collaboration mode, in which both planners per-
ceive perspective-correct stereoscopic images.
4.2 Manipulation
The concepts described in Section 4.1 enable several
urban planners to explore virtual 3D city models.
The aforementioned typical situation in which two
planners collaborate, e.g., the first urban planner
creates virtual buildings, while the second planner
arranges them, involves many problems when using
current manipulation metaphors. While GUI-based
interaction, for instance, generating buildings can
be performed very comfortably in desktop-based
environments or on a personal-interaction-panel in
VR (Szalav
´
ari and Gervautz, 1997), 6 DoF manipula-
tions of these virtual buildings are often complicated.
Although VR environments provide the possibility
to manipulate virtual objects in an intuitive manner,
e.g., by using a virtual hand or a virtual pointer
(Mine, 1995), these concepts are often constrained,
because in VR the cognitive effort for a city planner is
definitely higher than the corresponding effort in the
real world. In addition, it is often difficult to perform
precise interactions because of tracking errors and
hand tremors. For example, it is hard to select small
resp. distant objects or items, e.g., the described han-
dles of 3D widgets, with a virtual pointer or virtual
hand in VR. Hence, generic interaction tasks need to
be enhanced. In order to achieve this goal we propose
the improved virtual pointer (IVP) metaphor, which
avoids most of the aforementioned disadvantages
of current interaction metaphors (Steinicke et al.,
2005b). This approach allows the city planner to se-
lect a desired geoobject or item with a virtual pointer
without requiring an exact hit. While a straight ray
is used to indicate the direction of the virtual pointer,
an additionally visualized bendable ray points to
the closest selectable geoobject (see Figure 5). The
URBAN CITY PLANNING IN SEMI-IMMERSIVE VIRTUAL REALITY SYSTEMS
197
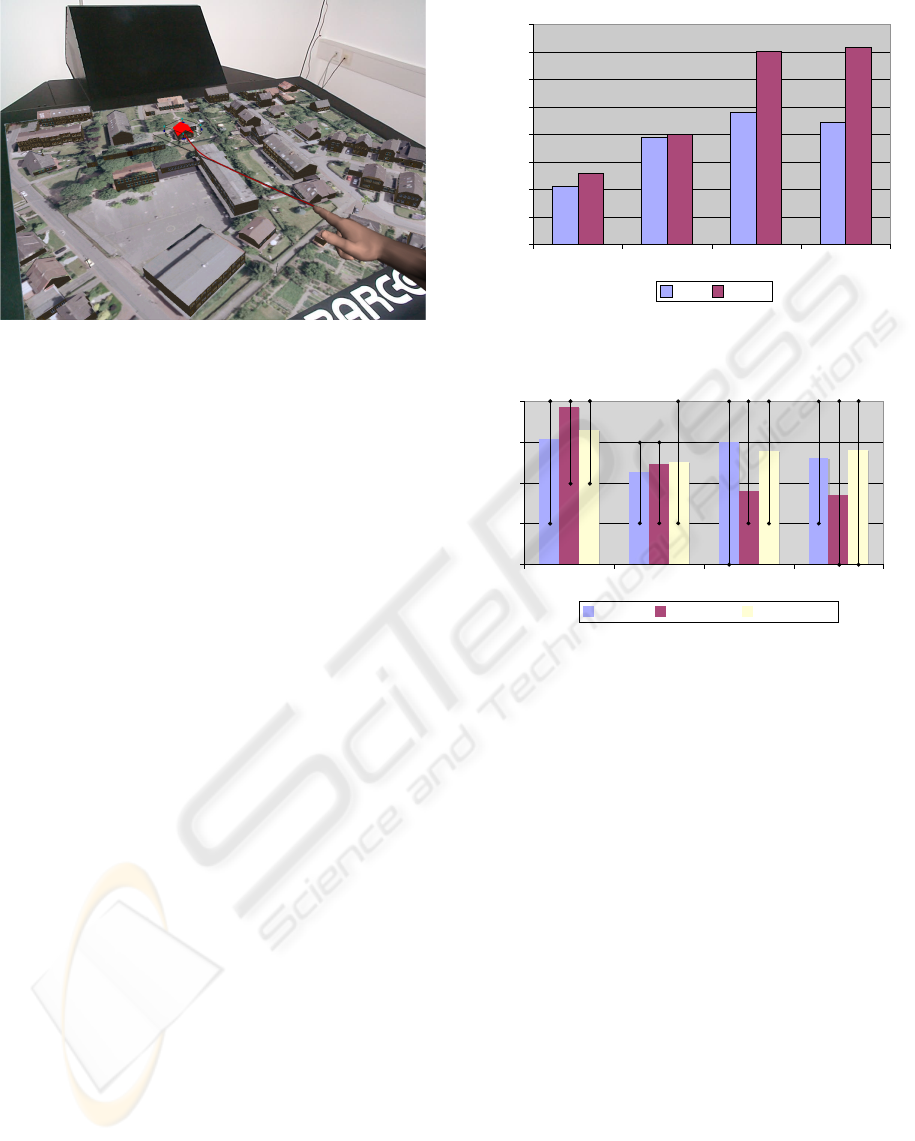
Figure 5: Virtual 3D city model and improved virtual
pointer as seen from a city planner’s view.
closest selectable geoobject which would be chosen
if the city planner would perform a selection, e.g.,
by pressing a button or by pinching a glove, is called
active geoobject. Since this geoobject is determined
in a pre-evaluation phase of the scenegraph with
simple geometric calculations, this results in almost
no performance loss. After selecting the active
geoobject, manipulations can be performed similar
to the manipulations of physical block models. The
movements of the virtual input device are transferred
by a scaled one-to-one mapping to the selected
geoobject, which supports also the manipulation of
distant objects. Due to this mapping strategy virtual
geoobjects can be arranged very comfortably and
intuitively.
4.3 Evaluation
In this section the evaluation of the concepts de-
scribed in Section 4.1 and Section 4.2 is discussed.
The subjects chosen for the test series were fa-
miliar with residential planning environments. Most
subjects were geoinformatic students, but also land-
scape ecologists, computer scientists and mathemati-
cians participated in the usability study.
4.3.1 Evaluation of Exploration Concepts
We have tested both proposed cooperative and col-
laborative interaction modes for usability in a pre-
liminary user study with 7 participants. The partic-
ipants were equipped with tracked shutter glasses and
pinch gloves for the registration process. Registration
had to be initiated by simple gestures combined with
acoustic feedback giving an indication which user
wanted to participate in the collaboration and which
user was currently active. Up to three participants had
to explore virtual 3D city models simultaneously by
0
1
2
3
4
5
6
7
8
IVP Sticky-Ray Ray-Casting Sticky-Finger
time in seconds
local distant
(a)
1
2
3
4
5
IVP Sticky-Ray Ray-Casting Sticky-Finger
intuitive easy to use easy to learn
(b)
Figure 6: Results of the usability study.
using the described concepts. Afterwards, they were
asked to evaluate the proposed strategies in a user sur-
vey. The results of this survey show that a decreasing
projection size, when splitting the screen into two or
three subviewports, has not disturbed the collabora-
tors in terms of limited space or distraction of other
planners’ viewports. Furthermore, the space in front
of the RWB has been evaluated as large enough for
collaborative interactions. The participants consid-
ered the required gestures for the registration process
as intuitive and easy to learn. Furthermore, the users
evaluated the usage of multimodal feedback, which
supports the users during the interaction, in particular
during the registration process, as very helpful.
4.3.2 Evaluation of Manipulation Concepts
We have evaluated the manipulation concepts in a us-
ability study with 15 participants. During the test se-
ries the subjects had to accomplish several selection
and positioning tasks, i.e., randomly marked virtual
buildings had to be selected and arranged in a devel-
GRAPP 2006 - COMPUTER GRAPHICS THEORY AND APPLICATIONS
198

opment plan by using different interaction metaphors.
These metaphors included the IVP metaphor and a
simplification, called sticky-ray metaphor, the ray-
casting technique, and the sticky-finger technique de-
scribed in (Steinicke et al., 2005b; Bowman and
Hodges, 1997; Pierce et al., 1997). We have eval-
uated the time needed for each subtask and the ac-
curacy achieved with a certain metaphor. The most
significant result is illustrated in Figure 6 (a). This
state-chart shows the time needed for a selection sub-
task when using the different metaphors. The results
clearly show that the IVP metaphor improves effi-
ciency and that selections are performed faster for lo-
cal object selection, i.e., selection in the immediate
reach of the user, as well as for distant geoobjects.
Furthermore, performing manipulations was more ac-
curate and precise using the described IVP metaphor.
After the user study the participants have had to
evaluate the metaphors in a five-point Likert scaled
survey (from 1 to 5 associated with corresponding
ratings). Figure 6 (b) underlines that the participants
have evaluated the IVP metaphor as the most intuitive,
ease to use and easy to learn metaphor in comparison
to the other approaches.
Furthermore, we support the interaction with mul-
timodal feedback. For example, when a selection is
possible, e.g., the selection ray hits a virtual building,
the users perceive a slight vibration and an acoustic
feedback. The intensity of both signals depend on
the position of the virtual building with respect to the
participant’s position. Although in several surveys
participants have evaluated these concepts of mut-
limodality as very helpful, the usage of multimodal
feedback did not increase efficiency. However, the
participants felt convenient and confirmed during in-
teraction processes when receiving multimodal feed-
back.
5 CONCLUSION AND FUTURE
DIRECTIONS
We have proposed a 3D residential city planning ap-
plication for semi-immersive VR systems. Due to
the fact that this system has been developed with co-
operation partners from the domain of urban plan-
ning, their demands could be fulfilled so that they are
motivated to use the application to develop new build-
ing plans. The user studies have proven the usability
and benefits of the proposed concepts.
Currently, the land surveying and land registry of-
fice evaluate a prerelease version and the urban de-
velopment, city planning and transport planning of-
fice will test the software system in a real planning
process soon. When these field studies are finished,
modifications of the actual application or integration
of further functions will be accomplished.
REFERENCES
Agrawala, M., Beers, A., Fr
¨
ohlich, B., Klimetzek, F., and
Bolas, M. (1997). The Two-User Responsive Work-
bench: Support for Collaboration through Individual
Views of Shared Space. In ACM Proceedings of Com-
puter Graphics and Interactive Techniques, pages 327
– 332.
Beck, M. (2003). Real-Time Visualization of big 3D City
Models. International Archives of the Photogramme-
try, Remote Sensing and Spatial Information Sciences,
XXXIV(5/W10).
Bowman, D. and Hodges, L. (1997). An Evaluation of
Techniques for Grabbing and Manipulating Remote
Objects in Immersive Virtual Environments. In ACM
Symposium on Interactive 3D Graphics, pages 35–38.
Dodge, M., Doyle, S., Smith, A., and Fleetwood, S. (1998).
Towards the Virtual City: VR & Internet GIS for Ur-
ban Planning. In Workshop on Virtual Reality and Ge-
ographical Information Systems.
D
¨
ollner, J. and Hinrichs, K. (1998). Interactive, Animated
3D Widgets. In Computer Graphics International
1998, pages 278–286.
D
¨
ollner, J. and Hinrichs, K. (2002). A Generic Rendering
System. IEEE Transaction on Visualization and Com-
puter Graphics, 8(2):99–118.
Dorfm
¨
uller-Ulhaas, K. (2002). Optical Tracking - From
User Motion to 3D Interaction. PhD thesis, Technis-
che Universit
¨
at Wien.
Kr
¨
uger, W., Bohn, C., Fr
¨
ohlich, B., Schuth, H., Strauss,
W., and Wesche, G. (1995). The Responsive Work-
bench: A Virtual Work Environment. IEEE Com-
puter, 28(8):42–48.
Mine, M. (1995). Virtual Environments Interaction Techn-
qiues. Technical Report TR95-018, UNC Chapel Hill
Computer Science.
Pierce, J., Forsberg, A., Conway, M., Hong, S., Zeleznik,
R., and Mine, M. (1997). Image Plane Interaction
Techniques in 3D Immersive Environments. In ACM
Symposium on Interactive 3D Graphics, pages 39–44.
Steinicke, F., Ropinski, T., and Hinrichs, K. (20 05a). A
Generic Virtual Reality Software System’s Architec-
ture and Application. In Proceedings of the 15th In-
ternational Conference on Artificial Reality and Telex-
istence (ICAT05).
Steinicke, F., Ropinski, T., and Hinrichs, K. (2005b). Multi-
modal Interaction Metaphors for Manipulation of Dis-
tant Objects in Immersive Virtual Environments. In
13th International Conference in Central Europe on
Computer Graphics, Visualization and Computer Vi-
sion, pages 45–48.
Szalav
´
ari, Z. and Gervautz, M. (1997). Using the Personal
Interaction Panel for 3D Interaction. In Proceedings of
the Conference on Latest Results in Information Tech-
nology, page 36.
URBAN CITY PLANNING IN SEMI-IMMERSIVE VIRTUAL REALITY SYSTEMS
199
