DISTRIBUTED 3D INFORMATION VISUALIZATION
Towards Integration of the dynamic 3D graphics and Web Services
Dean Vucinic, Danny Deen, Emil Oanta, Zvonimir Batarilo, Chris Lacor
Faculty of Engineering, Department of Mechanical Engineering, Fluid Mechanics and Thermodynamics Research Group,
VRIJE UNIVERSITEIT BRUSSEL, Pleinlaan 2, B- 1050 Brussels, Belgium
Keywords: X3D graphics, distributed 3D content.
Abstract: This paper focuses on visualization and manipulation of graphical content in distributed network
environments. The developed graphical middleware and 3D desktop prototypes were specialized for
situational awareness. This research was done in the LArge Scale COllaborative decision support
Technology (LASCOT) project, which explored and combined software technologies to support human-
centred decision support system for crisis management (earthquake, tsunami, flooding, airplane or oil-tanker
incidents, chemical, radio-active or other pollutants spreading, etc.). The performed state-of-the-art review
did not identify any publicly available large scale distributed application of this kind. Existing proprietary
solutions rely on the conventional technologies and 2D representations. Our challenge was to apply the
"latest" available technologies, such Java3D, X3D and SOAP, compatible with average computer graphics
hardware. The selected technologies are integrated and we demonstrate: the flow of data, which originates
from heterogeneous data sources; interoperability across different operating systems and 3D visual
representations to enhance the end-users interactions.
1 INTRODUCTION
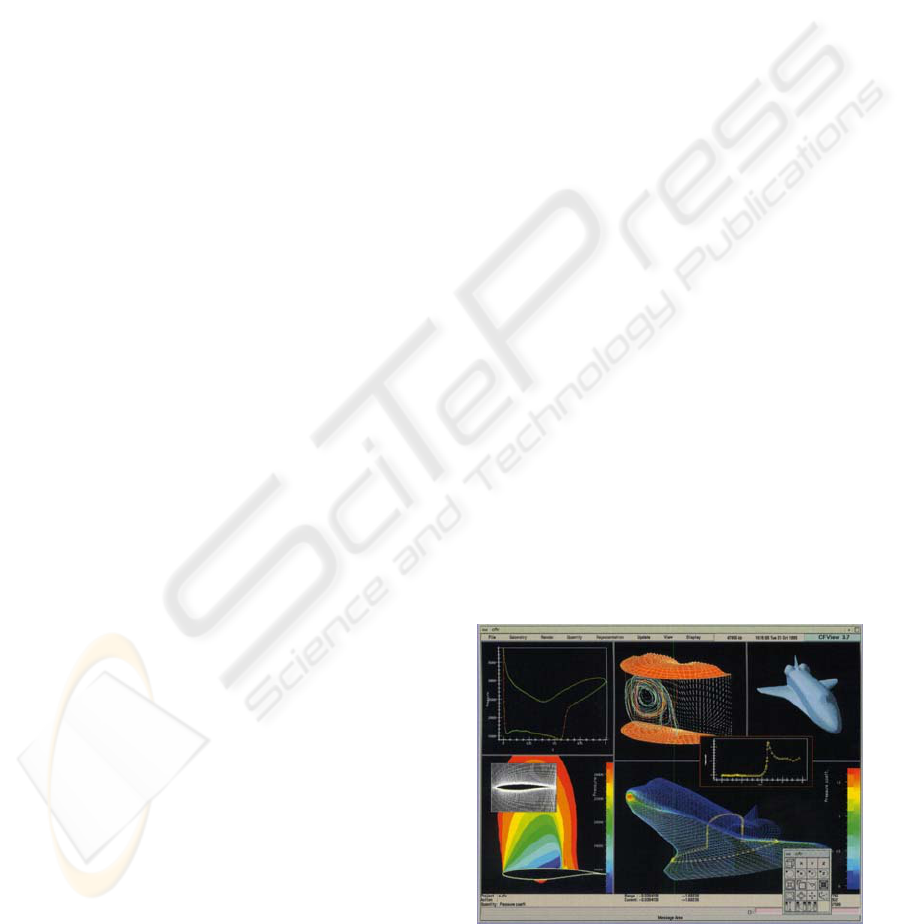
Two decades of research in developing fluid flow
simulation software has build up our expertise in
scientific visualization; see Figure 1 (Vucinic,
1992). Our continuous objective is to applied
visualization techniques to enhance the analysis of
fluid flow simulations and experiments (Vucinic,
2001). In this paper we present the visualization
framework developed within the European ITEA
program (LASCOT 2005). LASCOT has
underpinned our research in finding new ways to
apply graphics to visualize and present diversified
and dynamically changing information.
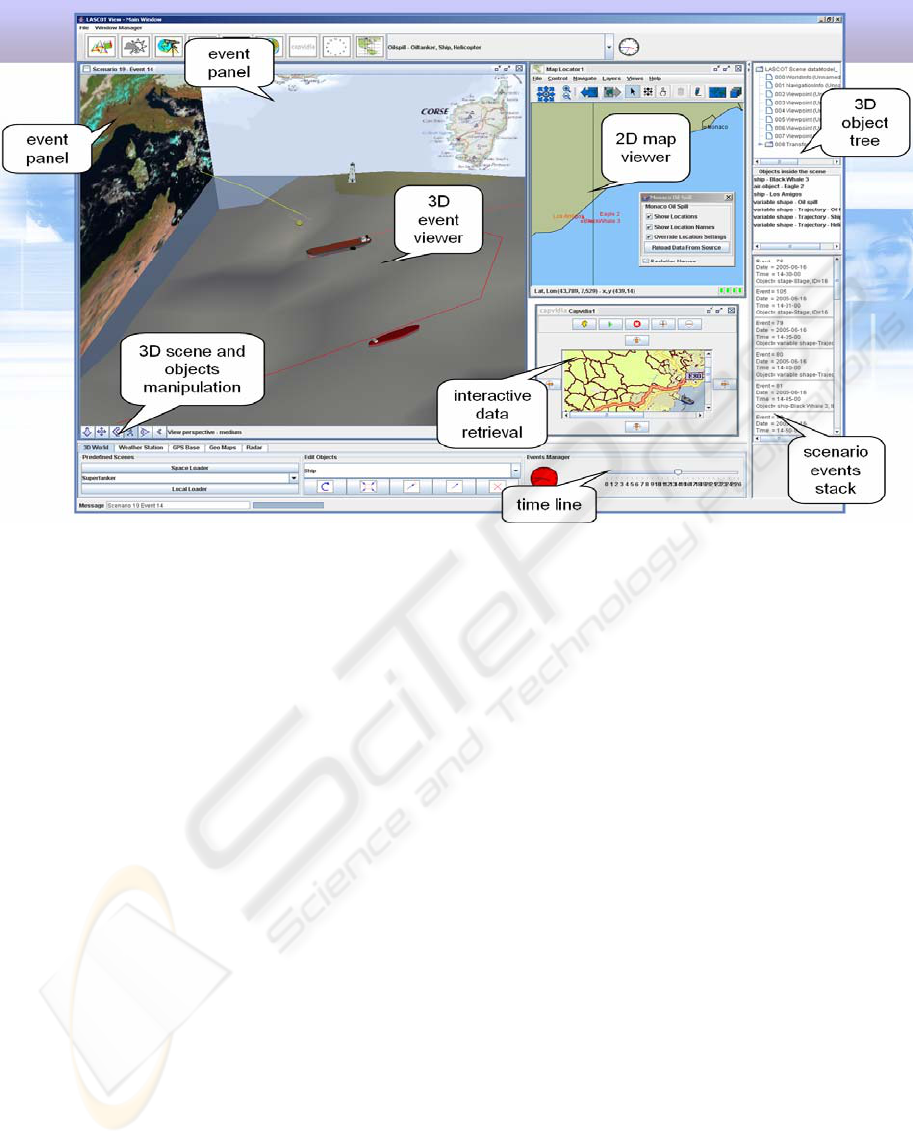
The Computer Graphics technology has reached
the point where non-technical people can
comprehend complex information looking to their
visual counterparts. Thus, we applied Model-View-
Controller (MVC) paradigm (Vuorenmaa, 2000) to
enhance interactivity of our 3D software
components for: visualization, monitoring and
exchange of dynamic information, including spatial
and time-dependent data, see Figure 2. The
undertaken software development was related to
integration and customization of different
visualization components based on the 3D Computer
Graphics (Java3D) and Web (X3D, SOAP)
technologies .
In the beginning of 90’s, we mastered the object-
oriented approach based on C++, (Vucinic 1991),
which we have further oriented towards exploring
Java3D™ solutions (Xj3D).
Figure 1: FView interactive visualization tool for fluid
flow analysis.
251
Vucinic D., Deen D., Oanta E., Batarilo Z. and Lacor C. (2006).
DISTRIBUTED 3D INFORMATION VISUALIZATION - Towards Integration of the dynamic 3D graphics and Web Services.
In Proceedings of the First International Conference on Computer Graphics Theory and Applications, pages 251-258
DOI: 10.5220/0001351402510258
Copyright
c
SciTePress
The presented visualization framework consists
of extended graphical objects containing non-
graphical (event information) used to related
networks of such objects, which are aggregated to
provide complex information in a more natural
context dependent manner. Combining position and
time parameters enables us to automate the creation
of scenes and distribute them to the end-users;
highlighting useful information, thus improving the
situational awareness of the involved actors.
Another important aspect of the visualization
framework is the user interaction possibilities to
analyze the created 3D scenes and to browse through
the history of events in an appropriate user friendly
manner.
For managing crisis events, such as hurricanes,
flooding, chemical, biological or radio-active
incidents, maritime disasters and other large scale
problems, we need the ability to generate
simulations and to exchange these models by
importing them into the 3D scene. Being able to
freely tilt and rotate the stage, to choose the desired
perspective, offers the user significantly improved
insight into the crisis situation.
It could be argued that 2D maps have always
been sufficient for locating objects on an area of
interest. Traditionally, battlefield situations have
been modelled with symbols on a large flat surface.
It is obvious that 3D models make the understanding
of the information easier (Blais, 2002). Such an
approach is often found in museums to provide
visitors with an enhanced experience. A problem
related to their usage was that the 3D models needed
for the real-time situations were costly to create, as
their production required large amount of time and
effort.
Today, the new visualization technology makes
it possible to generate 3D content quickly and at a
low cost, by simply inserting appropriate parameters
into the existing pre-build templates. Examples are:
overlaying 2D maps with satellite images (black and
white, colour, or pseudo-colour, reveal more
information than we could possibly see with the
naked eye); extrusion models of 3D objects (e.g.
buildings in a city). A further step is to filter and
structure such models and to automatically create
content dependent (virtual) “pictures” of the
situation, which humans may intuitively understand
and analyze through multiple “views”, giving a
different perspective on the same situation.
In this paper we present our software engineering
approach, applied to the development of the
visualization components through the requirements
specification, the application design and the
implementation phases. Finally, we give some
indications on the usability testing of the presented
distributed 3D information visualization framework.
Figure 2: The LASCOT application.
GRAPP 2006 - COMPUTER GRAPHICS THEORY AND APPLICATIONS
252

2 VISUALIZATION
REQUIREMENTS
During the LASCOT project, we have performed an
extensive analysis of the user needs and we have
established the following requirements.
2.1 Dictionary of 3D Objects
A dictionary classifies 3D objects: e.g. plane, ship,
submarine, etc... The behaviour of the objects is
determined by the category to which an object
belongs. For example: as ships do not fly, there is an
automatic restriction imposed on their movement in
the vertical direction. This restriction is reflected in
the user interface. When positioning a ship by
entering a numerical coordinate, the elevation
position will be absent.
2.2 Library of 3D Objects
A library of 3D objects stores X3D (or VRML)
formatted models. Each object is linked to one or
more keywords. Categories are also linked to
keywords. This allows flexible search and retrieval
of the object (for example through a web oriented
wizard): see Figure 13.
The library can only be updated or appended by
an authorized user. It is necessary to assert that all
X3D files are valid and that their profile matches the
display capacities of the client application, in order
to prevent possible corruption of the entire 3D scene
(in case an invalid object could be loaded).
2.3 Actor Visualization
The position of the actors can be checked, monitored
and displayed. It must be possible to select a
particular actor and to scale each item as well as the
entire LASCOT graphical space. An X3D object is
chosen to represent the position of each actor and
display the actor’s data.
2.4 Information Visualization
Several information visualization components are
required to enable the user to access:
- Weather data: the information is retrieved from
weather forecast servers by the LASCOT server in
XML format. The direct visibility of the weather
information in one of the 3D Desktop panels is
possible.
-GPS location: Localization of the objects, such
as: ship, airplane etc. in the 3D world is available.
-Cartography maps offer possibility to visualize
different maps: roads, cities, street map, countries,
geopolitical maps, detailed maps of terrain, etc.
-Predefined locations: the location of important
places (emergency centres, hospitals, police station,
airports etc.) enables the direct communication with
each of them to exchange information about
particular needs.
2.5 Simulation Visualization
Performing 3D visualization of the crisis event
simulation (e.g. oil spills). The 3D Graphical User
Interface (GUI) allows the user to visualize and
evaluate possible solutions related to the problem.
The LASCOT application’s desktop displays
images, such as maps, photographs, data graphs, and
animations of movies integrated in the 3D space. In
addition, such 2D elements can be viewed through
standard Java Swing components.
3 APPLICATION DESIGN
3.1 3D Desktop (Client Application)
The visualization components are represented in the
3D desktop toolbar. They are subdivided into four
elements:
1° 3D Viewer (geo-maps + actors);
2° Actor Tracking (ship, oil spill);
3° Data monitoring (e.g. temperature);
4° X3D objects modelling (editing, browsing).
3.2 Graphical Middleware
(Application Server)
The graphical middleware contains the basic
operational services for the database (MySQL
database server), supporting retrieval, inserts,
updates and removal of records.
The "Web Services" interfaces consist of SOAP
server, as well as client, components.
In addition, the graphical middleware handles 3D
scene management: generation, composition and
history of 3D scenes ("event generation"), user
session management and Web Services interaction
(e.g. transmission of the user selected Focus Area
via SOAP messaging).
DISTRIBUTED 3D INFORMATION VISUALIZATION - Towards Integration of the dynamic 3D graphics and Web
Services
253
3.3 X3D Modelling and Interaction
The X3D graphics package is responsible for the
processing of graphical objects and consists of:
A) Interactive model for X3D objects:
1°) static objects: LASCOT coordinate system,
elevation grid, sea surface, buildings, On/Off toggle
for different layers);
2°) object positioning: general / flying / floating /
underwater objects;
3°) grouping and association of the interactive
behaviour of X3D objects.
B) Exposed End-user Interactivity:
1°) interactive viewing inside the X3D browser
(zoom, pan, rotate the scene; view, fly, walk,
examine modes);
2°) add and remove objects to/from the scene,
rotate, position, scale, re-colour objects.
4 IMPLEMENTATION
4.1 Technology Platform
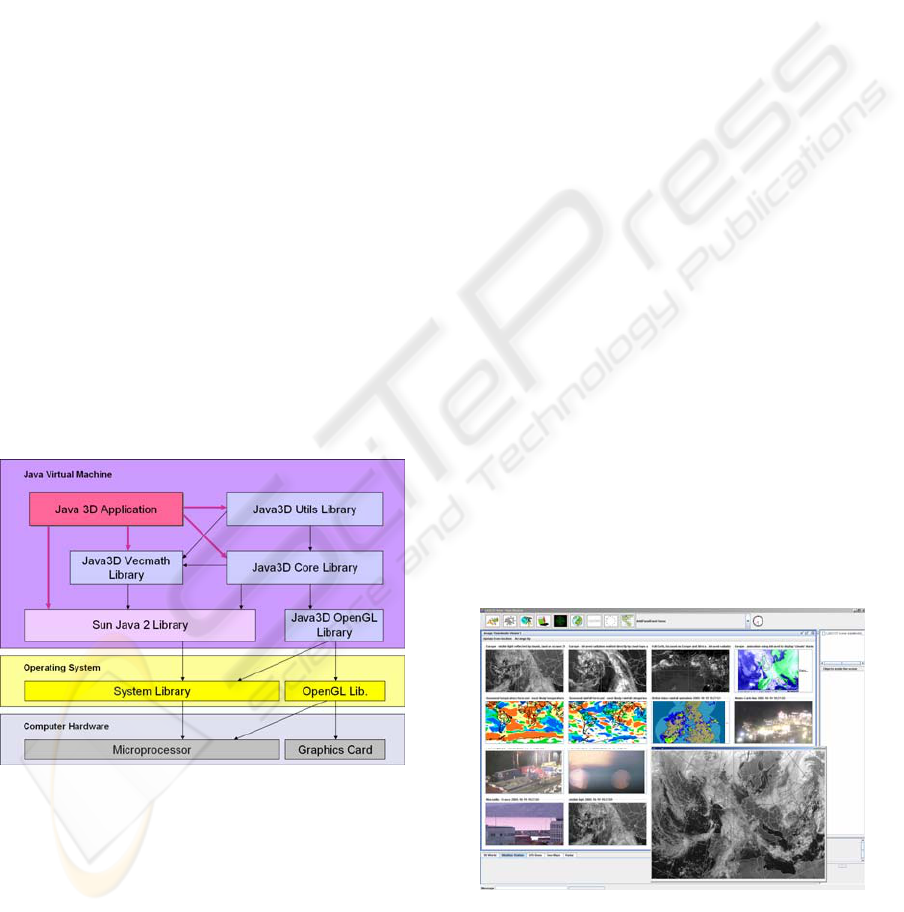
Our visualization software was designed with
portability in mind. A Java-based implementation
(see Figure 3) will run on Windows or any Linux
platform, including Mac OS X.
Figure 3: Java and Java3D platform architecture.
The X3D ISO standard was used as the basis for
the graphics content modelling. X3D remains
compatible with VRML. It uses XML-based
encoding, which enables hierarchical modelling
(Kiss, 2003) and data-structures exchange across
different platforms and between independent
distributed applications. Because it is an ISO defined
standard, X3D scenes, objects, environments will
have predictable, reliable, reproducible behaviour
towards the end-user, regardless of the system or
specific software application being used. An open
source conformant Java-based viewer application
was available (pre-release) and we used it as the
underlying toolkit on which we based our 3D
desktop development. For the 2D components, the
Java Swing toolkit was used.
The selected application server was JOnAS, an
open source implementation of the J2EE
specification by ObjectWeb. JOnAS was used for
the deployment of Java Servlets, Java Server Pages
and Web Services.
The database is implemented in MySQL, but the
developed components are compatible and portable
to any SQL server product (such as, but not limited
to, IBM DB2, Microsoft SQL Server, Oracle,
mSQL, PostgreSQL, Sybase, etc.).
4.2 Client Application
The information visualization tools, each related to a
specific data-source (existing or hypothetical),
consist of:
1°) X3D EARTH GLOBE: a VisAD-based
(Hibbard, 2000) component, showing a prototype of
the 3D elevation model of the planet Earth, by
augmented representation of elevation (false-colours
+ exaggeration of elevation).
2°) WEATHER SAT IMAGES: for retrieval of
satellite images from web sources (see Figure 4), for
example www.metoffice.gov.uk, on which coast-
lines and lines of latitude and longitude have been
added (they have been altered to polar stereographic
projection).
Figure 4: Weather imagery (web sources).
3°) IDV DATA DISPLAY: for interactive
display of various scientific data sources supported
GRAPP 2006 - COMPUTER GRAPHICS THEORY AND APPLICATIONS
254
by Unidata’s Integrated Data Viewer (IDV), an
open-source, based on VisAD (Hibbard, 2000), for
analyzing and visualizing data (see Figure 5) from
heterogeneous sources, such as satellite imagery,
surface observations, balloon soundings, NWS
WSR-88D Level II and Level III RADAR data, and
NOAA National Profiler Network data, within one
unified interface.
Figure 5: Integrated Data Viewer.
4°) VIDEO CAPTURE AND DISPLAY: for
retrieval and display of movies, as well as video
capturing (if hardware is available), we have
included Sun’s JMStudio (an example application
for the Java Media Framework 2.1).
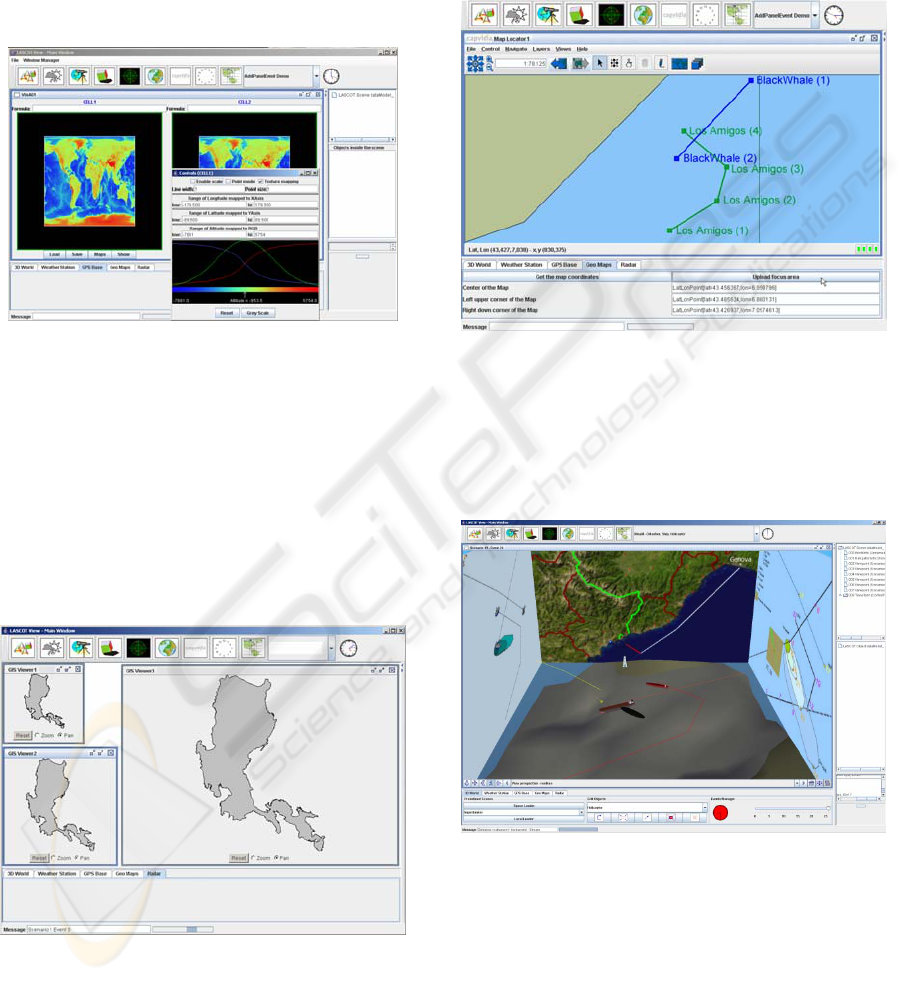
5°) GIS Viewer: for display of 2D vector
graphics (see Figure 6). Vector graphics are scalable
image displays (as opposed to bitmaps, such as
satellite photos).
Figure 6: GIS data viewer.
6°) INTEGRATED WEB BROWSER: for
systems which do not have a web browser installed,
we provided a simple HTML capable client.
7°) GLOBAL POSITIONING TOOL: Vector
graphics component (see Figure 7) based on BBN
Technologies' OpenMap™, for displaying actor
locations on a 2D map; also capable of event
generation (transmits the area of interest to the
middleware via SOAP messaging).
Figure 7: 2D actor locator.
8°) 3D DESKTOP: This Xj3D based tool is a
complex component, which can be used in scene
authoring mode, or for event viewing (see Figure 8).
Figure 8: 3D Desktop with 2 ships, helicopter and oil
spill.
The scene viewer represents a time-based
scenario with time-slider for point-wise temporal
object browsing (Daassi, 2000). Objects appearing
in the scene are positioned according to event
properties provided by the graphical middleware
server. They can also be moved by the user, either
by entering position coordinates numerically (using
DISTRIBUTED 3D INFORMATION VISUALIZATION - Towards Integration of the dynamic 3D graphics and Web
Services
255
a slider), or intuitively by moving the mouse. Other
operations available to the user include: rotation, re-
colouring, removal of an object, adding of an object
(selected from categories), re-scaling, playing of
(pre-defined) animations and the adding or removing
of instruments (visual tools) to or from the scene.
In our demonstrator we have implemented these
functionalities from buttons inside the 3D scene, as
well as from Java Swing buttons (2D components),
outside the 3D world.
4.3 Graphical Middleware
The LASCOT graphical middleware (GM) consists
of servlets and Java Server Pages available through
the JOnAS application server. It acts as the bridge
between the Common Information View (XML
objects, provided by the Business Processor in the
context of a LASCOT business process) and the 2D
and 3D XML objects – provided by the 2D and 3D
Visualization Services.
Figure 9: Graphical middleware architecture.
GM is an essential component, enabling the flow
of externally generated data to the client application
(see Figure 9). The uniqueness of the LASCOT
concept is that, contrary to computer games, where
content elements and their parameters are
determined in advance (a closed system), GM
provides the ability to visualize events, as they
happen (open system).
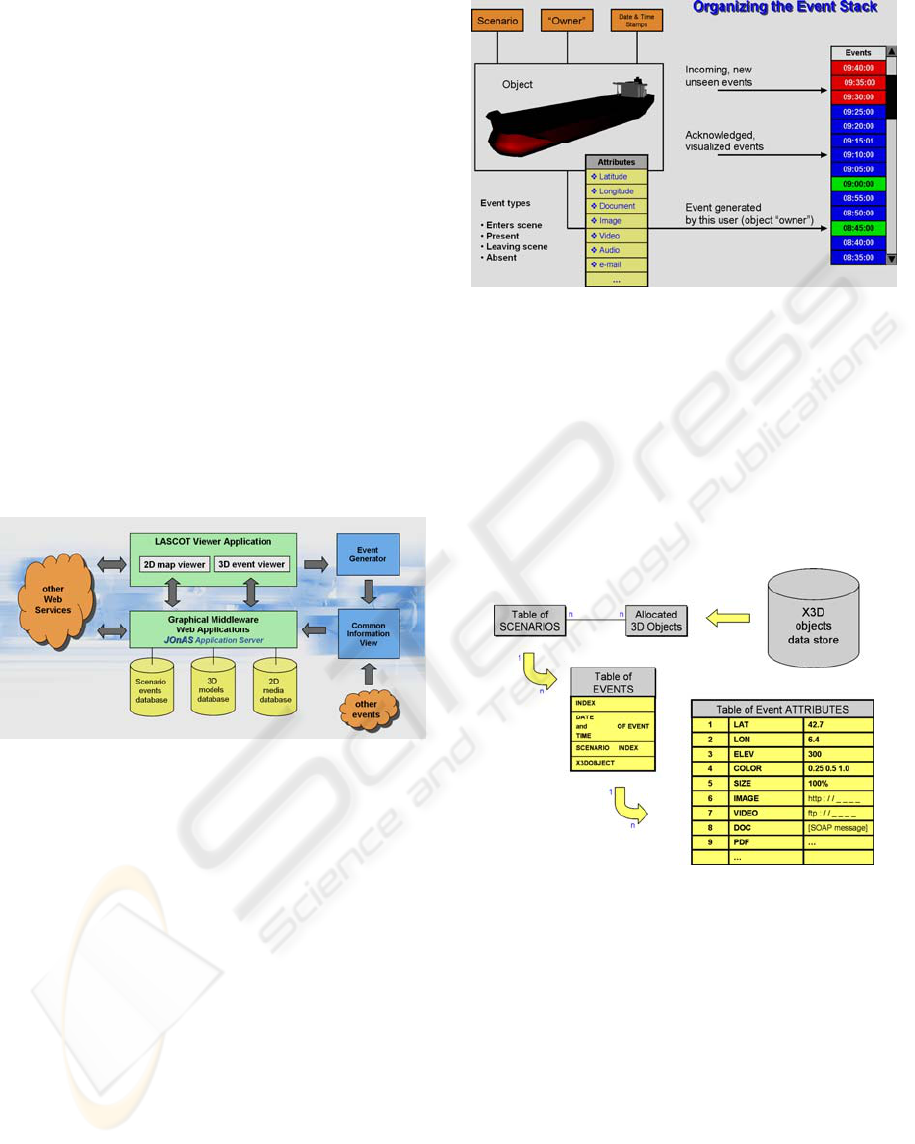
The GM uses a classical relational database
(RDB), because of proven reliability, for physical
storage. The RDB stores attributes of events as pairs
of: (identifier, value). The number of attributes per
event is theoretically unlimited. While some
parameters (see Figure 10) are stored in the “events”
table (e.g. date and time), other “attributes” are
modelled as a linked table (see Figure 11).
Figure 10: Event properties.
Each visualization component retrieves only the
values of those identifiers that it is programmed
(recognises) to deal with, while ignoring those that
are used by other components. Such a setup makes
the system very flexible, being loosely coupled, with
client components, which can be modified, added,
removed or temporarily deactivated without any
impact on the middleware code-base.
Figure 11: Events and relationships.
The identifiers are similar to the variables names
in un-typed programming languages. The stored
value can be an integer, string, URL, XML file, etc.
Only the event generator and the display component
need to understand the identifier, while the
middleware handles it transparently. The identifier is
not a simple variable name however, since it can
itself be more complex, for example, it could also
contain a set of commands (see Figure 11 and Figure
12).
GRAPP 2006 - COMPUTER GRAPHICS THEORY AND APPLICATIONS
256
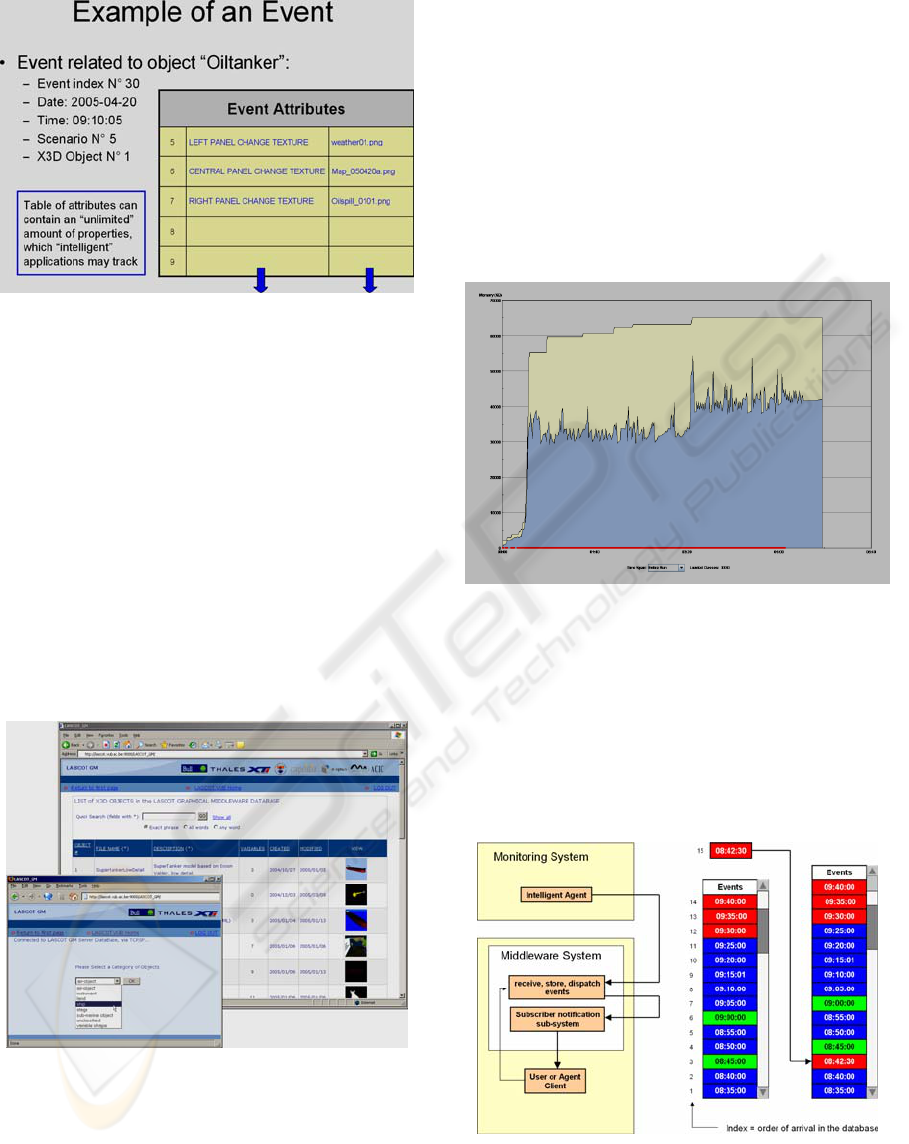
Figure 12: One-to-many relation events and attributes.
In the relational database context, each event is
seen as related to one object (see Figure 10). A
collision of 2 ships would generate at least 2 two
events. Each object has an “owner” (of it’s “stream
of events”). Any situation is represented as a series
of events, within a given scenario context. The user
can select different views on each situation.
4.4 Web components
A set of Web components (accessible through any
web browser) provide additional functionalities of
interaction (see Figure 13) with the graphical
middleware.
Figure 13: X3D object access via wizard or table.
The library of X3D/VRML objects can be
accessed either via a listing in table format (sorting
and selection functionalities are provided), or via a
wizard. Objects can be visualized using an
X3D/VRML viewer or browser plug-in.
5 TESTING
The system resource monitoring (see Figure 14)
showed that the memory allocation by the Java
Virtual Machine remains below 100 MB, when
using the most complex component (3D desktop).
Of course, when using multiple components or
several instances of the same component at the same
time, requirements will increase. However, the
application will not need more RAM than what is
available in a desktop PC (500 MB to 1 GB).
Figure 14: Memory allocation and usage.
Application speed was tested from a practical point
of view. Responsiveness was deemed to be
adequate, provided a high speed network connection
is available (broadband or LAN). The longest time
the user has to wait before the results are displayed
is 6 seconds, when retrieving the most complex
events in the 3D event viewer.
Figure 15: Event stack sorting.
The scenario of an oil spill crisis was chosen to
represent a hypothetical crisis situation. Longitude
DISTRIBUTED 3D INFORMATION VISUALIZATION - Towards Integration of the dynamic 3D graphics and Web
Services
257

and latitude coordinates for the trajectory of two
ships were generated externally as input for the
graphical middleware. Each event carries a
timestamp. Events do not necessarily arrive in
chronological order, but the middleware, as well as
the client application, are capable of sorting the
event stack (see Figure 10 and Figure 15).
6 CONCLUSION
We have demonstrated a level of integration of
cutting edge 3D graphics technologies, which has
not been reached before.
While the only Java-based X3D browser is still
in the last development phase (version 1.0 to be
expected soon), we not only managed to integrate it
into the client application part of the LASCOT
project, but we use Xj3D to visualize data which is
coming, through our middleware from various
external sources.
While presented software components provide
highly flexible interactions and data-flows, the
coupling between these components is very loose.
Thus, the components can be upgraded (or even
replaced) independently from each other, without
loss of functionality. With SOAP messaging the
communication between components is made
completely independent of software platforms and
communication transmission layers. In our approach
Java components co-exist with Microsoft .NET
front-end, as well as back-end implementations.
With our approach we aim to improve software
development of 3D collaborative and visualization
tools. Future development of an appropriate
ontology could significantly improve the distributed
visualization framework.
ACKNOWLEDGMENTS
We would like to thank the European ITEA program
for enabling the LASCOT project and the Belgium
national authorities (IWT) for financing it, as
without their direct support this work could not be
accomplished. In addition, we thank the LASCOT
Consortium: Bull, THALES, XT-i, Capvidia,
MULTITEL, IT-OPTICS and ACIC, because
without them this project would not have existed.
We would also like to thank Tomasz Luniewski
for putting forward the 3D dashboard concept and
Jef Vanbockryck for the WebService expertise.
REFERENCES
Blais C. Brutzman D., Harney J., Weekley J., 2002. Web-
Based 3D Reconstruction of Scenarios for Limited
Objective Experiments. In Proceedings of the 2002
Summer Computer Simulation Conference, Society for
Modeling and Simulation (SCS).
Daassi C., Dumas M., Fauvet M., Nigay L., Scholl P.,
2000. Visual exploration of temporal object databases.
In Proceedings of 16ièmes Journées Bases de Données
Avancées. BDA, French Conference on Databases.
Hibbard W., 2000. An example of Unidata's future in new
software: the VisAD component architecture for
collaborative data analysis and visualization.
Preprints, Conf. Interactive Information and
Processing Systems for Meteorology, Oceanography,
and Hydrology.
Kiss S., Nijholt A., Zwiers J., 2003. Virtual Modelling. In:
Proceedings Eurographics 2003: Modeling the real
world. The Eurographics Association, Granada, Spain.
Vucinic D., 1991. Object Oriented Programming for
Computer Graphics and Flow Visualization, invited
lecture, VKI Lecture Series on Computer Graphics
and Flow Visualization in CFD, Brussels, Belgium.
Vucinic D., Pottiez M., Sotiaux V., Hirsch Ch., 1992.
CFView - An Advanced Interactive Visualization
System based on Object-Oriented Approach. AIAA-
92-0072, in AIAA 30th Aerospace Sciences Meeting,
Reno, Nevada, USA.
Vucinic D., Hazarika B. K., 2001. Integrated Approach to
Computational and Experimental Flow Visualization
of a Double Annular Confined Jet, Journal of
Visualization, Vol.4, No. 3, 2001.
Vuorenmaa M., 2000. Automatic Presentation of Model
Data in MVC++ Applications. Master's thesis.
Department of Computer and Information Sciences ,
University of Tampere, Finland.
GRAPP 2006 - COMPUTER GRAPHICS THEORY AND APPLICATIONS
258
