
VIEWPOINT QUALITY AND GLOBAL SCENE EXPLORATION
STRATEGIES
Dmitry Sokolov, Dimitri Plemenos and Karim Tamine
XLIM Laboratory UMR CNRS 6172, University of Limoges
83 rue d’Isle, 87000 Limoges, France
Keywords:
Scene understanding, automatic virtual camera, good point of view.
Abstract:
Virtual worlds exploration techniques are used in a wide variety of domains — from graph drawing to robot
motion. This paper is dedicated to virtual world exploration techniques which have to help a human being
to understand a 3D scene. An improved method of a viewpoint quality estimation is presented in the paper,
together with a new method for an automatic 3D scene exploration, based on a virtual camera. The automatic
exploration method is related to off-line exploration and is made in two steps. In the first step, a set of “good”
viewpoints is computed. The second step uses this set of points of view to compute a camera path around the
scene.
1 INTRODUCTION
One of the reasons for rapid development of com-
puter science was introduction of human-friendly in-
terfaces, which have made computers easy to use and
learn. The increasing exposure of the general pub-
lic to technology means that their expectations of dis-
play techniques have changed. The increasing spread
of the internet has changed expectations of how and
when people are to access information. As a con-
sequence, a lot of problems raised. One of them
is automatic exploration of a virtual world. Dur-
ing last years, people pay essentially more attention
to this problem. They realized the necessity of fast
and accurate techniques for better exploration and
clear understanding of various virtual worlds. A lot
of projects use results of intelligent camera place-
ment researches, from the “virtual cinematographer”
(He et al., 1996) to motion strategies (Marchand and
Courty, 2000).
Quality of a view direction is a rather intuitive term
and, due to its inaccuracy, it is not easy to precise for
a selected scene, which viewpoints are “good” and
which are not. Over the last decades, many meth-
ods were proposed to evaluate qualities of view di-
rections for a given scene and to choose the best one.
All of them are based on the fact that the best view-
point gives to the user maximum amount of informa-
tion about a scene. And again, an imprecise term “in-
formation” is met.
The proposed viewpoint evaluation methods could
be divided into two groups, characterized by the na-
ture of input information:
1. Low-level methods, which consider only quantity
of visible surfaces;
2. Middle-level methods, which take into account
geometry of visible surfaces.
In this paper, a new group of high-level methods, op-
erating with the visibility of scene objects is intro-
duced.
The rest of the paper is organized as follows: sec-
tion 2 gives a brief description of previous works. A
new method of viewpoint quality estimation is de-
scribed in section 3. A comparison of methods is
given in section 4. A new method of global scene
exploration is presented in section 5. Examples of the
new technique application are given in section 6. Fi-
nally, section 7 concludes our work and points out di-
rections of future work.
2 PREVIOUS WORK
2.1 Low-level Methods of Viewpoint
Quality Evaluation
This group of strategies is the most numerous one.
Among these methods, one can point at the Kamada
and Kawai (Kamada and Kawai, 1988) approach.
They have proposed to minimize the angle between
184
Sokolov D., Plemenos D. and Tamine K. (2006).
VIEWPOINT QUALITY AND GLOBAL SCENE EXPLORATION STRATEGIES.
In Proceedings of the First International Conference on Computer Graphics Theory and Applications, pages 184-191
DOI: 10.5220/0001350101840191
Copyright
c
SciTePress
a direction of view and the normal of the considered
plane for a single face, or to minimize the maximum
angle deviation for all the faces of a complex scene.
In (Plemenos and Benayada, 1996) Plemenos and
Benayada have proposed a heuristic that extends the
definition given by Kamada and Kawai. The heuris-
tic considers a viewpoint to be good if it minimizes
the maximum angle deviation between a direction of
view and normals to the faces and gives a high amount
of details. The viewpoint quality according to (Ple-
menos and Benayada, 1996) can be computed by the
following formula:
C(p)=
n
i=1
[
P
i
(p)
P
i
(p)+1
]
n
+
n
i=1
P
i
(p)
r
, (1)
where:
1. C(p) is the viewpoint quality for the given view-
point p,
2. P
i
(p) is the number of pixels corresponding to the
polygon number i in the image obtained from the
viewpoint p,
3. r is the total number of pixels of the image (resolu-
tion of the image),
4. n is the total number of polygons in the scene.
5. [a] means the ceiling function, i.e the smallest inte-
ger number a
c
∈ N : a
c
≥ a.
In (Vazquez et al., 2001) Vazquez et al. have pro-
vided an information theory-based method, that can
be classified as low-level method. To select a good
viewpoint they propose to maximize the following
function they have called a “viewpoint entropy”:
I(p)=
N
f
i=0
A
i
A
t
· log
2
A
t
A
i
, (2)
where:
1. p is the viewpoint,
2. N
f
is the number of faces of the scene,
3. A
i
is the projected area of the face number i,
4. A
0
is the projected area of background in open
scenes,
5. A
t
is the total area of the projection.
2.2 Middle-level methods
Directly or implicitly, all the methods from the low-
level group use only two global parameters as input:
1. Quantity of visible surfaces (projected area,
amount of voxels, angle between direction of sight
and normal to a face),
2. Number of visible faces.
In other words, all of them consider a viewpoint qual-
ity as a sum of qualities of separate faces, but don’t
take into account how a polygon is connected to the
adjacent ones.
The number of visible faces is a quite weak cri-
terion for viewpoint quality estimation. For exam-
ple, if we consider a very simple scene that consists
of one square (figure 1(a)), then equation 2 gives us
I(p)=0for a viewpoint p lying on the perpendicular
to the square’s center. If we subdivide the square (fig-
ure 1(b)), topology of the scene does not change, but
I(p) grows.
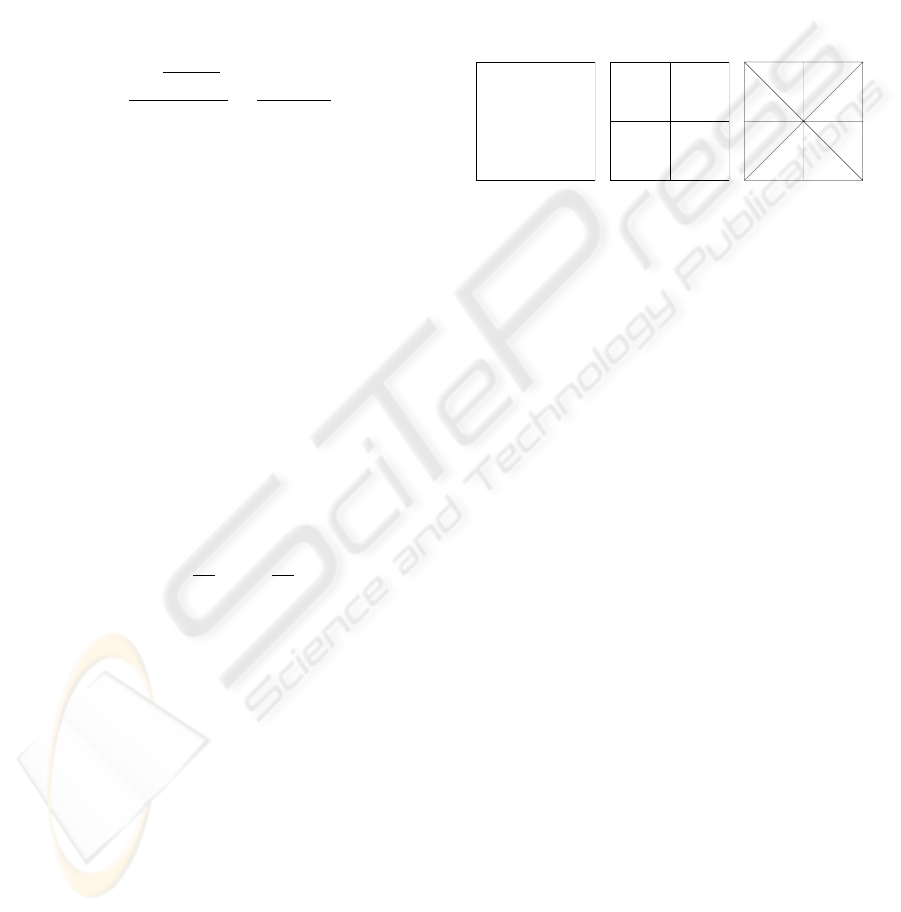
(a) (b) (c)
Figure 1: Three scenes represent the same square (a),but
subdivided into 4 parts (b) and 8 parts (c). Equation 2 gives
us I(p)=0for (a), I(p)=log4for (b) and I(p)=log8
for (c).
Thus, the methods using a number of faces to eval-
uate a viewpoint quality, depend on initial scene sub-
division. Using the projected area of a face as a cri-
terion of quality, the dependence appears also if we
don’t use an additive metric, i.e., the sum of areas.
Recently Sokolov and Plemenos (Sokolov and Ple-
menos, 2005) have proposed to consider the total cur-
vature of visible surfaces as an amount of information
appropriate to a viewpoint:
I(p)=
v∈V (p)
2π −
φ
i
∈φ(v)
φ
i
·
f∈F (p)
P (f ), (3)
where:
1. F (p) is the set of faces visible from p,
2. P (f) is the projected area of the face f ,
3. V (p) is the set of visible vertices of the scene,
4. φ(v) is the set of angles adjacent to the vertex v.
The proposed heuristic is invariant to any subdivi-
sion of a scene keeping the same topology. Indeed, if
we subdivide a flat face to several ones, then all the
edges and vertices inside the face are to be discarded
due to zero angles.
An important property of this viewpoint quality de-
finition is the possibility to extend it, using the total
integral curvature
Ω
|K|dA, into the class of contin-
uous surfaces, such as NURBS etc., more and more
usable nowadays.
VIEWPOINT QUALITY AND GLOBAL SCENE EXPLORATION STRATEGIES
185
3 A NEW HIGH-LEVEL METHOD
Now let us suppose that, having a complex scene,
there exists some proper (in human perception) divi-
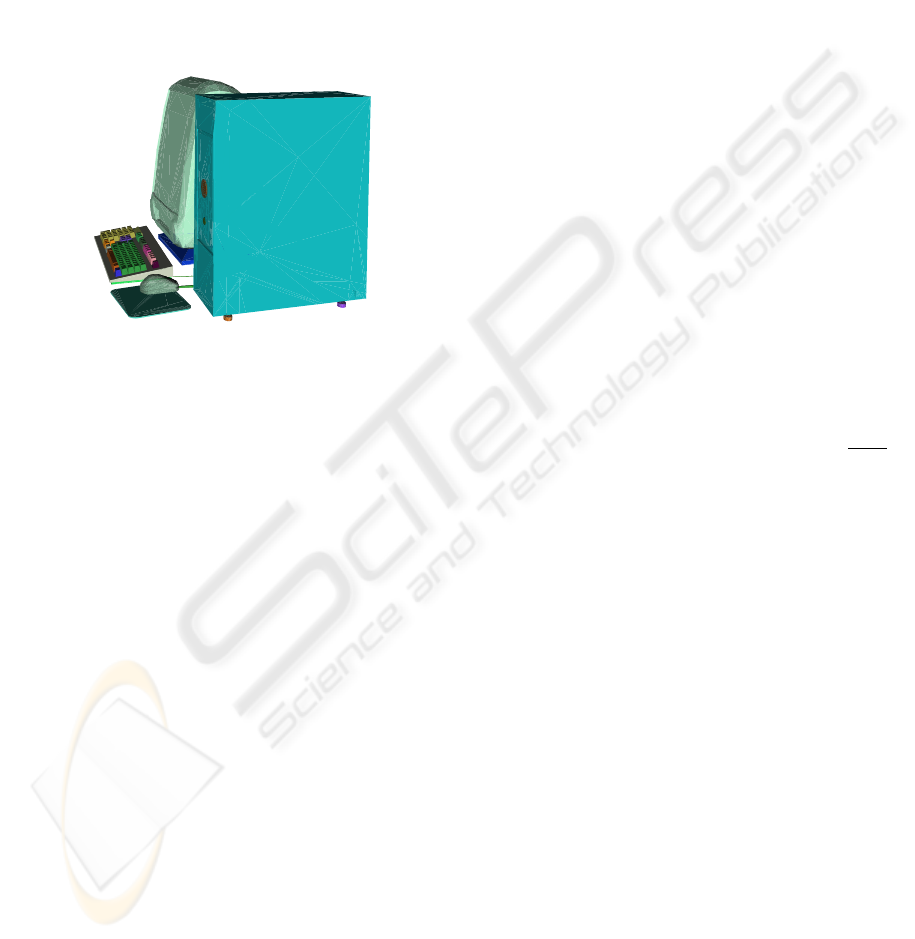
sion of a scene into a set of objects. Figure 2 shows
us an example of such a scene. These objects are: the
computer case, the display, the mouse, the mouse pad,
two cables, the keyboard and several groups of keys.
Figure 2: The scene is subdivided into a set of objects. The
display is almost completely hidden by the case, but we
could clearly recognize it.
Only 20% of the display surface is visible, but it
does not embarrass its recognition. Thus, we could
conclude that if there exists a proper subdivision of a
scene into a set of objects, the visibility of the objects
could bring more information than just the visibility
of the faces, and this leads us to the third group of
methods — the high-level class.
The requirement of a scene division into objects
does not limit the area of the method application.
There are many ways to get it. First of all, complex
scenes often consist of non-adjacent simple primi-
tives, and this leads to the first disjunction of a scene.
Otherwise, if a scene (or some parts of a scene) is
represented by a huge mesh, it could be decomposed.
The domain of the surface decomposition is well-
studied and there are a lot of methods giving excel-
lent results. One can point at results of Zuckerberger
et al. (Zuckerberger et al., 2002) and Chazelle et al.
(Chazelle et al., 1995).
The method could be used also in declarative mod-
elling. In this case, the decomposition could be pro-
vided by a modeler directly, or it can be combined
with the information extracted from a scene geome-
try.
An accurate definition of the new heuristic is given
further. Let us suppose that for each object ω of a
scene Ω importance q(ω):Ω→ R
+
is specified.
We would like to generalize the method and do not
want to be limited by a strict definition of the impor-
tance function, because it could be done in different
ways, especially, if some additional knowledge about
a scene is supplied. For example, if the method is in-
corporated into some dedicated declarative modeler,
the importance of an object could be assigned in de-
pendence on its functionality. Moreover, after the first
exploration the importances could be rearranged in a
different manner to see various parts of a scene more
precisely than during the previous exploration.
If no additional information is provided and the
user takes into account scene geometry only, then the
size of object bounding box could be considered as
the importance function:
q(ω) = max
u,v∈V
ω
|u
x
− v
x
| + max
u,v∈V
ω
|u
y
− v
y
| +
+ max
u,v∈V
ω
|u
z
− v
z
|,
where V
ω
is the set of vertices of the object ω.
It is also necessary to introduce a parameter charac-
terizing the predictability of an object: ρ
ω
:Ω→ R
+
.
In other words, the parameter determines the quantity
of object surface to be observed in order to well un-
derstand what the object looks like. If an object is
well-predictable, then the user can recognize it even
if he sees its small part. The bad predictability forces
the user to observe attentively all the surface.
We propose to consider the function f (t)=
ρ
ω
+1
ρ
ω
+t
t
as the measure of observation quality for an object,
where 0 ≤ t ≤ 1 is the explored fraction of the object
(for example, the area of the observed surface divided
by the total area of the object surface). Refer to fig-
ure 3 for an illustration. If the percentage t for the
object ω is equal to zero (the user has not seen the
object at all), then f(t) is zero (the user cannot recog-
nize the object). If all the surface of the object ω is
observed, then f(t) is 1, the observation is complete.
If nothing is known about a scene except its geo-
metrical representation, then in order to observe it,
the parameter ρ could be taken as rather small value,
for example, ρ
ω
≡ 0.1∀ω ∈ Ω. In such a case even
exploration of a part of an object gives a good com-
prehension.
Now let us suppose that there exists some addi-
tional knowledge, for example, a virtual museum is
considered. Then for all the paintings the parameter
could be taken equal to 1000 and, for all the walls,
chairs, doors equal to 0.1. Now, in order to get a good
comprehension of a painting, one should observe all
its surface, but only a small part of door or wall is
necessary to recognize them.
Let us consider a viewpoint p. For scene objects it
gives a set of values Θ(p)={0 ≤ θ
p,ω
≤ 1,ω ∈ Ω},
where θ
p,ω
is the fraction of visible area for the object
ω from the viewpoint p. θ
p,ω
=0if the object is not
GRAPP 2006 - COMPUTER GRAPHICS THEORY AND APPLICATIONS
186
t
comprehension
quality
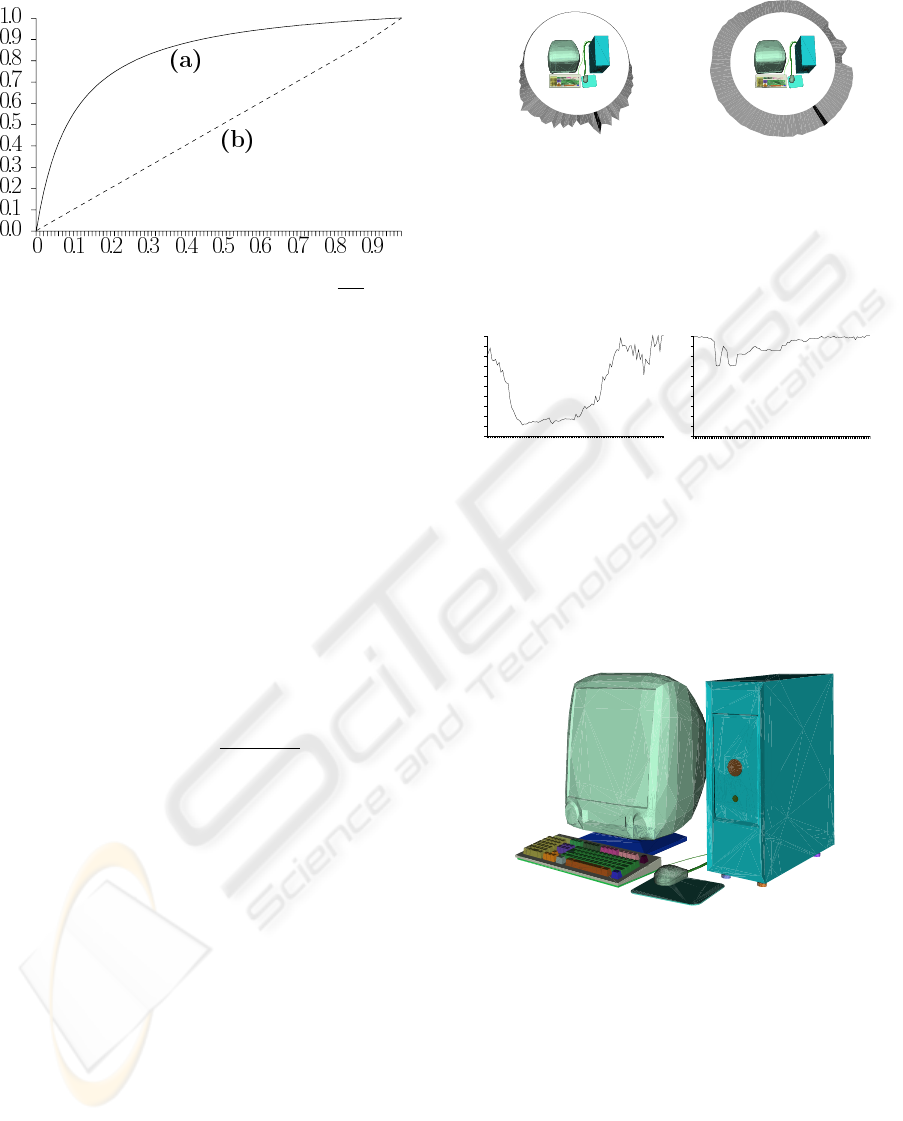
Figure 3: The behavior of the function f (t)=
ρ+1
ρ+t
· t for
two values of the parameter ρ. (a) ρ =0.1, even a part of
an object provides a good knowledge. (b) ρ = 1000, the
user should see all the object to get a good knowledge.
visible and θ
p,ω
=1if one can see all its surface from
the viewpoint p.
The fraction θ
p,ω
=0may be computed in various
ways. The simplest one is to divide the area of the
visible surface by the total area of an object. A bit
more complicated way is inherited from the middle-
level method (see equation 3). If we divide the curva-
ture of the visible surface by the total curvature of an
object, we obtain the fraction equal to 0 if an object is
not visible at all and equal to 1 if we could see all its
surface.
Thus, we propose to evaluate a viewpoint quality
as a sum of scene object importances with respect to
their visibility:
Q(p)=
ω∈Ω
q(ω) ·
ρ
ω
+1
ρ
ω
+ θ
p,ω
θ
p,ω
. (4)
4 AN EXAMPLE OF APPLYING
THE NEW TECHNIQUE
In this section, the computer model, that we have met
before, is considered more precisely. Figures 4 and
5 show the results of applying two techniques from
the middle and the high level classes. For the new
method no additional information is provided, so, the
bounding box sizes are taken as the importance func-
tion q(ω) and ρ
ω
≡ 0.1∀ω ∈ Ω.
The best viewpoints, chosen with the two methods,
are quite close (the picture is shown at figure 6), but
there are significant differences in the estimation of
other view directions.
Compare figure 2, showing the scene from the
viewpoint number 10, and figure 6, showing it from
the best viewpoint. It is clear that the viewpoint 10 is
less attractive, but it still gives a good representation
30
35
25
40
20
45
15
50
10
55
5
60
0
65
95
70
90
75
85
80
(a) The second-class
method.
30
35
25
40
20
45
15
50
10
55
5
60
0
65
95
70
90
75
85
80
(b) The new high-level
method.
Figure 4: The qualities for 100 viewpoints equally distanced
from the center of the model. The best viewpoint is shown
by the black sector.
0 10 20 30 40 50 60 70 80 90
0
0
.1
0
.2
0
.3
0
.4
0
.5
0
.6
0
.7
0
.8
0
.9
1
(a) The second-class
method.
0 10 20 30 40 50 60 70 80 90
0
0
.1
0
.2
0
.3
0
.4
0
.5
0
.6
0
.7
0
.8
0
.9
1
(b) The new high-level
method.
Figure 5: The plain graphs of the qualities for 100 view-
points around the scene (see figure 4).
Figure 6: The best viewpoint for the computer model.
of the scene. The function on figure 5(b) decreases
smoothly in this region, while figure 5(a) shows a
drastic fall. At the viewpoint 17 the function from
figure 5(b) grows, because a back side of the display
and a part of the keyboard are visible simultaneously.
Then it decreases again because the case covers the
keyboard. The new method also shows a better qual-
ity than the old one from the back side of the scene.
From each viewpoint some parts of the mouse or of
VIEWPOINT QUALITY AND GLOBAL SCENE EXPLORATION STRATEGIES
187

the keyboard are visible, so the estimation should not
be so small as at figure 4(a).
5 EXPLORING A SCENE
The viewpoint quality estimation is only the first step
in the domain of the scene understanding. In order
to help a user to get a good knowledge of a scene,
methods, allowing to choose a best viewpoint (or a
set of viewpoints), should be proposed. Dynamic ex-
ploration methods could be very helpful too, since a
set of static images is often not sufficient for under-
standing of complex scenes.
There are two classes of methods for virtual world
exploration. The first one is the global exploration
class, where the camera remains outside the explored
world (see figure 10). The second class is the local
exploration. In this class the camera moves inside
a scene and becomes a part of the scene. Local ex-
ploration may be useful and even necessary in some
cases, but only global exploration could give the user
a general knowledge on a scene. In this section we
are mainly concerned with global exploration of fixed
unchanging virtual worlds. But it should be said that
interesting results have been obtained with local ex-
ploration techniques in some works.
There are few works dedicated to the problem of
virtual world exploration. Based on the definition of
good viewpoint (Plemenos and Benayada, 1996), Bar-
ral et al. in (Barral et al., 2000b) present an incre-
mental method for automatic exploration of objects
or scenes. The technique does a global exploration of
a scene, i.e. it creates a “movie” with a camera, whose
trajectory lies on a sphere, surrounding the scene.
Marchand and Courty in (Marchand and Courty,
2000) have presented the general framework that al-
lows an automatic control of a camera in dynamic en-
vironment. The method is based on image-based con-
trol approach.
V
´
azquez et al. in (Vazquez et al., 2001) present
a measure, the viewpoint entropy, based on Shan-
non’s entropy. Then they propose the extension of the
method given by Barral et al. in (Barral et al., 2000a).
In this section a non-incremental method of global
scene exploration is presented. Since we would like
to explore the exterior of a scene, it is reasonable to
restrict the space of feasible viewpoints to a surround-
ing sphere. Moreover, a viewpoint quality is quite
smooth function, so the sphere could be easily dis-
cretized. Thus, the scene is placed in the center of the
sphere, whose discrete surface represents all possible
points of view.
Having the viewpoint quality criterion and a
rapid algorithm for visibility computations (refer to
(Sokolov and Plemenos, 2005)), we are ready to
choose good views. The main idea of the method is
to find a set of viewpoints, giving a good represen-
tation of a scene, and then to connect the viewpoints
by curves in order to get a simple path on the sur-
face of the sphere — trajectory of the camera. The
views should be as good as possible and the number
of views should not be too great. These criteria are
satisfied with a greedy search scheme. Let us give a
more strict formulation.
Let us suppose that two sets are given for a scene:
a set of faces F = {f
i
, 1 ≤ i ≤ n
f
} and a set of
vertices V = {v
j
, 1 ≤ j ≤ n
v
}. The scene dis-
junction into a set of objects is supplied: Ω=
{ω
k
, 1 ≤ k ≤ n
ω
}, V =
n
ω
k=1
ω
i
, k = l ⇒ ω
l
ω
k
=
∅. For each viewpoint s of the discrete sphere S the
set of visible vertices V (s) ⊆ V is given.
Let us denote the curvature in a vertex v ∈ V as
C(v) and the total curvature of a mesh V
1
⊆ V as
C(V
1
)=
v∈V
1
C(v). We suppose that all objects in Ω
have non-zero curvatures.
In addition to equation 4, let us introduce the qual-
ity of a set of viewpoints:
Q(S
1
⊆ S)=
ω∈Ω
q(ω) ·
ρ
ω
+1
ρ
ω
+ θ
S
1
,ω
θ
S
1
,ω
,
where θ
S
1
,ω
=
C(V (S
1
) ω)
C(ω)
, V (S
1
)=
s∈S
1
V (s).
Since the camera remains outside the scene and al-
ways points to the center of the sphere, there is no
need to define the view angle.
A set of viewpoints, giving a good scene represen-
tation, could be obtained by a greedy search. The
greediness means choosing the best viewpoint at each
step of the algorithm. More strictly: having given a
threshold 0 ≤ τ ≤ 1, one should find a set of view-
points M
k
⊆ S such as
Q(M
k
)
Q(S)
≥ τ . At the be-
ginning M
0
= ∅, each step i of the algorithm adds
to the set the best viewpoint s
i
: Q(M
i−1
{s
i
})=
max
s∈S
Q(M
i−1
{s}), M
i
= M
i−1
{s
i
}.
Figure 7 shows the amount of acquired information
in dependence on the number of algorithm steps. It is
easy to see that often only few viewpoints are neces-
sary to get a good knowledge of a scene.
The next question is: if the camera has to move
from one viewpoint to another, what path on the
sphere is to be chosen? A naive answer is to con-
nect the viewpoints with a geodesic line, the shortest
one. This preserves the camera from brusque changes
of trajectory during traversal from one point to an-
other and gives the shortest solution, but acute angles
still could appear in control points of trajectory. Such
connection does not guarantee that the path consists
of good viewpoints. This drawback is serious, and, in
GRAPP 2006 - COMPUTER GRAPHICS THEORY AND APPLICATIONS
188
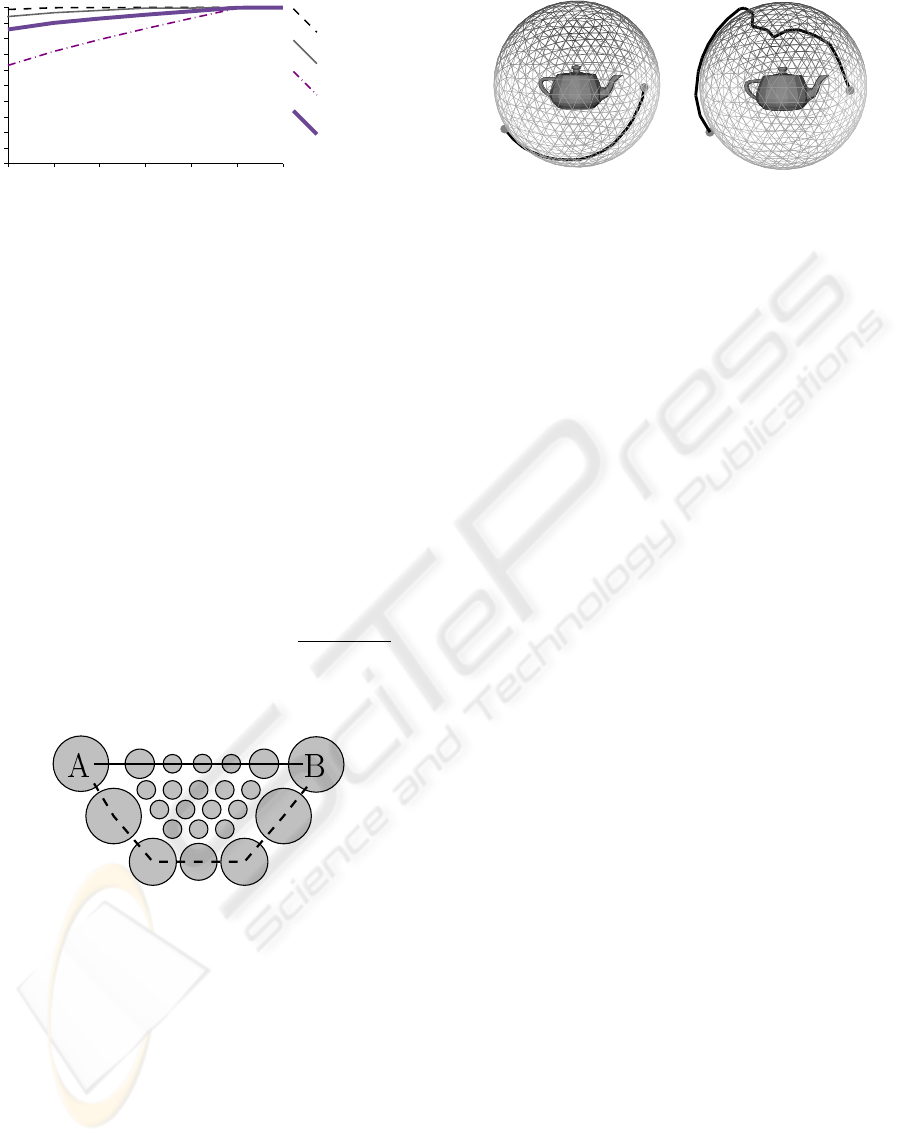
1 2 3 4 5
Computer
Sphere
Teapot
Average
6 7
0
0
.1
0
.2
0
.3
0
.4
0
.5
0
.6
0
.7
0
.8
0
.9
1
Figure 7: The amount of acquired information in depen-
dence of number of viewpoints selected by greedy search
for the Utah teapot model (figure 11), the sphere with im-
posed objects (figure 12) and the computer model (figure 6).
order to avoid it, we have to introduce additional costs
and discounts.
The main idea is to make the distances vary in-
versely to the viewpoint qualities. It means the aug-
mentation of path’s length if it contains bad view-
points and the reduction of the length otherwise. For
example, it can be done in the following way: if two
vertices s
1
and s
2
are adjacent in a sphere tessellation,
then the new distance between s
1
and s
2
is calculated
with the formula:
ˆ
d
s
1
,s
2
= || s
1
− s
2
|| · c
q
(s
1
,s
2
), (5)
where || s
1
− s
2
|| is the Euclidean distance between
points s
1
and s
2
and c
q
(s
1
,s
2
)=1−
Q(s
1
)+Q(s
2
)
2 max
s∈S
Q(s)
is
the discount that forces the camera to pass via “good”
viewpoints.
Figure 8: The reason to change the metric. The circles rep-
resent viewpoints: larger circles denote better viewpoints.
The solid line shows the geodesic line between viewpoints
A and B, the dashed line shows the shortest path according
to the new metric.
This empiric formula augments distances near
“bad” viewpoints and reduces near “good” ones. The
reason is shown at figure 8. Figure 9 gives an ex-
ample. It is easy to see that the camera trajectory pre-
sented at figure 9(b) brings to a user more information
than the shortest one.
Now, having defined the metric and having found
the set of viewpoints, we would like to determine a
trajectory of the camera. It is not hard to construct a
complete graph of distances G =(M
k
,E), where the
(a) Shortest line connecting
two viewpoints.
(b) Shortest line with re-
spect to the viewpoint qual-
ities.
Figure 9: The trajectories between two selected points on
the surface of the surrounding sphere.
weight of an arc (v
1
,v
2
) ∈ E is equal to the metric
between the viewpoints v
1
and v
2
(equation 5).
Now the trajectory could be computed as the short-
est Hamiltonian path (or circuit, if we would like to
return the camera to initial point). The problem is also
known as the travelling salesman problem (TSP). Un-
fortunately, the TSP problem is NP-complete even if
we require that the cost function satisfies the triangle
inequality. But there exist good approximation algo-
rithms to solve the problem. Moreover, often |M
k
| is
rather small (see figure 7), and the problem in such
a case could be solved even by the brute-force algo-
rithm in real-time.
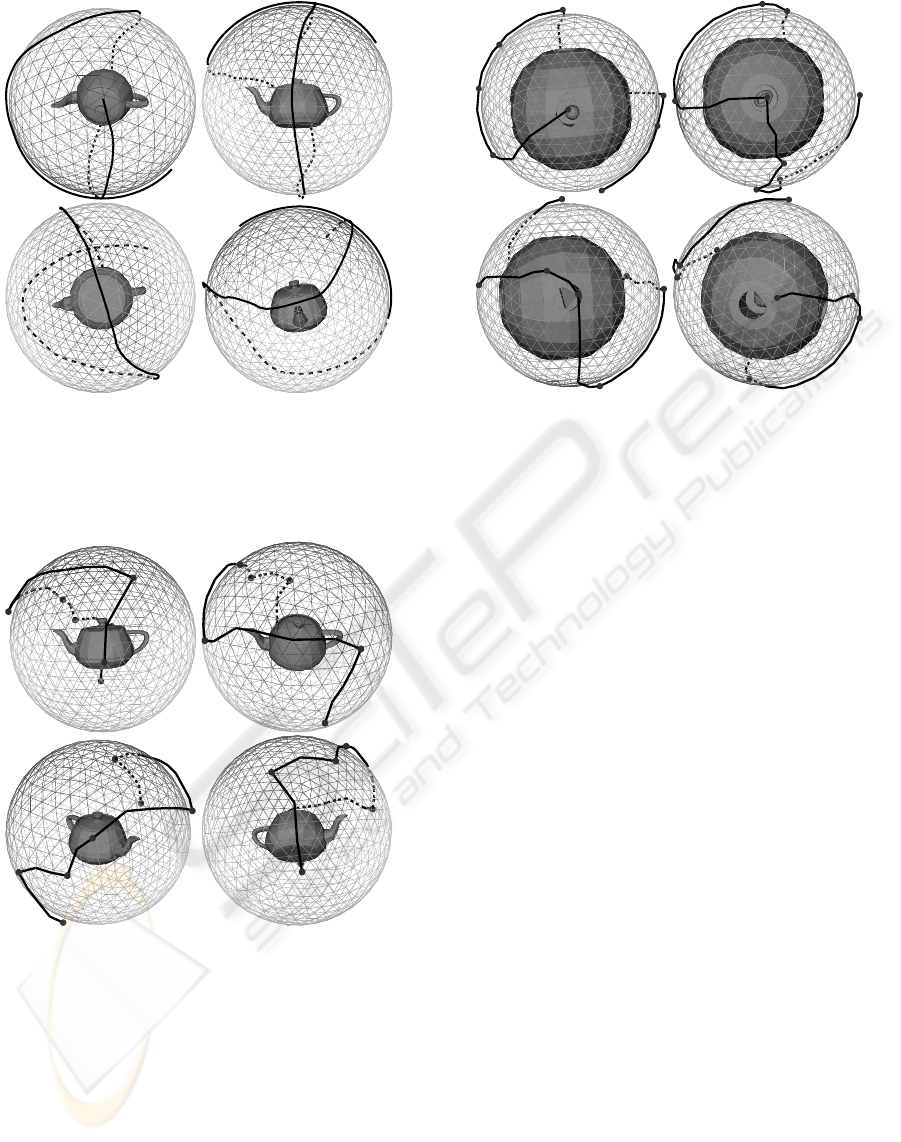
6 EXPLORATION EXAMPLES
Figures 10 and 11 show camera trajectories for the
Utah teapot model. The first one is obtained by ap-
plying the incremental technique with the viewpoint
entropy as the quality heuristic, and the second one is
obtained by our method.
Both of them show 100% of the surface of the
teapot model. The new method could give brusque
changes of the trajectory, and the old one is free of
this disadvantage. A simple way to smooth the trajec-
tory is to construct a NURBS curve. Control points
for the curve are to be taken from the approximation
of the minimal set of viewpoints, and its order is to
be defined by solving the TSP task. The new tech-
nique gives significantly shorter trajectories, and this
advantage is very important.
One more example of the new method application
is shown at figure 12. This model is very good for
exploration technique tests, it represents six objects
imposed into the sphere with holes, and the explorer
should not miss them.
VIEWPOINT QUALITY AND GLOBAL SCENE EXPLORATION STRATEGIES
189
1
2
3
4
Figure 10: The exploration trajectory for the Utah teapot
model. The trajectory is computed by the incremental
method using the viewpoint entropy as the quality heuris-
tic. Images are taken consequently from the “movie”, first
one is the best viewpoint.
1
2
3
4
Figure 11: The exploration trajectory for the Utah teapot
model, obtained with the new technique. Images are taken
consequently from the “movie”. Black knots are the control
points of the trajectory, i.e. an approximation of the mini-
mal set of viewpoints sufficient to see all the surface of the
teapot model.
7 CONCLUSIONS AND FUTURE
WORKS
In this paper a new criterion of viewpoint quality eval-
uation is presented. The criterion introduces a new
level of a scene comprehension methods, so-called
1
2
3
4
Figure 12: The exploration trajectory for the sphere with
several embedded objects. Images are taken consequently
from the “movie”, black knots are the control points of the
trajectory.
high-level methods.
A new non-incremental method of global scene ex-
ploration is also presented.
In the future we shall investigate, what kinds of ad-
ditional knowledge can be efficiently used in scene
exploration. For example, if we have a room with
paintings, it is more reasonable to pay more attention
to the objects of art than to walls and chairs.
It would be interesting to develop automatic meth-
ods of scene exploration allowing interaction with the
user, where the user can point at parts of a scene he
would like to explore in details.
ACKNOWLEDGMENTS
The authors would like to express their gratitude to-
wards the European Community and the Limousin
Region for their financial support of the present work.
REFERENCES
Barral, P., Dorme, G., and Plemenos, D. (2000a). Intelli-
gent scene exploration with a camera. In International
Conference 3IA’2000, Limoges (France).
Barral, P., Dorme, G., and Plemenos, D. (2000b). Scene
understanding techniques using a virtual camera. In
Eurographics’2000, Interlagen (Switzerland).
Chazelle, B., Dobkin, D. P., Shouraboura, N., and Tal, A.
(1995). Strategies for polyhedral surface decomposi-
tion: an experimental study. In SCG ’95: Proceedings
GRAPP 2006 - COMPUTER GRAPHICS THEORY AND APPLICATIONS
190

of the eleventh annual symposium on Computational
geometry, pages 297–305, New York, NY, USA. ACM
Press.
He, L.-W., Cohen, M. F., and Salesin, D. H. (1996). The vir-
tual cinematographer: a paradigm for automatic real-
time camera control and directing. In Proceedings
of SIGGRAPH’96, Annual Conference Series, pages
217–224.
Kamada, T. and Kawai, S. (1988). A simple method
for computing general position in displaying three-
dimensional objects. Comput. Vision Graph. Image
Process., 41(1):43–56.
Marchand, E. and Courty, N. (2000). Image-based virtual
camera motion strategies. In Fels, S. and Poulin, P.,
editors, Graphics Interface Conference, GI’00, pages
69–76, Montreal, Quebec. Morgan Kaufmann.
Plemenos, D. and Benayada, M. (1996). Intelligent display
in scene modelling. new techniques to automatically
compute good views. In GraphiCon’96, Saint Peters-
burg (Russia).
Sokolov, D. and Plemenos, D. (2005). Viewpoint quality
and scene understanding. In Mudge, M., Ryan, N.,
and Scopigno, R., editors, VAST 2005: Eurograph-
ics Symposium Proceedings., pages 67–73, ISTI-CNR
Pisa, Italy. Eurographics Association.
Vazquez, P. P., Feixas, M., Sbert, M., and Heidrich, W.
(2001). Viewpoint selection using viewpoint entropy.
In VMV ’01: Proceedings of the Vision Modeling and
Visualization Conference 2001, pages 273–280. Aka
GmbH.
Zuckerberger, E., Tal, A., and Shlafman, S. (2002). Poly-
hedral surface decomposition with applications. Com-
puters & Graphics, 26(5):733–743.
VIEWPOINT QUALITY AND GLOBAL SCENE EXPLORATION STRATEGIES
191
