
EXPLORING FEASIBILITY OF SOFTWARE DEFECTS
ORTHOGONAL CLASSIFICATION
Davide Falessi, Giovanni Cantone
Univ. of Roma "Tor Vergata”, DISP, Via del Politecnico 1,Rome, Italy
Keywords: Software engineering, Experimental softw
are engineering, Orthogonal Defect Classification, Defect class
affinity, Fault detection, Effectiveness, Efficiency.
Abstract: Defect categorization is the basis of many works that relate to software defect detection. The assumption is
that different subjects assign the same category to the same defect. Because this assumption was questioned,
our following decision was to study the phenomenon, in the aim of providing empirical evidence. Because
defects can be categorized by using different criteria, and the experience of the involved professionals in
using such a criterion could affect the results, our further decisions were: (i) to focus on the IBM Orthogonal
Defect Classification (ODC); (ii) to involve professionals after having stabilized process and materials with
students. This paper is concerned with our basic experiment. We analyze a benchmark including two
thousand and more data that we achieved through twenty-four segments of code, each segment seeded with
one defect, and by one hundred twelve sophomores, trained for six hours, and then assigned to classify those
defects in a controlled environment for three continual hours. The focus is on: Discrepancy among
categorizers, and orthogonality, affinity, effectiveness, and efficiency of categorizations. Results show: (i)
training is necessary to achieve orthogonal and effective classifications, and obtain agreement between
subjects, (ii) efficiency is five minutes per defect classification in the average, (iii) there is affinity between
some categories.
1 INTRODUCTION
Defect classification plays an important role in
software quality. In fact, software quality is strictly
related to the number and types of defects present in
software artifacts and eventually in software code.
The analysis of defect d
ata can help to better
understand the quality of software products and the
related processes, and how they evolve.
An invalid defect categorization would obviously
im
ply wrong data, which could lead analysts to
wrong conclusions, concerning the product,
development process or phase, methods, and/or
tools.
For instance, in order to define the best mix of
code
testing and inspection techniques for given
application domain and development environment, it
is crucial to collect valid defect-category data (Basili
& Selby, 1987; Cantone et al,. 2003; Abdelnabi et
al., 2004).
1.1 Related Works
The Orthogonal Defect Classification (ODC) is a
schema (IBMa, 2006) that IBM proposed in the aim
of capturing semantics of software defects (see
Section 1.3 for further details concerning ODC).
ODC was originally published on 1992; because in
the mean time the software world changed, the IBM
provided to update ODC regularly. The
classification adopted in this work is ODC v5.11, i.e.
the last version of ODC, to the best of our
knowledge. ODC is defined as a technology-
independent (software process, programming
language, operative system, etc.) classification
schema. This is based on eight different kinds of
attributes, each of them having its own categories.
Khaled El Emam and Isabella Wieczorek (1960),
and Ke
nnet Henningsson and Claes Wohlin (2004)
investigated ODC empirically by focusing on
subjectivity of defect classification. In order to
evaluate the level of cohesion among classifications
that different subjects enacted, both studies used
“Kappa statistics” (Cohen, 1960), and worked on
107
Falessi D. and Cantone G. (2006).
EXPLORING FEASIBILITY OF SOFTWARE DEFECTS ORTHOGONAL CLASSIFICATION.
In Proceedings of the First International Conference on Software and Data Technologies, pages 107-117
DOI: 10.5220/0001311201070117
Copyright
c
SciTePress

their own variations of ODC. In particular, El Emam
and Wieczorek involved various combinations of
three subjects who performed in the role of defect
categorizers on an actual software artifact, during
the development process; they hence collected and
eventually analyzed “real inspection data” (El Emam
& Wieczorek, 1960). Eight subjects, each having at
least a Master’s degree but with limited experience
in defect classification, participated to the
experiments conducted by Henningsson and Wohlin,
where objects were utilized that included thirty
defects selected from a repository. Concerning
results from those studies, the former presents high
level of cohesion with respect to standards utilized
by medical studies, the latter shows that there might
be subjectivity in classification. Durães and Madeira
(2003) used the ODC as initial defect categorization
framework and afterwards faults were classified in a
detailed manner according to the high-level
constructs where the faults reside and their effects in
the program. The analysis of field data on more than
five hundred real software faults shows a clear trend
in fault distribution across ODC classes. Moreover,
results show that a smaller subset of specific fault
types is clearly dominant regarding fault occurrence.
1.2 Study Motivations and View
We can count a significant number of empirical
works from many authors worldwide, whose
conclusions are based on categorization of software
defects. A common assumption of all those works
(see Section 8 for few samples of them: (Basili &
Selby, 1987; Cantone et al., 2003; Juristo and Vegas,
2003; Myers, 1978)) is that in large extent defects
can be classified objectively, whatever the
classification model might be. In the absence of
enough evidence for such an assumption, all those
empirical results could be questioned. Consequently,
the basic question of this study is whether software
practitioners can uniformly categorize defects.
In this paper we focus on the ODC attribute
“Defect Type” (DT), which role is to catch the
semantics of defects, that is the nature of the actual
correction that was made to remove a defect from a
software code. DT categorization hence follows
defect detection, identification and fixing: in fact,
the real nature of a defect can be understood (and
than suitably categorized) only after the code is
fixed, in the ODC approach.
DT includes seven defect categories (IBMa,
2006; IBMb, 2006):
1. Assignment/Initialization: value(s) assigned
incorrectly or not assigned at all.
2. Checking: errors caused by missing or incorrect
validation of parameters or data in conditional
statements. It might be expected that a
consequence of checking for a value would
require additional code such as a do while loop
or branch.
3. Algorithm/Method: efficiency or correctness
problems that affect the task and can be fixed by
re-implementing an algorithm or local data
structure without the need for requesting a
design change; problems in the procedure,
template, or overloaded function that describes
a service offered by an object.
4. Function/Class/Object: the defect should require
a formal design change, as it affects
significantly capability, end-user interfaces,
product interfaces, interface with hardware
architecture, or global data structure(s); defect
occurred when implementing the state and
capabilities of a real or an abstract entity.
5. Interface/O-O Messages: communication
problems between modules, components, device
drivers, objects or functions.
6. Relationship: problems related to associations
among procedures, data structures and objects.
7. Timing/Serialization: necessary serialization of
shared resource was missing, the wrong
resource was serialized, or the wrong
serialization technique was employed.
In the remaining, we present, analyze, and
discuss a benchmark including two-thousand and
more data that we achieved through an experiment
based on twenty-four segments of code, each
segment seeded with one defect, and one hundred
twelve sophomores, trained for six hours and then
assigned to classify those defects in a controlled
environment for three continual hours. In particular,
Section 2 presents the experiment problem and goal
definition. Section 3 shows the experiment planning
and operation. Section 4 and 5 present and discuss
results. Some final remarks and further intended
works conclude the paper.
2 GOAL AND EXPERIMENT
HYPOTHESES
The goal (Basili et al., 1987) of this paper is to
analyze the (ODC)’s DT attribute from the point of
view of the researcher, in the context of an academic
course on “OO thinking and programming with
Java” for sophomores, for the purpose of evaluating
dependences of software defect categorizations on:
ICSOFT 2006 - INTERNATIONAL CONFERENCE ON SOFTWARE AND DATA TECHNOLOGIES
108

i) defect (d∈DD): ii) subjectivity of practitioners
(s∈S); iii) expertise in defect detection (X), and (iv)
Programming language (PL) utilized to code
artifacts, by focusing on: a) Effectiveness (E), i.e. in
what extent a defect is associated to its most
frequent categorization (MFC); b) Efficiency (Ec),
i.e. the number of (MFC)s per time unit; c)
Orthogonality (O), i.e. in what extent a defect is
assigned to just one category; d) Affinity (A), i.e. in
what extent a defect category looks like other
categories, and e) Discrepancy (D), i.e. in what
extent subjects assign a defect different categories
(see Sections 3 for quantitative definitions of all
those variables).
Based on that goal, the hypotheses of our work
concern the impact of expertise (h
X
), defect category
(h
C
), and programming language (h
L
) on
orthogonality (h
O
), effectiveness (h
E
), and
discrepancy (h
D
).
The null (h
0
) and alternative (h
1
) hypotheses for
expertise versus orthogonality (resp. effectiveness,
and discrepancy) are:
– h
XO0
: Expertise does not significantly impact on
orthogonality (resp. h
XE0
, and h
XD0
).
– h
XO1
: Expertise impacts significantly on
orthogonality (resp. h
XE1
, and h
XD1
).
Hypotheses concerning programming language
(h
LO0
, h
LO1
, h
LE0
, h
LE1
, h
LD0
, h
LD1
), and defect
category (h
CO0
, h
CO1
, h
CE0
, h
CE1
, h
CD0
, h
CD1
) have
similar formulations. In the remaining, while we
evaluate the impact of defect category, expertise,
and programming language on outcomes, our
reasoning mainly focuses on expertise. In fact, in
our expectation, in case of significant dependence of
defect categorizations from the categorizers’
subjectivity, expertise should play the most
important role and behave as the main
discriminating factor; consequently, our planning
and training emphasis was in providing variable
expertise.
3 EXPERIMENT PLANNING AND
OPERATION
Whoever the participant subject, three items
characterize our elementary experiment: a defect, as
seeded and fixed in a program segment, the
programming language of that segment, and
dissimilarity of that defect.
In order to average on differences among
participant subjects, our planning decisions was to
utilize subjects with the same level of experience; in
particular: i) one hundred or more subjects from the
same academic class, ii) subjects showing the same
OOP class frequency record, iii) subjects who would
be attending all the training sessions. Moreover, in
order to manage the impact of learning effect on
results, we kept further planning decisions, which
also helped to prevent exchange of information
among participant subjects: iv) to arrange four
master files, where experiment artifacts are located
in different order, v) to assign subjects seats
randomly, and give neighbors copies of different
master files, and vii) to ask subjects to handle
artifacts in sequence, staring from the first artifact
their assigned.
We hence developed and saved into repository
defected artifacts. An artifact consists in a less than
twenty ELOC segment of code, plus comments to
ensure easy and valid understanding; one defect is
seeded per code segment, and fixed through specific
comments. Let us note that while we used our
understanding of DT ODC to generate defected
artifacts, we no further utilize such understanding in
the remaining of this study, where categorizations
are utilized as enacted by subjects.
In parallel with repository construction, we
called for participation, and trained subjects through
three two-hour lectures, which presented the role
and importance of defect categorization, defined
categories of the ODC DT attribute, and explained
extensively two or more exemplar cases for each
defect category. Subsequently, we evaluated in Low
(L), Average (A), and High (H) the dissimilarity
between defects in the experiment artifacts and
defects in the examples given for training (see
Expertise in Section 3.1.4 for further details).
Finally, we ruled the random selection of experiment
artifacts from the repository, as in the following: (i)
Get as many C++ as Java coded artifacts; (ii) Get
two or more artifacts for each defect category; (iii)
Get 20% of artifacts for each value of Dissimilarity,
and remaining (40%) at random.
3.1 Independent Variables:
Parameters, Blocking Variables
and Factors
3.1.1 Subjects
As already mentioned, one hundred twelve
sophomores participated to the experiment, who
were attending the course of Object-Oriented
Programming, their fourth CS course at least. All of
them had attended all the training lectures and, in
term of experience, they can be considered as novice
EXPLORING FEASIBILITY OF SOFTWARE DEFECTS ORTHOGONAL CLASSIFICATION
109

programmers. Subjects’ participation was part of a
course test; they worked individually in the same
250 seats room, in the continual presence of two or
more observers; communication among subjects was
not allowed. Other one hundred subjects, who had
not fully attended the training or the OOP course,
were located in an adjacent room: their data will be
no further considered in the present paper.
3.1.2 Objects
Experiment artifacts, twelve C++ coded and twelve
Java coded, were assigned to all subjects, each
artifact seeded by one defect. All quadruples of
neighbor subjects handled the same artifacts but in
different order.
3.1.3 Experiment Duration
Subjects had up to three hours assigned to enact their
task. They were allowed to quit the experiment any
time, after the start and before the formal end.
3.1.4 Factors and Treatments
Factors of the basic experiment and their levels are:
– Programming Language (PL), levelled at C++
and Java, respectively.
– Defect Category (Ctg). Six defect categories are
utilized, i.e. all the DT ODC less
Timing/Serialization: in fact, subjects had not yet
been exposed to concurrent programming
concepts, constructs, and mechanisms, when
they participated to the experiment.
– Expertise (X). It is analogous to Dissimilarity
but scale is reversed; it hence relates to quantity
of examples given per defect during training. In
fact, for each defect type, we set artificially the
subjects expertise by dosing the explanation
time, and the numbers of examples given per
defect. (0, 1, 2) are the values of the ordinal scale
we use to measure the subjects expertise, where:
0 means that training did not include examples
showing that specific instance of the defect
category (hence, the defect shows low level of
similarity with the explained defects, and its
Dissimilarity measure is H); 1 means that
training exposed subjects just one time to that
specific instance of the defect category
(Dissimilarity measures A); 2, means that
subjects trained with two or more instances
concerning that specific defect category (the
defect shows high similarity with the explained
ones, and its Dissimilarity measure is L).
Concerning this point, let us finally note that,
because subjects had already attended two CS
courses in C++ and were attending a Java
course, trainers gave more emphasis to defected
artifacts coded in the latter.
3.2 Dependent Variables
We directly measured:
– Completion Time: Actual task duration per
subject (duration of all the elementary
experiments assigned to the same subject).
– Categorization: ODC per elementary experiment
and subject. A subject, whether sure about his
understanding, assigns a defect just one
category, else zero or two categories.
Based on such direct measures, we derive the
variables described in the followings, which
characterize the DT attributes of the OD
Classification. Let us note that measures in the
following are given to each specific defect, and then
applied in the same way in each defect category,
each programming language, and so on..
– Effectiveness (E): percentage of the most
frequent categorization with respect to the
universe of categorizations given by subjects for
this defect.
– Efficiency (Ec): how many (MFC)s occur per
time unit, in the average, for this defect. Because
of the experiment infrastructure that we choose
(paper supports for data collection; data
registration enacted by subjects), our decision
was to collect the task Completion time only,
rather than the time duration of each elementary
experiment. Consequently, data from the basic
experiment are not enough to investigate
efficiency in deep.
– Orthogonality (O): what percentage of subjects
assigned this defect just one category (rather
than zero or two).
– Discrepancy (D): this does measure the average
distance in percentage related to the entire
population for the same categorization, and is a
variant of the Agreement’s (Henningsson and
Wohlin, 2004; El Emam & Wieczorek, 1960)
one complement. In other word, discrepancy is
the average probability that a given
categorization is different from those given by
other subjects for the same defect.
– Affinity (A): this expresses a relationship of a
category with respect to one more category, and
is a variant of the Confusion’s (Henningsson and
Wohlin, 2004) one complement. Given two
categories, the source category CS and the
ICSOFT 2006 - INTERNATIONAL CONFERENCE ON SOFTWARE AND DATA TECHNOLOGIES
110
destination category CD, let us take in
consideration defects, which MFC is CS. The
affinity of CS with respect to CD,
A_WRT(CS,CD), measures the percentage of
CS or CD categorizations given for those
defects. Formally:
– ∀d∈DD(Exp): MFC(d) = CS, ∃A_WRT∈
[0..100]: (100*p(d) ∈ {CS, CD}=A_WRT);
(1)
where: d is any of the defect set DD in the
experiment Exp, and p is the probability
function averaged on all instances of the
argument defect. A_WRT is not commutative
(sometimes A_WRT(C1,C2) ≠ A_WRT(C1,
C2)), and its reflexive closure, A_WRT(C,C), is
the Effectiveness with respect to category C.
The affinity between CS and CD, A_Btw(CS,
CD), is then defined as:
∀d ∈ DD(Exp): MFC(d) ∈ {CS, CD}, ∃ A_Btw
∈ [0..100]: (100*p(d) ∈ {CS, CD} = A_Btw);
(2)
Note that ∀(CS, CD), A_Btw(CS,CD) =
A_Btw(CD, CS), i.e. A_Btw is commutative:.
Definitions above can be extended to three or
more categories.
4 RESULTS AND DATA
ANALYSIS
At experiment conduction time, subjects registered
more than two thousand six hundred data fields,
which we eventually deposited in a database. Two
subjects provided exorbitantly distant data from the
most frequent ones; data analysis identified those
data as outliers, and consequently we excluded them
form further analysis.
In this study all categorizations given by
subjects, are evaluated, null ones included: in our
evaluation, null categorizations candidate IBM DT
definitions for further clarification, or our training
for improvement.
4.1 Descriptive Statistics
Let us consider now orderly relationships between
each response variable and factors.
4.1.1 Effectiveness
We want to describe the evolution of the most
frequent categorizations as a whole and versus
expertise, programming languages, and defect
categories involved, and eventually with respect to
the task completion time.
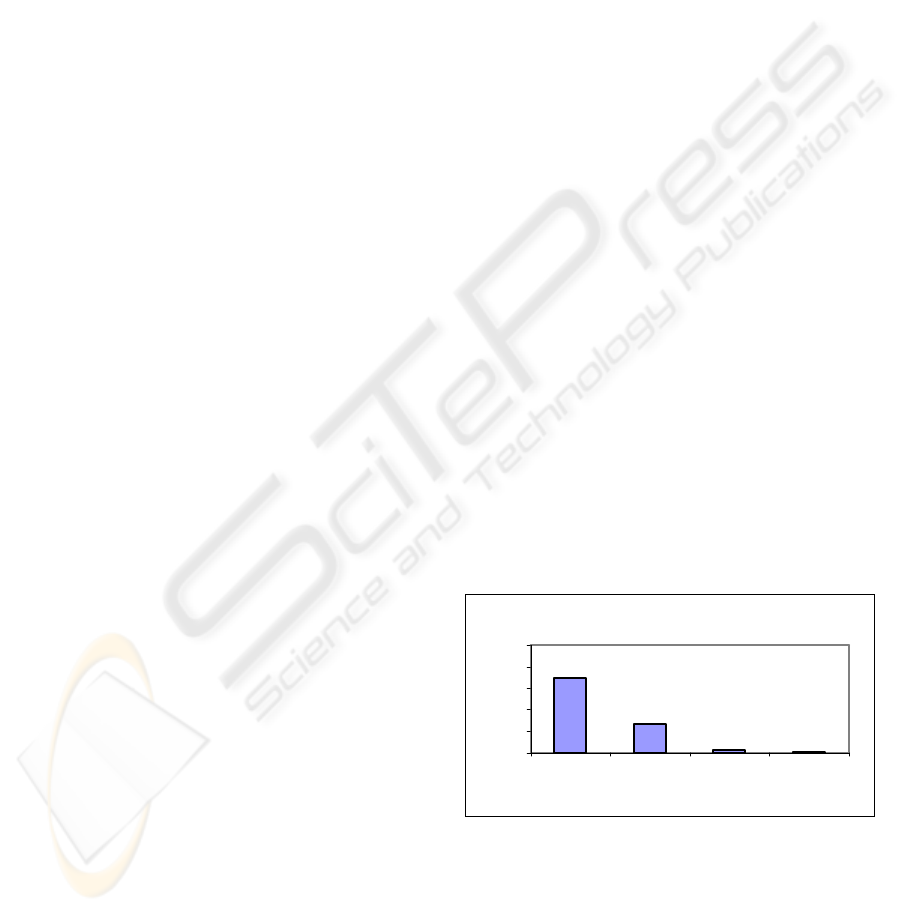
Figure 1 shows subjects given categorizations, as
averaged on the whole available data. Concerning
the abscissa, “0” stands for not categorized defects
(null); “1_MFC” (resp. “1_NMFC”) denotes that the
subject assigned this defect just the most frequent
categorization (resp. one category, but different from
the MFC); “Others” stands for assignment of two
categories to this defect. Effectiveness (see MFC in
Figure 1) is 0.69, and variance is 8.
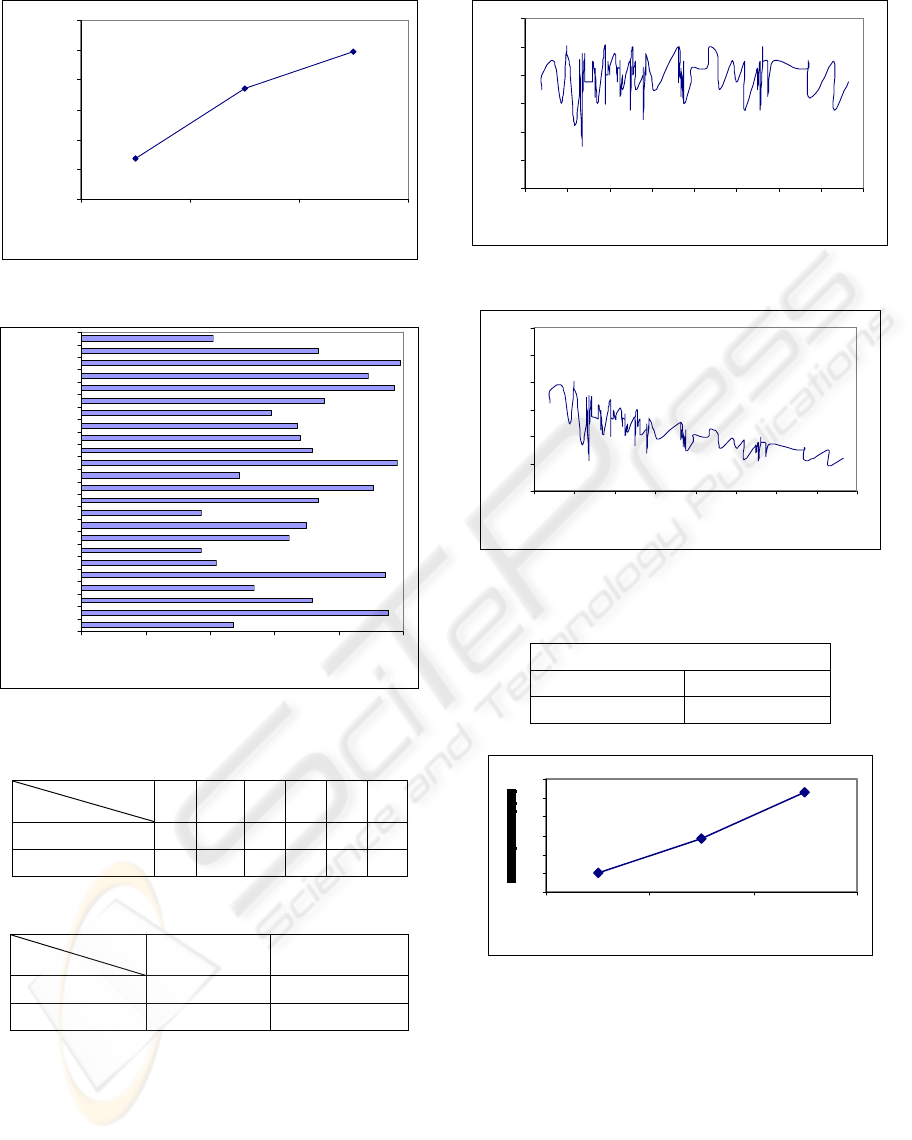
Figure 2 and Figure 3 relate effectiveness with
expertise and specific defects, respectively.
Table 1 shows effectiveness versus ODC
categories, and related variances.
Table 2 relates
effectiveness to the programming language of the
defected segments.
Figure 4 shows the evolution of effectiveness in
time.
4.1.2 Efficiency
Figure 5 presents efficiency with respect to
completion time.
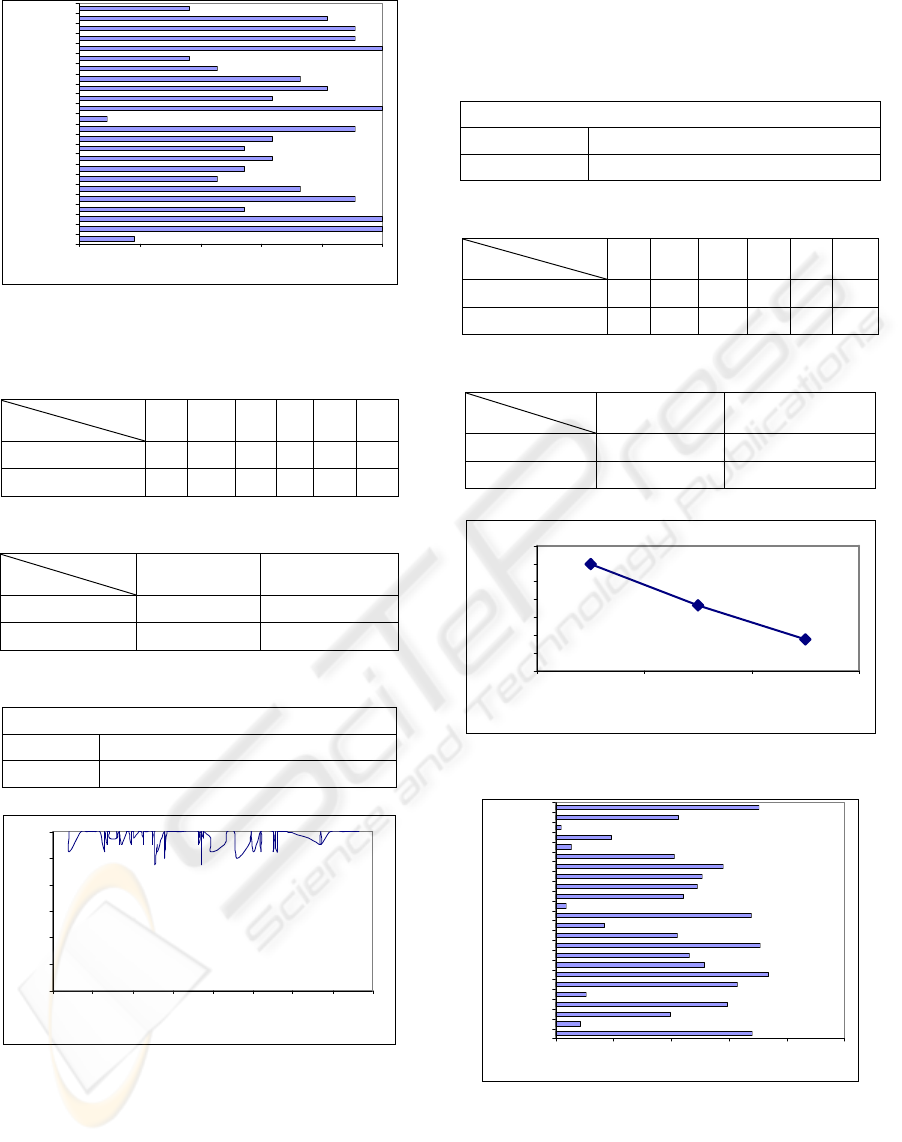
Table 3 shows statistical summary
for efficiency.
4.1.3 Orthogonality
Figure 6 and Figure 7 relate orthogonality with
expertise and specific defects, respectively.
Table 4
and
Table 5 present orthogonality versus ODC
categories, and programming language, respectively.
Table 6 shows statistical summary for
Orthogonality, and
Figure 8 presents the evolution
of orthogonality in time.
Mean Effectiveness = 69% Variance=8
0
20
40
60
80
100
1_MFC 1_NMFC Null Others
Categorizations
%
Figure 1: Categorizations and Effectiveness (with respect
to the whole data collected).
EXPLORING FEASIBILITY OF SOFTWARE DEFECTS ORTHOGONAL CLASSIFICATION
111
40
50
60
70
80
90
100
012
Expe rtise
Effectiveness %
Figure 2: Effectiveness versus Expertise.
0 204060801
1
2
3
4
5
6
7
8
9
10
11
12
13
14
15
16
17
18
19
20
21
22
23
24
Defect ID
Effectiveness (%)
00
Figure 3: Effectiveness per Defect.
Table 1: Effectiveness versus ODC Categories.
Category
Effectiveness
1 2 3 4 5 6
Average (%) 77 83 48 75 54 82
Variance 204 156 18 470 237 151
Table 2: Effectiveness versus Programming Language.
Language
Effectiveness
Java C++
Average (%) 61 78
Variance 402 248
0
4
8
12
16
20
24
3500 4500 5500 6500 7500 8500 9500 10500 11500
Time (se c.)
Effectiveness
Figure 4: Effectiveness in time.
0
4
8
12
16
20
24
3500 4500 5500 6500 7500 8500 9500 10500 11500
Time (sec.)
Efficency
Figure 5: Efficiency in time.
Table 3: Statistical summary for efficiency.
Efficiency
Average (MFC/h) 9
Variance 7,31
94
95
96
97
98
99
100
012
Expertise
Figure 6: Orthogonality versus Expertise.
ICSOFT 2006 - INTERNATIONAL CONFERENCE ON SOFTWARE AND DATA TECHNOLOGIES
112
90 92 94 96 98 100
1
2
3
4
5
6
7
8
9
10
11
12
13
14
15
16
17
18
19
20
21
22
23
24
Defect ID
Orthogonality (%)
Figure 7: Orthogonality per defect.
Table 4: Orthogonality versus ODC categories.
Category
Orthogonality
1 2 3 4 5 6
Average (%) 98 97 94 98 95 98
Variance 4 5 7 4 3 2
Table 5: Orthogonality versus programming language.
Language
Orthogonality
Java C++
Average (%) 96 97
Variance 6 7
Table 6: Statistical summary for orthogonality.
Orthogonality
Average (%) 97
Variance 2
0
4
8
12
16
20
24
3500 4500 5500 6500 7500 8500 9500 10500 11500
Time (sec.)
Orthogonality
Figure 8: Orthogonality in time.
4.1.4 Discrepancy
Table 7 shows statistical summary for discrepancy.
In the remaining, this Section presents discrepancy
with respect to ODC categories (
Table 8),
programming languages (
Table 9), expertise (Figure
9), and seeded defects (Figure 10), respectively.
Table 7: Statistical summary for Discrepancy.
Discrepancy
Average (%) 43
Variance 1010
Table 8: Discrepancy versus ODC Categories.
Category
Discrepancy
1 2 3 4 5 6
Average (%) 39 28 65 34 60 29
Variance 44 379 13 591 171 326
Table 9: Discrepancy versus Programming Language.
Language
Discrepancy
Java C++
Average (%) 50 50
Variance 453 478
0
10
20
30
40
50
60
70
012
Expertise
Discrepancy (%)
Figure 9: Discrepancy versus Expertise.
0 204060801
1
2
3
4
5
6
7
8
9
10
11
12
13
14
15
16
17
18
19
20
21
22
23
24
Defect ID
Disagreement (%)
00
Figure 10: Discrepancy per defect.
4.1.5 Affinity
Based on the average effectiveness shown above
(E=0.69), the number of categorizations that differ
from their (MFC)s is around 818.
EXPLORING FEASIBILITY OF SOFTWARE DEFECTS ORTHOGONAL CLASSIFICATION
113
While it is not possible to include all those
categorizations in this paper, we can describe their
tendencies, based on definitions given for Affinity in
Section 3.2 above: according to expressions (1),
A_WRT(
6, 5)= 90; A_WRT(2, 3)= 95; according to
expression (2), A_Btw(
1, 3, 5)= 90.
In words, when the MFC is 6 (Relationship) then
90% of categorizations provided by subjects are
6
(Relationship) or
5 (Interface/ OO Messages).
Moreover, when the MFC is 2 (Checking) then
95% of categorizations provided by subjects are
2
(Checking) or
3 (Algorithm/Method).
Furthermore, when MFC is 1 (Assignment/
Initialization),
3, or 5 then 90% of categorizations
provided by subjects are
1, 3, or 5.
Finally, let us spread on data “Others” in Figure
1
, which concern affinity. Columns Ctg1 and Ctg2
in
Table 10 present the alternative categorizations
that doubtful subjects assigned to defects; the Ocs
columns show the occurrences of those double
categorizations.
Table 10: Defect’s double categorizations (as provided by
doubtful subjects).
Ctg1 Ctg2 Ocs Ctg1 Ctg2 Ocs
1 3 3 3 6 1
1 5 2 4 5 1
2 3 3 4 6 2
3 4 2 5 6 1
3 5 2 Others 0
4.2 Hypothesis Testing
In order to test hypotheses concerning expertise, we
separate cases where the involved expertise is null
(0) from remaining ones (expertise measures 1 or 2),
so having the seeded defects partitioned in two
groups, G
X=0
, and G
X≠0
, respectively.
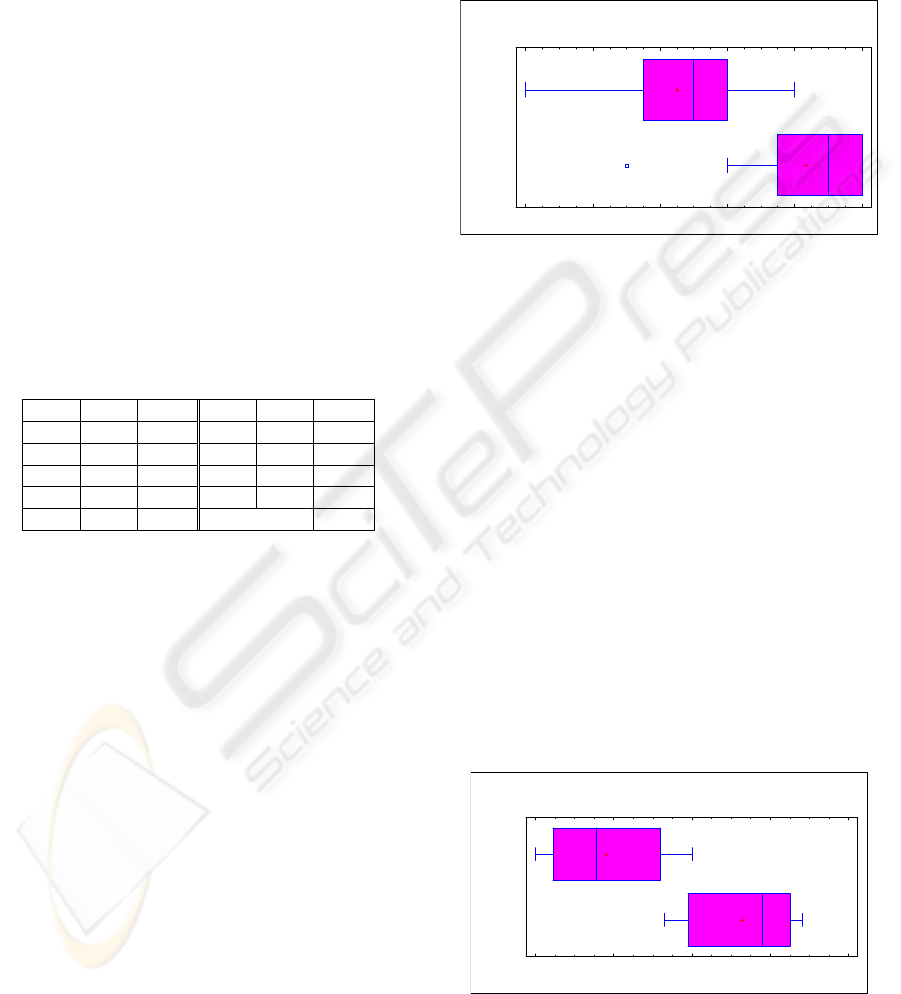
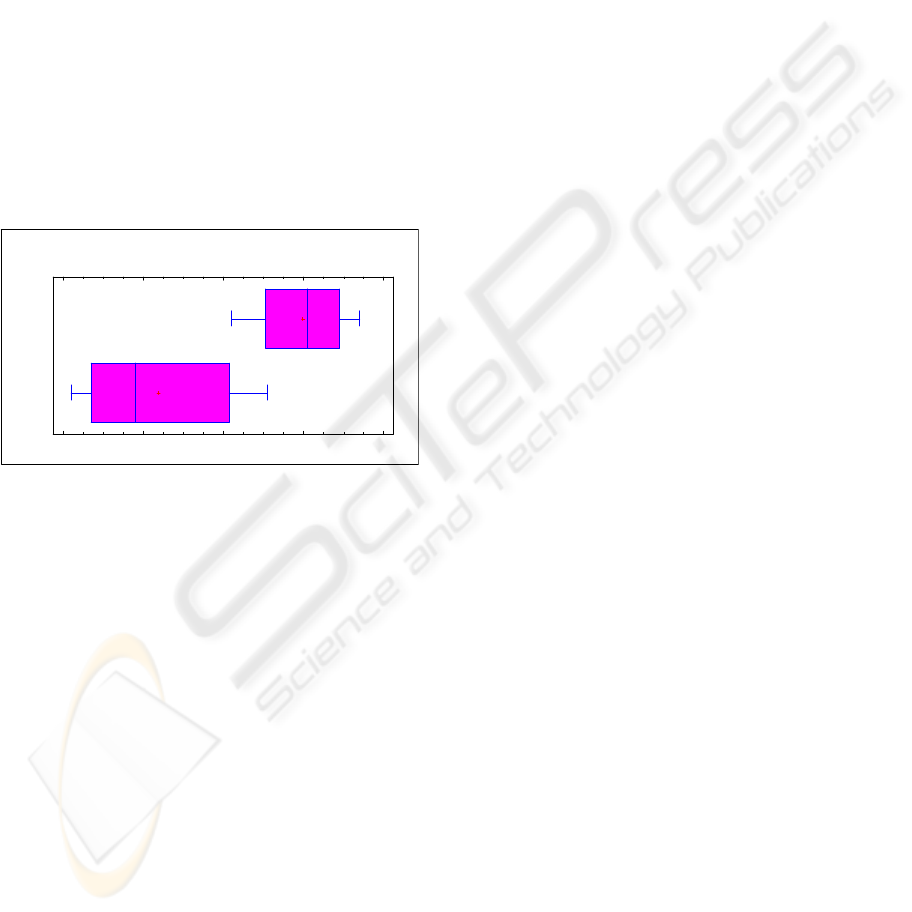
4.2.1 Testing h
XO0
. Expertise does
Insignificantly Impact on
Orthogonality: O(G
X=0
) ≅ O(G
X≠0
)
The number of subjects, who assigned one category
to G
X=0
defects, are: (100, 101, 103, 104, 104, 105,
105, 105, 106, 106, 107, 108), respectively; those for
G
X≠0
are: (103, 106, 107, 108, 109, 109, 109, 109,
110, 110, 110, 110).
Figure 11 shows the Box-and-
Whisker plots for such series of data. Since the latter
cannot fit under normal curve at 99% of confidence
level (in fact, its lowest P-value from Shapiro-Wilks
test is 0.0051, which is less than 0.01), we applied
the Mann-Whitney (Wilcoxon) W test to compare
medians. Since the W test’s P-value is 0.000919,
which is less than 0.05, there is a statistically
significant difference between the medians at the
95.0% confidence level. Consequently, we can reject
the null hypothesis h
XO0
at 95% of significance level.
In other words, expertise significantly impacts on
orthogonality of defect categorizations.
Orthogonality vs. Expertise
100 102 104 106 108 110
O
Others
Figure 11: Orthogonal classifications versus expertise.
4.2.2 Testing h
XE0
. Expertise does
Insignificantly Impact on
Effectiveness: E(G
X=0
) ≅ E(G
X≠0
)
The effectiveness values for categorizing G
X=0
defects are (41, 41, 45, 46, 52, 54, 59, 65, 71, 75, 79,
81), respectively; those for G
X≠0
are (74, 77, 79, 81,
83, 98, 100, 104, 105, 107, 108, 109).
Figure 12
shows the Box-and-Whisker plots for such series of
data. Since the latter cannot fit under normal curve
at 95% of confidence level (in fact, its lowest P-
value from Shapiro-Wilks test is 0.037, which is less
than 0.05), we applied the W test. Since the W test’s
P-value is 0.000194, which is less than 0.05, there is
a statistically significant difference between the
medians at the 95.0% confidence level.
Consequently, we can reject the null hypothesis h
XE0
at 95% of significance level. In other words,
expertise significantly impacts on effectiveness of
defect categorizations.
Effectiveness vs. Expertise
41 61 81 101 121
O
Others
Figure 12: Effectiveness versus expertise.
ICSOFT 2006 - INTERNATIONAL CONFERENCE ON SOFTWARE AND DATA TECHNOLOGIES
114
4.2.3 Testing h
XD0
. Expertise does
Insignificantly Impact on Discrepancy:
D(G
X=0
) ≅ D(G
X≠0
)
The discrepancy values related to categorizations of
G
X=0
defects are (42, 44, 49, 52, 58, 59, 63, 68, 68,
70, 71, 74), respectively; those for G
X≠0
are (2, 4, 5,
9, 10, 17, 19, 40, 41, 42, 46, 51).
Figure 13 shows
the Box-and-Whisker plots for such series of data.
Since the latter cannot fit under normal curve (in
fact, its lowest P-value from Chi-Square test is
0.022, which is less than 0.05), we applied the W
test. Since the W test’s P-value is 0.000137, which is
less than 0.05, there is a statistically significant
difference between the medians at the 95.0%
confidence level. Consequently, we can reject the
null hypothesis h
XD0
at 95% of significance level. In
other words, expertise significantly impacts on
discrepancy between defect categorizations.
Discrepancy vs. Expertise
020406080
O
Others
Figure 13: Level of Discrepancy, treated by experience.
5 DISCUSSION
5.1 Experiment Results
5.1.1 Effectiveness
Based on Figure 1, the percentage of most frequent
categorizations is in average 69%. This seems quite
a small value for effectiveness, which also means
that there seems to be high subjectivity in defect
categorization when trained/untrained novice
programmers are involved. Again
Figure 1 shows
that those programmers perform quite dissimilarly,
since variance (8) is very high - one third of the
seeded defects (24) - as also shown by
Figure 3 and
Table 1.
Figure 1 also shows that single non-MFC
classifications (1_NMFC) are in number ten times
greater than the doubtful ones (Null + Others). In
our understanding, this means that novices seem
unconscious of consequences that their limited
knowledge of ODC DT could have. Another view is
that IBM should improve the presentation of ODC
DT, in order to help practitioners to distinguish
among categories more easily.
Based on
Figure 2, it seems that effectiveness is
strongly related to expertise. In fact, effectiveness
grows from 54% up to 89% as the given training
grows. Based on that slope, the trend for
effectiveness is 100%, which expert professionals
should be able to approach. The impact of expertise
on results explains, in our understanding, the
variance previously observed with aggregated data.
This also asserts that data in
Table 1 should not be
utilized to evaluate the impact of defect category on
effectiveness, and, similarly, data in
Table 2 should
not be used to evaluate the impact of programming
languages on effectiveness.
Finally, based on Figure 4, effectiveness seems
independent from the completion time, when this is
limited to 3 hours.
5.1.2 Efficiency
The amount of time a subject employed to enact a
categorization is around 5 minutes in average.
Based on date in
Table 3, the mean time for an
MFC categorization is 6.66 minutes (9 MFC/hour),
and variance is 7.3 MFC/hour.
Since variance is similar to the average, it seems
that efficiency is highly subjective with novice
programmers. Let us recall that it was not possible to
collect the duration time during the basic
experiment; consequently, we cannot investigate
efficiency more deeply.
5.1.3 Orthogonality
Based on Table 6, which data are again not yet
disaggregated with respect to expertise,
orthogonality is 97%, while variance is 2. This
expresses that, in the average, programmers
commonly percept ODC with respect, and tend to
provide just one classification per defect, whatever
is their expertise. However, taking in consideration
data disaggregated by expertise (
Figure 6), with
novices, orthogonality grows from 95% up to 99.3%
as expertise grows.
Based on
Table 5, aggregated data show no
difference of C++ and Java versus orthogonality.
Finally, based on
Figure 8, orthogonality seems
independent from the completion time, when this is
limited to 3 hours.
EXPLORING FEASIBILITY OF SOFTWARE DEFECTS ORTHOGONAL CLASSIFICATION
115

5.1.4 Discrepancy
Subjects had to select a category out of seven
(including null). In theory, the maximum value for
discrepancy is 86%, which occurs when all
selections are equally probable; it is the probability
that six categories are selected out seven (less scale
factor 100). The minimum of discrepancy is 0%,
which occurs in case of complete agreement
between subjects for each categorization.
Table 7
shows 43% discrepancy (and 1010 variance!), as
registered in average for our basic experiment, again
with respect to data not yet disaggregated by
expertise. That value is exactly the mean between
the discrepancy’s minimum and maximum theoretic
values; as a result, ODC seems to be quite dependent
from the categorizers’ subjectivity, when
trained/untrained novices are involved.
Based on
Figure 9, which relates to data
disaggregated by expertise, it seems that discrepancy
is strongly related to expertise. In fact, discrepancy
decreases from 60% up to 17% as the given training
grows. Based on that slope, the trend for discrepancy
is the theoretic minimum (0%), which expert
professionals should be able to approach. The
impact of expertise on results explains, in our
understanding, the very large value previously
observed for variance, when aggregated data were
considered.
Based on
Table 9, aggregated data show no
difference of C++ and Java versus discrepancy.
Again, discrepancy seems independent from the
completion time, when this is limited to 3 hours.
5.1.5 Affinity
Based on data elaboration that we presented above
(see Section
4.1.5), it seems that categories
“Assignment/ Initialization”, “Algorithm/Method”,
and “Interface/OO Message” are one each other
strongly affine. Moreover, category “Interface/OO
Message” is frequently provided in place of
“Relationship”, and the same for
“Algorithm/Method” with respect to “Checking”.
This, in our understanding, calls for training
improvement by emphasizing on dissimilarities
among those categories.
5.2 Threats to Validity
This empirical study has a number of limitations that
should be taken into account when interpreting its
results.
Concerning the internal validity (Wohlin et al.,
1978) (i.e. the degree to which conclusions can be
drawn about the causal relationship between
independent variables and dependent variables), it
should be noted that we utilized a very limited
number of defect samples: 12 per language, hence
two defects per category. Moreover, while the task
completion time assigned was quite small, and
subjects were continually in control of observers
during the conduction of the experiment, we cannot
guaranty absence of interactions between
participants; in fact, these were student, who we
partially graded for their performance; in the
experiment cultural context, a student is appreciated,
who passes his solutions to colleagues. Furthermore,
our training emphasized on Java language, and the
real experience and expertise of subjects with C++
was not in control.
Another limitation of this study is related to the
external validity (Wohlin et al., 1978), i.e. the degree
to which the results from this study can be
generalized. It cannot be assumed a priori that the
results of a study generalize beyond the specific
environment and context in which it was conducted.
In fact, subjects involved with the basic experiment
are sophomores in OO Programming, who should
not be considered as novice professional
programmers. Moreover, the experiment software
artifacts that we utilized in the basic experiment are
small segments of code, which should not be taken
to represent real software. Finally, we utilized paper
supports both for experiment artifacts and forms,
while realism asked for electronic-supported code,
and electronic-network-supported form distribution,
and data collection.
6 CONCLUSIONS AND FUTURE
WORKS
This paper has presented an empirical investigation
on the (IBM)’s ODC-DT attribute for software
defect categorization. Foci of the investigation have
been the classification effectiveness, efficiency,
orthogonality, discrepancy, and affinity with respect
to practitioners’ subjectivity (110 students
performing in the role of experiment subjects),
defects individuality (6 DT categories of seeded
defects), and software artifacts’ coding language
(Java and C++). Results shown include averages for
time for defect categorization (≅5 minutes),
effectiveness (69%), and orthogonality (97%).
Results also show that subject’s expertise seems to
ICSOFT 2006 - INTERNATIONAL CONFERENCE ON SOFTWARE AND DATA TECHNOLOGIES
116

impact very significantly on all the results, and
subjects with enough expertise should be able to
easily approach the theoretic best value for
effectiveness, as for orthogonality and discrepancy.
Our consequent expectation is that there should be
objectivity in defect categorization, whether enacted
by software practitioners. However, such an
expectation still needs empirical evidence. Further
results show that, when time spent in categorizing
defects lasts between 1 and 3 hours, the
effectiveness, orthogonality, and discrepancy are not
affected by the time duration of the classification
section. Moreover, results show that the
programming language of coded artifacts, and the
defect nature seem to impact insignificantly on
effectiveness, orthogonality, and discrepancy.
Finally, our results show that there are some
categories that tend to confuse subjects; this, in our
understanding, calls for improving definitions of
those ODC DT categories, as actually given by IBM.
Namely, those categories are “Interface/OO
Message” and “Relationships”. Further confusing
categories are “Assignment/Initialization” and
“Algorithm/Method” on one side, and
“Algorithm/Method” and “Checking” on the other
side, which confirm previous results (Henningsson
and Wohlin, 2004).
Our plan for the future is first to extend the size of
our defect repository, place the material in electronic
format, and contact IBM experts in the aim of
receiving their categorizations of our defect samples
(to use as the reference “correct” categorizations),
and then to proceed with replicating the experiment
with professionals both in a controlled environment,
and through the Web. This should also provide the
precise timing of each categorization, and help to
investigate efficiency in deep.
REFERENCES
Abdelnabi Z., G. Cantone, M. Ciolkowski, D. Rombach:
“Comparing Code Reading Techniques Applied to
Object-oriented Software Frameworks with regard to
Effectiveness and Defect Detection Rate”, Proceedings
of the 2004 International Symposium on Empirical
Software Engineering, pp. Redondo Beach (CA),
2004.
Basili V.R, G. Caldiera, H.D. Rombach: “Goal Question
Metric Paradigm”, in Encyclopaedia of Software
Engineering, J.J. Marciniak Edr., Vol. 1, pp. 528-532,
John Wiley & Sons, 1994.
Basili V.R., and R. Selby: “Comparing the Effectiveness
of Software Testing Strategies”, IEEE Transactions on
Software Engineering, CS Press, December, 1987, pp.
1278 -1296.
Cantone G., Z. A. Abdulnabi, A. Lomartire, G. Calavaro:
“Effectiveness of Code Reading and Functional
Testing with Event-Driven Object-Oriented Software”,
Empirical Methods and Studies in Software
Engineering, R. Conradi and A. I. Wang Eds., LNCS
2765, pp. 166-193, Springer, 2003.
Cohen J.: "A Coefficient of Agreement for Nominal
Scales". In Educational and Psychological
Measurement, 20:37-46, 1960.
Durães J. and Madeira H., "Definition of Software Fault
Emulation Operators: a Field Data Study", In Proc. of
2003 International Conference on Dependable
Systems and Networks", (2003)
El Emam K. and I. Wieczorek: “The Repeatability of
Code Defect Classifications”, Proceedings of
International Symposium on Software Reliability
Engineering, pp. 322-333, 1998.
Henningsson K. and C. Wohlin: “Assuring Fault
Classification Agreement – An Empirical Evaluation”
Proceedings of the 2004 International Symposium on
Empirical Software Engineering, 2004.
Juristo N. and S. Vegas: “Functional Testing, Structural
Testing, and Code Reading: What Fault Type Do They
Each Detect?”, Empirical Methods and Studies in
Software Engineering, R. Conradi and A. I. Wang
Eds., LNCS 2765, pp. 208-232, Springer, 2003.
Myers G.J.: “A Controlled Experiment in Program Testing
and Code Walkthroughs/Reviews”, Communications
of ACM, Vol. 21 (9), pp. 760-768, 1978.
Wohlin C., P. Runeson, M. Höst, M.C. Ohlsson, B.
Regnell, A. Wesslén: “Experimentation in Software
Engineering: An Introduction”, The Kluwer
International Series in Software Engineering, 2000.
IBM a, “Details of ODC v 5.11”,
www.research.ibm.com/softeng/ODC/DETODC.HTM
, last access: 02/05/2006.
IBM b, “ODC Frequently Asked Questions”,
www.research.ibm.com/softeng/ODC/FAQ.HTM, last
access: 02/05/2006.
EXPLORING FEASIBILITY OF SOFTWARE DEFECTS ORTHOGONAL CLASSIFICATION
117
