
INTRODUCTION TO CHARACTERIZATION OF MONITORS
FOR TESTING SAFETY-CRITICAL SOFTWARE
Christian Di Biagio, Guido Pennella
MBDA-Italy SpA, Via Tiburtina, Roma, Italy
Anna Lomartire
Centro di Calcolo e Documentazione, Università degli Studi di Roma “Tor Vergata”, Via O. Raimondo, Roma, Italy
Giovanni Cantone
Dip. di Informatica, Sistemi e Produzione, Università degli Studi di Roma “Tor Vergata”, Via O. Raimondo, Roma, Italy
Keywords: Software engineering, Distributed and parallel systems, Hard real-time Systems, Performance-measurement
tools.
Abstract: The goal of this paper is to characterize software technologies to test hard real-time software by focusing on
measurement of CPU and memory loads, performance monitoring of processes and their threads,
intrusiveness, and some other key features and capabilities, in the context of the Italian branch of a
multinational organization, which works in the domain of safety-critical systems, from the points of view of
the project managers of such an organization, on one side, and the applied researcher, on the other side. The
paper first sketches on the state of the art in the field of testing technologies for safety-critical systems, then
presents a characterization model, which is based on goals of the reference company, and then applies that
model to major testing tools available.
1 INTRODUCTION
The development of safety critical software in
industrial settings is usually influenced by user non-
functional requirements that concern the load (e.g.
the usage of the CPU and Memory in a period),
which is specified not exceed a fixed level, of any
computing node in a certain scenario.
Before designing safety-critical or mission-
critical real-time syste
ms, a specification of the
required behaviour of the system should be produced
and reviewed by domain experts. As the
implementation advances, eventually it completes,
the system is thoroughly tested to be confident that it
behaves correctly. In fact, the concept of software
verification and validation was eventually extended
up to include quality assurance for new digitalized
safety-critical systems (EPRI, 1994).
The test of the system’s temporal behaviours
seem
s best done when using a monitor, i.e. a system
able to observe and analyze behaviours shown by
another remote system (a.k.a.: the “target”). Several
authors (e.g. (Tsai, 1995) also suggested that it is
useful and practical using monitors to analyze the
behaviour of a real-time system. Such a monitor
could be used either as an “oracle” (Weyuker, 1982),
which reports true values during system testing, or,
for a limited class of systems, as a “supervisor”
(Simser, 1996), which detect and report system
failures during operation.
In safety-critical applications, the system should
be m
onitored by an independent safety system to
ensure continued correct behaviour. To achieve
these goals, there must be a means for quickly
determining if the observed behaviour is acceptable
or not; this can be quite difficult for complex real-
time systems. In other words, because software
practitioners cannot diagnose, troubleshoot, and
resolve every component affecting a critical
software performance by using just manual methods,
the consequent question is: To what extend the
testing technology that the market provides is able to
give practitioners help in verifying the temporal
253
Di Biagio C., Pennella G., Lomartire A. and Cantone G. (2006).
INTRODUCTION TO CHARACTERIZATION OF MONITORS FOR TESTING SAFETY-CRITICAL SOFTWARE.
In Proceedings of the First International Conference on Software and Data Technologies, pages 253-256
DOI: 10.5220/0001311102530256
Copyright
c
SciTePress
behaviour of their safety-critical software, seeing a
problem in real time, drilling down and resolving it
fast?
The reference company for this paper – the
Italian branch of a multination organization in the
field of safety & mission critical software – asked us
that question when the need emerged from her
production lines for a test-suite to validate internal
software products. In fact, her project managers
were unsatisfied with their testing technologies and
approaches, and were addressing their processes and
products for quality improvement. Of course they
were not looking just for one more test tool, but for a
technology able to meet their improvement goals.
This paper is concerned with answering that
aforementioned question. In GQM terms (Basili,
1994): The goals are to characterize testing
technologies by focusing on measurement of CPU
and memory loads, performance monitoring of
distributed heterogeneous processes and their
threads, intrusiveness, and other key features and
capabilities, in the context of a multination
organization for the domain of individual/social life-
critical systems, from the points of view of the
project manager and the applied researcher,
respectively.
In the remaining of the present paper, Section 2
surveys on, and analyzes features provided (or non-
provided!) by the major tools for monitoring the
testing of hard real-time software. Section 3 collects
the results from analysis above, and Section 4
evaluates those results. Section 5 presents some
conclusions and points to future research.
2 MAJOR TECHNOLOGY
AVA I L A B L E
In the present section we focus our attention on the
most known system-load monitoring tools. These,to
the best of our knowledge, are:
• Quest SpotLight™ (Quest SpotLight, 2006)
• TOP (William Lefebre,s Top, 2006)
• Solaris Performance Meter™ (Solaris
Performance Meter, 2006).
Let us note additionally that, again to the best of
our knowledge, Quest SpotLight™ and (William
LeFebvre’s) Top™ are the most used tools for Unix
standard OS.
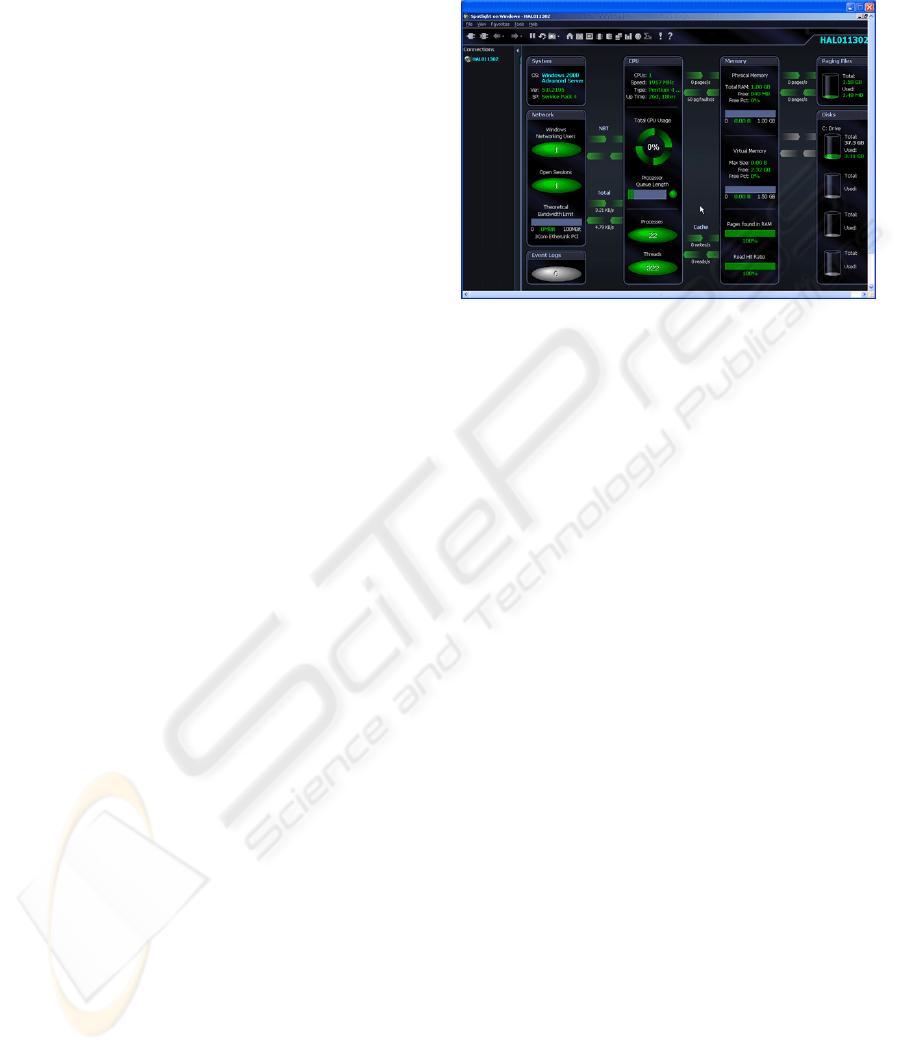
2.1 Quest SpotLight™
Based on official documentation (Quest SpotLight,
2006), this tool graphically displays the real-time
flow of data within MS Windows OS, so enabling
the user to watch and respond to problems before
they become a major concern. Key Features are: (i)
Graphical, actionable diagnostic console, which
combines data from multiple sources.
Figure 1: A Quest SpotLight™ output.
(ii) Automatic calibration: the tool offers a
calibration process that automatically sets a baseline
of normal activity and thresholds for each system.
(iii) Detailed process tracking capabilities: the tool
displays up to 24 hours of historical information
about specific processes including CPU usage,
number of threads, handles, and page faults. (iv)
Event Log tracking: the tool alerts the user whenever
specific or general event log entries have been
generated on the servers being viewed.
Figure 1 shows an output from Quest
SpotLight™.
2.2 TOP
Based on official documentation William Lefebre’s
Top, 2006), the system utility Top provides a
continuous, real-time look at the system's
consumption of memory and CPU resources. It lists
the most consumptive process first, so finding that
process that is gobbling machine resources is
relatively easy. Top also displays: the total operation
time for the system since the last reboot; load
averages; process counts for various states; the
percentage of CPU time broken down between user,
system, nice, and idle; memory and swap space
usage; as well
as the list of the processes using the
largest amount of the machine resources. Figure 2
shows a sample output from Top.
2.3 Solaris Performance Meter™
This tool is frequently used to monitor activity and
performance on a workstation. Several performance
parameters such as CPU utilization, disk activity,
ICSOFT 2006 - INTERNATIONAL CONFERENCE ON SOFTWARE AND DATA TECHNOLOGIES
254
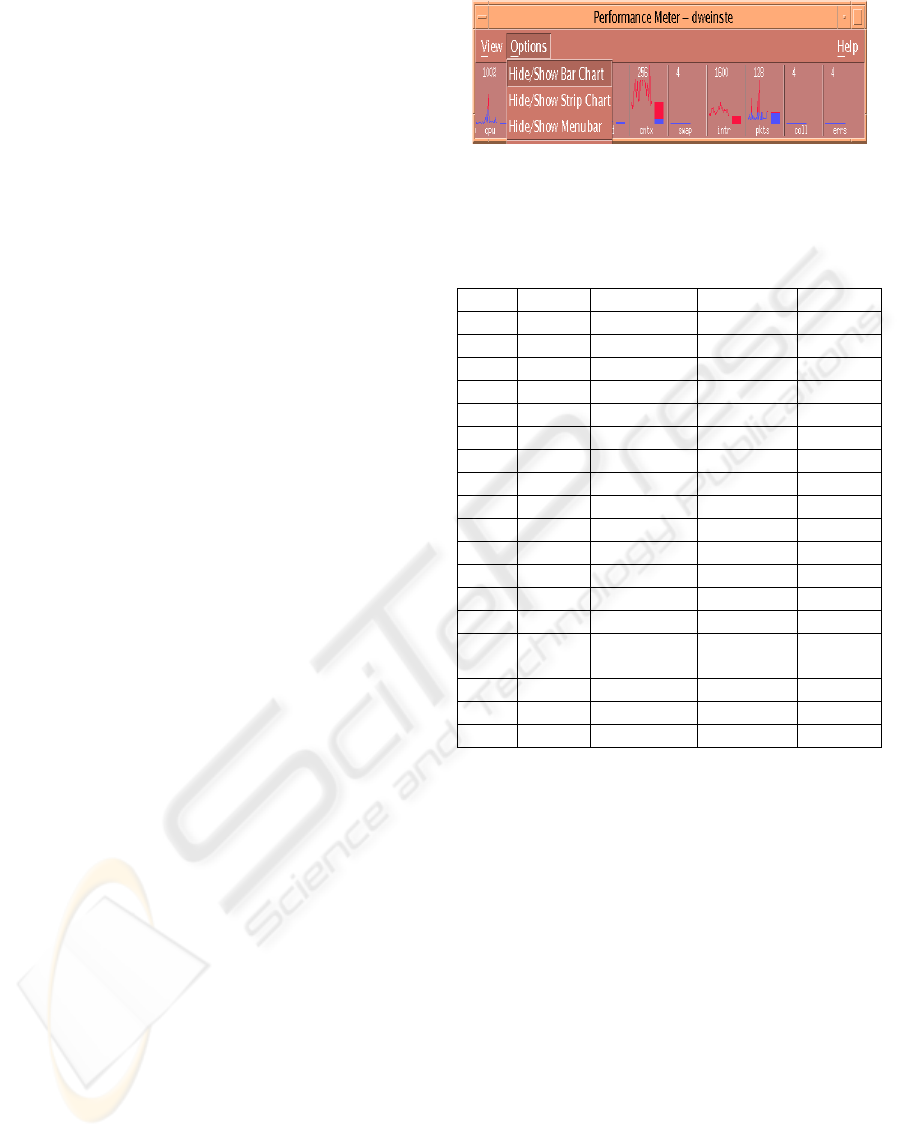
network packets, and the like, can be displayed
graphically in a customizable window.
Last pid: 22336; load averages: 0.12, 0.11,
0.09 11:39:58
80 processes: 73 sleeping, 6 zombie, 1 on
cpu
Memory: 256M real, 90M free, 34M swap in
use, 351M swap free
PID USERNAME THR PRI NICE SIZE RES STATE
TIME CPU COMMAND
21440 root 1 35 -3 12M 11M
sleep 0:20 1.74% ncftpd
22336 mortimer 1 -7 0 1368K 1264K
cpu/0 0:00 0.63% top
21075 root 1 34 -3 1832K 1456K
sleep 0:16 0.33% ncftpd
127 msql 1 -25 0 1640K 936K sleep
254:03 0.18% msql2d
22305 www 1 33 0 2728K 2112K
sleep 0:00 0.04% httpd
22304 www 1 33 0 2728K 2112K
sleep 0:00 0.04% httpd
22308 www 1 33 0 2728K 2112K
sleep 0:00 0.02% httpd
22296 www 1 33 0 2728K 2112K
sleep 0:00 0.02% httpd
22302 www 1 33 0 2656K
Figure 2: A sample output from Top.
Solaris Performance Meter™ users can monitor
performance of local or remote hosts, set up colour-
coded activity thresholds to raise warns in case of
exceptional performance, and log the samples to a
file.
Figure 3 shows a typical output from Solaris
Performance Meter™ (Solaris Performance Meter,
2006).
3 RESULTS
Let T1, T2, and T3 denote, in any order, the three
tools sketched by Section 2.3 above (it is not our
role to advertise or counter-advertise tools; so we do
not map comments and tools).
Table 1 synthesizes on the characteristics of T1,
T2, and T3, in the perspective of a model of ideal
technology that we constructed on needs placed by
testing professionals at our reference company. This
model was based on cost and 17 features, which are
synthetically presented in Table 1, Column 1. These
features relate to tools capabilities, including: to
cope with heterogeneous targets, CPU and memory
load for system, processes and threads, data
persistency, tailorability, non-intrusiveness, ability
to cope with distributed systems and multi-platforms
(Di Biagio, 2006).
Figure 3: A Solaris Performance Meter™ output.
Table 2: Characterization of T1, T2 and T3 monitoring
tools (N≡0|Y≡1; Li ≡ Linux 2.6; Ly ≡ LynxOS; S ≡
Solaris).
F m T1 T2 T3
F1 0..1 0 0 0
F2 % 3 60 3
F3 MB 1 0 0,5
F4 0..1 0 0 0
F5 0..1 0 0 0
F6 (sec.) 3 10 1
F7 0..1 0 1 0
F8 0..1 0 0 0
F9 0..1 1 1 1
F10 0..1 1 1 1
F11 0..1 1 0 0
F12 0..1 1 0 0
F13 0..1 0 0 0
F14 0..1 0 0 0
F15 OS list
Li, Ly, S,
AIX
Li S
F16 0..1 0 0 0
F17 0..1 0 0 0
Cost 0..*$ 0 $$$ 0
Because many of the values in Table 1 are null,
we renounced to assign weights to features and
compute an indicator for each of the shown tools.
Concerning T1, it outputs data on, and
continually refresh, a shell. While T1 is sufficiently
non-intrusive, it resides on the target system, where
repositories and graphic and statistical analysis
packages are usually not allowed. This means that
there is no support for: (i) Monitoring different
targets at the same time, in order to compare them in
real time. (ii) Reviewing tests and DB repository;
(iii) Tailoring to minimize intrusiveness. (iv)
Thread-monitoring to observe the behaviour of
developed products. In our view, the main lack of T1
concerns its architecture, which is not suitable
(Simser, 1996).
Concerning T2, main lacks regard again its
architecture, in our view. In fact, T2 accesses the
target system through TCP/IP over Ethernet, where
no sensor is installed. This means that data
acquisition is system-call enacted (i.e. the OS
INTRODUCTION TO CHARACTERIZATION OF MONITORS FOR TESTING SAFETY-CRITICAL SOFTWARE
255

command “ps”). As a consequence, measurements
are strongly intrusive (up to 60% of CPU during
acquisition, in our experience). Moreover, there is
no support for: (i) Monitoring different targets at the
same time, in order to compare them in real time. (ii)
Reviewing tests for future reuse, and DB repository.
(iii) Tailoring to minimize intrusiveness. (iv) Process
and thread monitoring.
Concerning T3, in our view, its major limit is the
absence of supports for: (i) Monitoring different
targets at the same time, in order to compare them in
real time. (ii) Reviewing tests for future reuse, and
DB repository. (iii) Tailoring to minimize
intrusiveness. (iv) Process and thread monitoring.
(v) Solaris is the only OS that T3 supports.
4 DISCUSSION
All the major tools for monitoring hard real-time
software seems to present substantial limits with
respect to the ideal technology of our reference
company (see Table 1).
T3 seems too far from that ideal: in fact,
multiple monitoring (F1), data storage (F4), tailoring
(F5), and process monitoring (F11 .. F14) are not
supported at all. Concerning T1 and T2, while at a
first view they seem to match many of the features
and capabilities that our ideal model requires, they
lost such a primacy when we look deeper for their
intrusiveness (F6): in fact, this is one of the most
important aspect in safety critical software. T1
seems to best fit many other required features and
capabilities, Anyway, it does not support tailoring
(F5), data storage (F4), distributed architecture (F7),
threads monitoring (F13, F14).
Overall, all those tools show a main limit: none
of them provides what we called with Sensor (F17),
i.e. a module built right for acquiring and sending-
out data by using negectable resourses and time. Of
course, they carry out those activities, but in
different, often broad, ways. In particular: (i) T1 is
not so much intrusive, and sensitive data are
continually refreshed. However, it resides on the
target, which is expected to be not in charge of
providing utility functions. (ii) T2 accesses the target
system through TCP/IP, where no sensor is installed:
because of the consequent usage of system calls, the
tool is strongly intrusive. (iii) T3 is non-intrusive,
but the set of data it is able to acquire is very limited.
As a conclusive remark, the real trouble with
traded tools seems to be that they assume the point
of view of the “System Administrator”, so
answering questions like: “What is the behaviour of
my system”. Vice versa, as already mentioned, what
our reference company needs is a “Software
Engineer” view, so answering questions like: “What
is the problem”, “Where is the problem”, “Who
generated the problem”.
5 CONCLUSION AND FUTURE
WORK
We have presented a model, which is based on the
quality improvement goals of the reference
organization for this paper, and aimed to
characterize technologies for testing time-properties
of safety-critical software. We have also presented
results from the application of that model to three
major tools for monitoring hard real-time software
during test sessions. Based on those results, it seems
that the technology provided by the market does not
meet sufficiently the needs of our reference
company. Management of that company is hence
invited to evaluate the chances they have to develop
in house their ideal technology for something like
this.
REFERENCES
Basili, V. R., Caldiera, G., and Rombach, H. D., The Goal
Question Metric Approach, Encyclopedia of Software
Engineering, Wiley&Sons Inc., 1994.
EPRI, Handbook for verification and validation of digital
systems, Vol.1: Summary, EPRI TR103291, Vol.1,
1994.
QUEST SPOTLIGHT™ http://wm.quest.com/libra
ry/docs/spotlightwindows/SpotlightWindows.pdf
Simser D. and R.E. Seviora, Supervision of Real-Time
Systems Using Optimistic Path Prediction and
Rollbacks, Procs. Int’l Symp. Software Reliability
Eng. (ISSRE), pp. 340–349, Oct. 1996.
SOLARIS PERFORMANCE METER™ 2.0.0
http://docsun.cites.uiuc.edu/sun_docs/C/solaris_9/SUNWa
be/CDEUG/p125.html
TOP- William LeFebvre’s
http://www.uwsg.iu.edu/UAU/system/top.html
Tsai J.J., Yang S.J., Monitoring and Debugging of
Distributed Real-Time Systems, J.J. Tsai and S.J.
Yang, eds., IEEE CS Press, 1995.
Weyuker E.J., On Testing Non-Testable Programs, The
Computer J., vol. 25, no. 4, pp. 465–470, 1982.
Di Biagio C., Pennella G., Pesce G., and Cantone G.,
Advancing on Testinf Safety-Critcial Software, Procs.
of ICSOFT 06 (these Proceedings), Setubal, 2006.
ICSOFT 2006 - INTERNATIONAL CONFERENCE ON SOFTWARE AND DATA TECHNOLOGIES
256
