
HIDING INFORMATION IN WAV-FILE
Implementation, Analysis and Evaluation
Alkhraisat Habes
Russian Academy of Science, Saint Petersburg Institute for Informatics and Automation RAS,
St. 14 Line, 39,199178, Saint Petersburg, Russian Federation
Keywords: Steganography, Low and band bass filter, Host signal, imbedded signal, stego signal, interpolation, and
modulation.
Abstract: This paper focuses on the problem of Steganography: how can two communicating entities send secret
messages over a public channel so that a third party cannot detect the presence of the secret messages.
Notice that the goal of steganography is different from classical encryption, which seeks to conceal the
content of secret messages. The goal of steganography is to hide messages inside other harmless messages
in a way that does not allow any enemy to even detect that there is a second secret message present. This
paper investigates the implementation of hiding secret message (WAV and image file) inside WAV file
called a BASE or HOST, explores several methods in detail, and attempts to test them out in code, and in
practice, through several examples.
1 INTRODUCTION
The art and science of hiding information by
embedding messages within others; seemingly
harmless messages are called Steganography.
Steganography works by replacing bits of useless or
unused data in regular computer files (such as
graphics, sound, etc) with bits of different, invisible
information. Hidden information can be plain text,
cipher text, or even images and sound wave.
Steganographic “protocols” have a long and
fascinating history that goes back to antiquity. There
are stories of secret messages written in invisible ink
or hidden in love letters (the first character of each
sentence can be used to spell a secret, for instance).
More recently, steganography was used by
prisoners, spies and soldiers during World War II
because mail was carefully inspected by both the
Allied and Axis governments at the time. Postal
censors crossed out anything that looked like
sensitive information (e.g. long strings of digits),
and they prosecuted individuals whose mail seemed
suspicious. In many cases, censors even randomly
deleted innocent-looking sentences or entire
paragraphs in order to prevent secret messages from
being delivered. More recently there has been a great
deal of interest in digital steganography, that is, in
hiding secret messages in communications between
computers.
The recent interest in digital steganography is
fuelled by the increased amount of communication
which is mediated by computers and by the
numerous potential commercial applications: hidden
information could potentially be used to detect or
limit the unauthorized propagation of the innocent-
looking “carrier” data. Because of this, there have
been numerous proposals for protocols to hide data
in channels containing pictures, video, audio, and
even typeset text. Many of these protocols are
extremely clever and rely heavily on domain-specific
properties of these channels. On the other hand, the
literature on steganography also contains many
clever attacks which detect the use of such protocols.
In addition, there is no clear consensus in the
literature about what it should mean for a
stegosystem to be secure; this ambiguity makes it
unclear whether it is even possible to have a secure
protocol for steganography.
2 TERMS USED
In the field of steganography, some terminologies
have developed. The adjectives cover, embedded and
stego were defined at the Information Hiding
274
Habes A. (2006).
HIDING INFORMATION IN WAV-FILE - Implementation, Analysis and Evaluation.
In Proceedings of WEBIST 2006 - Second International Conference on Web Information Systems and Technologies - Internet Technology / Web
Interface and Applications, pages 274-281
DOI: 10.5220/0001257802740281
Copyright
c
SciTePress
Workshop held in Cambridge, England. The term
“cover” is used to describe the original, innocent
message, data, audio, and video and so on. When
referring to audio signal steganography, the cover
signal is sometimes called the “host” signal.
The information to be hidden in the cover data is
known as the “embedded” data. The “stego” data is
the data containing both the cover signal and the
“embedded” information. Logically, the processing
of putting the hidden or embedded data, into the
cover data, is sometimes known as embedding.
Occasionally, especially when referring to image
steganography, the cover image is known as the
container.
3 TECHNIQUES
There are two approaches for signal representation:
In time domain the signal is represented as a
function of time (vertical axis is amplitude or
voltage and the horizontal axis is time). In the
frequency domain, the vertical axis is still voltage
but the horizontal axis is frequency. Attempts have
been made to hide secret message in WAV signal in
both domains.
The process of encoding a message inside WAV-
file involves 3 essential steps:
1. Preparing the Host signal.
2. Preparing the embedded message.
3. Adding signals together.
3.1 Hiding Data within WAV File in
Frequency Domain
Conventional CD quality audio has a sample rate of
44.1 kHz and an effective frequency range of 0-
22050 Hz. However, the frequency range of human
hearing only extends from 15 Hz up to somewhere
between 15000 and 20000 Hz depending on the
individual. Even those who can hear up to 20000 Hz
cannot hear those very high frequencies well. So
there is the potential to alter the high frequency
range of a sound by inserting a secret message and
have the result be imperceptible. Figure 1: and
Figure 2 illustrate the process of hiding and
extracting embedded message
.
3.1.1 Preparing the Host Signal
Step 1: Select a good candidate. The host signal
should be long enough to fit the entire embedded
message. It should also be a relatively active signal
that contains a large amount of information in the
low and mid range frequencies in order to mask what
is happening in the high frequencies.
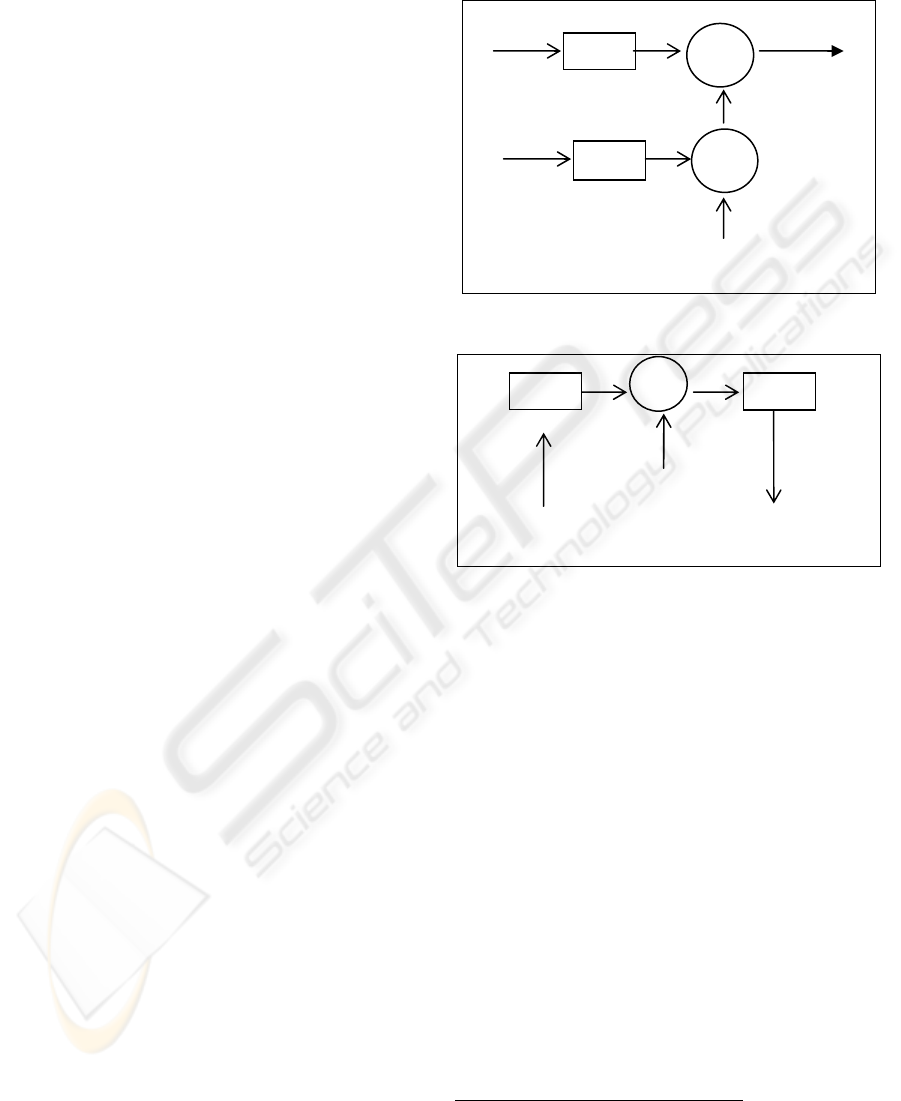
Figure 2: Block diagram of the receiver.
Step 2: Once a good candidate has been selected it
simply has to be sent through a low pass filter with a
cutoff at 17 kHz to cut off the 17-22.050 kHz
frequency range for our embedded message (which
will clear up the upper 5 kHz) Figure 4. Equation (1)
shows low pass filter's equation.
)()()( thtxty
⊗
=
(1)
Where
)(ty
is the output (magnitude and phase),
)(tx : is the input (magnitude and phase),
)(th : is the impulse response of the filter,
And
⊗
: denotes convolution.
The impulse response of filter is a sequence
of numbers called the filter coefficient. We get the
filter coefficient by simply reading them from the
graph of sinc-function (Figure 3), given by the
following equation:
)(sin)( kTfccTfckh ⋅
⋅
⋅
⋅
=
1
(2)
Where k = -z…, 0 …z
1
fc: cutoff frequency
K: number of required coefficient
T: sample rate = 1/ sample frequency(fs)
Figure 1: Block diagram of the transmitter.
Host signal
Message
LPF
BPF
∑
×
Stego
signal
)2cos( Tfspi ⋅⋅⋅
BPF
×
)2cos( Tfspi ⋅
⋅
⋅
Stego signal
LPF
Recovered signal
HIDING INFORMATION IN WAV-FILE - Implementation, Analysis and Evaluation
275
),( xhconvy = : convolves vectors h and x. Let m
= length (h) and n = length(x). Then y is the vector
of length m+n-1 whose k
th
element is given by:
∑
−+=
j
jkxjhky )1()()( (3)
The sum is over all values of j which lead to
legal subscripts for h (j) and h (k+1-j), specifically j
= max (1, k+1-n): min (k,m):
y (1) = h (1)*x (1)
y (2) = h (1)*x (2) +h (2)*x (1)
y (3) = h(1)*x(3)+h(2)*x(2)+h(3)*x(1)
y (k) = h(1)*x(n)+h(2)*x(n-1)+ ... +h(n)*x(1)
-30 -20 -10 0 10 20 30
-0.5
0
0.5
1
Sinc(x)
X
-3 -2 -1 0 1 2 3
x 10
4
0
0.5
1
1.5
Freque ncy Hz
phase
l ow p a ss f i lte r
Figure 3: Sinc function
"impulse response of
filter.”
Figure 4: Low pass filter
cut off at 17000.
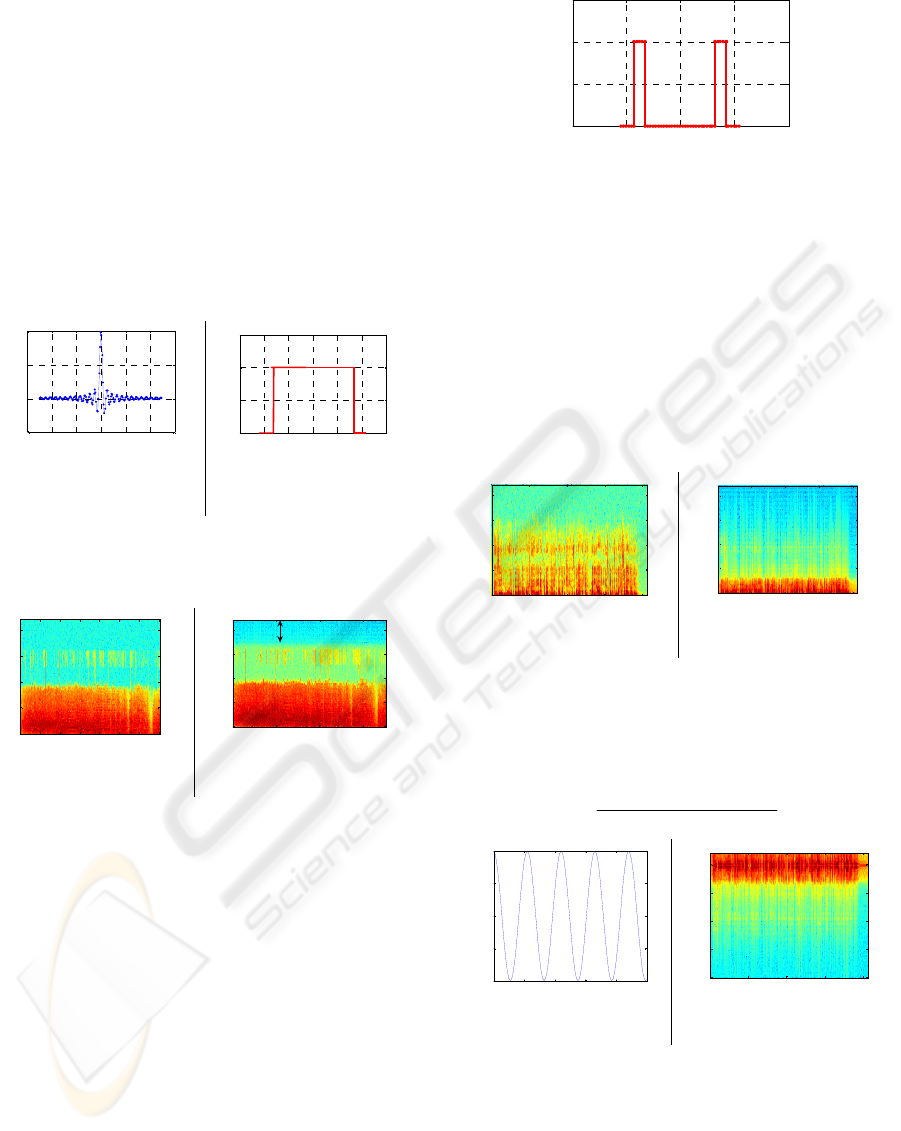
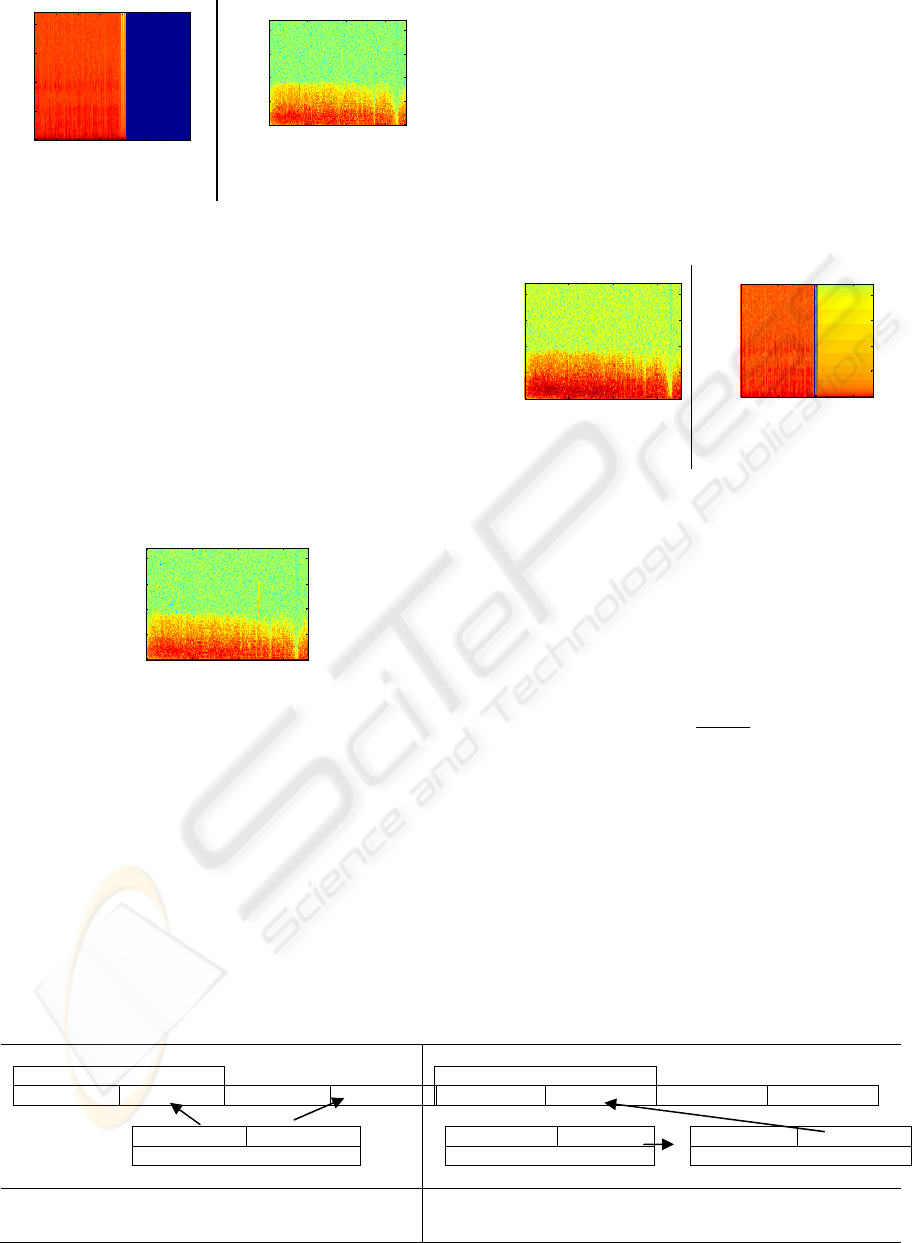
Figure 5 and Figure 6 illustrate spectrogram of host
signal and filtered host signal.
Time
Frequency
Container Signal
0 5 10 15 20 25 30 35
0
0.5
1
1.5
2
x 10
4
Time
Frequency
0 10 20 30
0
0.5
1
1.5
2
x 10
4
pl a ce f o r se cre t m e ssa ge
Figure 5: Host signal. Figure 6: Spectrogram of
filtered Host signal.
3.1.2 Preparing the Embedded Message
The exact method of preparation for the embedded
message depends on its nature (sound, image, etc.),
but they essentially all boil down to formatting the
data so that it fits roughly within a 17-22 kHz
frequency range.
3.1.3 Preparing Embedded Signal
Step 1: Run the embedded signal (Figure 8) through
band pass filter with the band 100Hz – 3.5 kHz
(Error! Reference source not found.), which will
be a small enough band to fit in the upper portion of
the filtered host signal (Figure 9).
-40 -20 0 20 40
0
0.5
1
1.5
Frequency
Phase
x 10
4
Figure 7: Band pass filter with 4kHz window.
Step 2: Modulate the filter signal to fall in the
correct area by multiplying it by a 20 kHz cosine
wave (Figure 10) so that the frequency range of the
embedded message is pushed up 20 kHz.
For i= 1 to length (filter_msg)
)/20002cos(_ ifsmsgFiltMs ⋅⋅⋅
⋅
=
π
(4)
End
Time
Frequency
Secret Signal
5 10 15 20
0
0.5
1
1.5
2
x 10
4
Time
Frequency
5 10 15 20
0
0.5
1
1.5
2
x 10
4
Figure 8: Embedded signal. Figure 9: Filtered
embedded signal.
Then combine the filtered, modulated embedded
signal with the filtered host signal and we get the
encoded signal with the hidden message in it. The
resulting signal is then scaled to avoid clipping.
Figure 11 shows spectrogram of the stego signal.
))_(max(
_
_
signalfinabs
signalfin
signalscaled =
(5)
0 20 40 60 80 100
-1
-0.5
0
0.5
1
Amplitude
Time
Time
Frequency
5 10 15 20
0
0.5
1
1.5
2
x 10
4
Figure 10: 20 kHz cosine.
wave for modulation.
Figure 11: Stego signal.
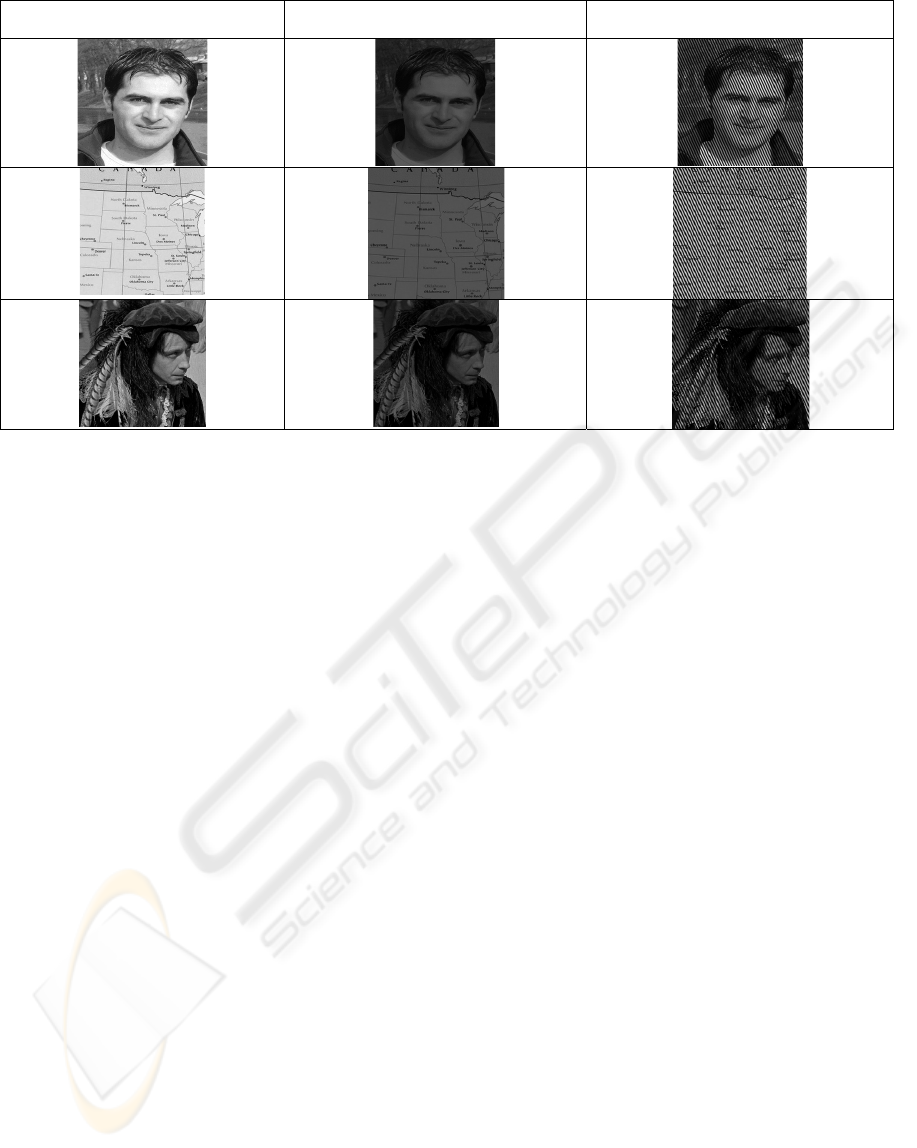
3.1.4 Preparing Embedded Image
In our experiments we used 256256 × 8-bits gray
scale image (Figure 12)
WEBIST 2006 - INTERNET TECHNOLOGY
276
Figure 12: Example of image that we used in our
experiments.
Step 1: Flat the horizontal lines of pixels together
into one long line of image signal.
Step 2: Interpolate the linear signal to increase
sample rate using Matlab’s interpolation features
(Figure 13 & Figure 14), new sample rate is chosen
so that the resulting signal takes up as much
available space in the host signal as possible, which
is also improve the quality of recovered signal (table
2 page 8).
mult = floor (length (carrier)/length (msg));
msg = interp (msg, mult);
Step 3: Modulate the interpolated signal to fall in
the correct area by multiplying by 20 kHz cosine
wave.
Once both the host and the embedded message have
been prepared, they can be simply added together to
get the stego signal (Figure 15 & Figure 16). The
resulting signal is then scaled to avoid clipping using
Equation (5).
0 5 10 15 20 25 30
-2
-1
0
1
2
Original Signal
0 20 40 60 80 100 120
-2
-1.5
-1
-0.5
0
0.5
1
1.5
2
Interpolated Signal
Figure 13: Original signal. Figure 14: Interpolated
signal.
Time
Frequency
Combined Singnal
0 10 20 30
0
0.5
1
1.5
2
x 10
4
Time
Frequency
Combine Signa l
5 10 15 2
0
0.5
1
1.5
2
x 10
4
Figure 15: Stego signal
(host and hidden WAV
signal).
Figure 16: Stego signal
(Host WAV signal &
embedded image).
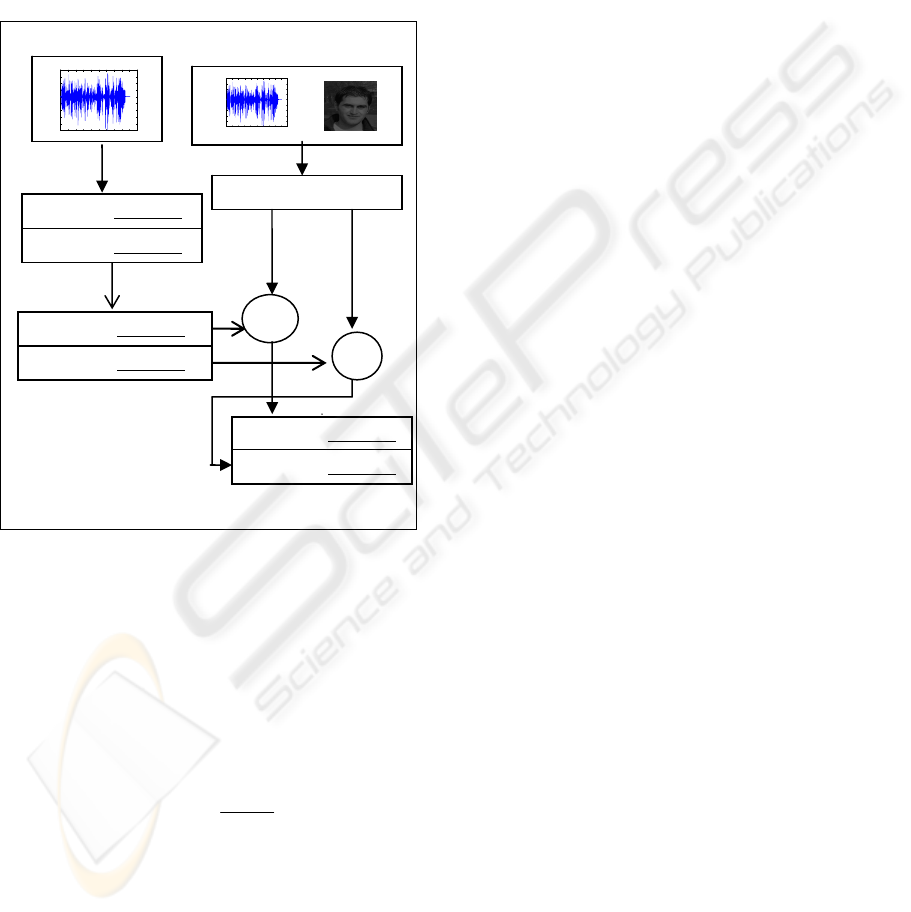
3.1.5 Recovering Hidden Message
3.1.5.1 Recovering the Hidden Signal
Step 1: Get rid of portions of the host signal that are
in the stego signal. To do this, we band pass filtering
the stego signal to above and below the hidden
message. Set the band to be the modulation
frequency (20 kHz) +/- the max embedded frequency
(3 kHz).
Step 2: Modulate the filtered message back down,
using a cosine signal with the same frequency as
before.
Step 3: Due to additive noise when we did the
addition and higher frequencies due to modulation,
we must low pass filter the demodulated message to
get rid of any extra chatter.
Then we have a signal which very closely resembles
the sent message (Figure 17).
3.1.5.2 Recovering the Hidden Image
Step 1: Modulate the message back down, using a
cosine wave with the same frequency used before, so
the obtained message will be in the correct frequency
range.
Step 2: Scale the message using Equation 5.
Step 3: Resample the image to get original signal
and reshape the data so it can be displayed (Figure
18).
(
)
qpxresampley ,,
=
: Resample the sequence in
vector x at p/q times the original sampling rate.
(
)
nmAreshapeB ,,
=
: Return the m-by-n matrix
B whose elements are taken column-wise from A.
Time
Frequency
0 10 20 30
0
0.5
1
1.5
2
x 10
4
Figure 17: Recovered Signal. Figure 18: Recovered
Image.
3.2 Hiding Data Inside WAV File in
Time Domain (Figure 19)
Using this approach the signal can be represented as
streams of bits. We can commandeer the least
significant bits to hold of our embedded message by
simply overwriting the data that was already there.
HIDING INFORMATION IN WAV-FILE - Implementation, Analysis and Evaluation
277
For CD quality sound, it is necessary to encode 16
bits per sample at a rate of 44.1 kHz. However,
sound can also be recorded at 8 bits per sample.
Since the majority of the sound signal is stored in
the M most significant bits of the sound code,
changing the lowest N significant bits, where N can
be any power of two up to M/2 bits, leaves the sound
signal somewhat changed in quality and definition,
but still recognizable, and often indistinguishable
from the original.
Figure 19: Block Diagram of Time Domain System.
Starting once again with two signals, a Host
signal and a Messages signal, we choose a value for
N, the number of least significant bits that we wish
to replace in the encoding, and choose an
appropriate length Host. The reason for choosing an
appropriate length Host is to make sure that the full
message can be encoded. Minimum required length
given by:
NPS
N
TBM
lengthHostMin ×
⎟
⎠
⎞
⎜
⎝
⎛
=__
(6)
Where:
• TBM: The total number of embedded bits in the
message.
• N: The number of bits to be replaced in the
host.
• NPS: The number of bits per sample.
The Base is allowed to be longer. In this
approach we use 2 methods to hide embedded data
inside WAV-file; steps below explain the details of
them. Note we use the same host signal and
embedded signal (Figure 5 & Figure 8) used before,
for testing this approach in both methods.
3.2.1 Method One
3.2.1.1 Preparing the Host Signal
Step 1: Convert the Host signal to stream of binary
bits. Usually the signals are represented as vectors of
decimal values between 1 and -1, in order to convert
them to binary number with 16 bits per sample, it is
necessary to follow the following steps:
• Add 1 to each number to make them all greater
than zero.
• Multiply the obtained vectors by 2^ (15) and
convert each one to a 16-bit binary number.
Step 2: Zero out the 8 least bits in host signal to hold
of our embedded message (Figure 21).
3.2.1.2 Preparing the Embedded Signal
Step 1: Convert the embedded signal to stream of
binary bits
• Adding 1 to each number to make them all
greater than zero.
• Multiply the obtained vectors by 2^ (15) and
convert each one to a 16-bit binary number.
Step 2: Convert the stream of 16 bits binary number
to stream of 8 bits binary number, to achieve this
form, split each 16 bits sample to two 8 bits samples
using:
For i=1 to length (msg)*2
(
)
15],[][ imsgansimsg
=
()
msg[i],8ightbitshift_R]1[
=
+
imsg
End
Step 3: Pad the end of encoded embedded signal
with zeros to make it as same length as Host. This
step is important in encoding because we can’t apply
arithmetic operation on vectors of different length
(Figure 20).
_msg),1)];length(enc-
rrier)th(filt_cazeros(leng [enc_msg; enc_msg
=
Host signal Embedded message
0 1 2 3 4 5 6 7 8 9 10
x 10
5
-1
-0.8
-0.6
-0.4
-0.2
0
0.2
0.4
0.6
0.8
Or
1011 0111 1010 1111
1111 1010 0001 0011
1111 0000 10101 1111
1011 0111 0000 0000
1111 1010 0000 0000
1011 0111 1111 0000
1111 1010 1010 0111
Zero out M/2 least
significant bits and place
the embedded message in
p
lace of the
m
+
+
0 1 2 3 4 5 6 7 8 9 10
-1
-0.8
-0.6
-0.4
-0.2
0
0.2
0.4
0.6
0.8
WEBIST 2006 - INTERNET TECHNOLOGY
278
Time
Frequency
sec ret mess age with zero end
0 5 10 15 20 25 30 35
0
0.5
1
1.5
2
x 10
4
Time
Frequency
0 10 20 30
0
0.5
1
1.5
2
x 10
4
Figure 20: Embedded
signal with zero end.
Figure 21: Host signal
after zero out 8 LSBs
.
3.2.1.3 Adding the Signals Together
Step 1: Combine prepared host signal with the
prepared embedded signal using:
._ msgcontainersignalfinal ⊕=
Step 2: Translate final signal back to vectors
between 1 and -1, in order to be heard by the
human's ears using:
()
.1152__
−
∧×= signalfinalsignalfinal
We get signal with the hidden message in it, which
is closed to host signal (Figure 22).
Time
Frequency
0 10 20 30
0
0.5
1
1.5
2
x 10
4
Figure 22:
Stego signal.
3.2.1.4 Recovering Hidden Message
Now we have the message signal hidden inside of
the Host signal, we need to come up with a way to
get message signal back. Assuming perfect
transmission, the recovery of our message signal is
quite simple.
Step 1: Convert the stego signal (Figure 23) to
stream of binary bits using the following steps
• Add 1 to each number to make them all greater
than zero.
• Multiply the obtained vectors by 2^ (15) and convert
each one to a 16-bits binary number.
Step 2: Go through every signal and concatenate the
N least significant bits of every received Host signal
into binary message signals of length B.
)15],1[
_(][][
).8],[_(_][
+
⊕=
=
jsignal
receivedbinAndimsgimsg
jsignalreceivedleftbinshiftimsg
Step 3: Covert these binary numbers back to decimal
and shift back down to 1 to -1 and we now have a
perfectly recovered message (Figure 24).
Time
Frequency
0 10 20 30
0
0.5
1
1.5
2
x 10
4
Time
Frequency
0 10 20 30
0
0.5
1
1.5
2
x 10
4
Figure 23: Stego signal. Figure 24: Recovered
signal.
3.2.2 Method Two
All operations in this method are same as the
operation in method one, just in this method we
increase the total amount of data that can be
embedded in host signal (length of embedded
message) two times longer than in method one,
which also means the required length of Host signal
is decreased half time.
NPS
N
TBM
lengthHostMin ×
⎟
⎠
⎞
⎜
⎝
⎛
=
2
__
(7)
Using this method we hide just the most
significant bits of embedded message in the least
significant bits of Host signal. Since the majority of
the sound signal is stored in the M most significant
bits of the sound code, we get signal with the hidden
message in it, which is closed to Host signal.
The following example show the required host
length to hide 16 bits message using both methods
discussed above:
Host signal
1100 1111 0101 0011 1111 0101 1111 0111
1111 1111 0000 0101
16 bits embedded signal
Host signal
1100 1111 0101 0011 1111 0101 1111 0111
1111 1111 0000 0101
16 bits embedded signal
0000 0000 11111 11111
16 bits embedded signal
Method 1: By applying Equation (6) minimum
required Host’s length is (16/8)*16 = 32 bits.
Method 2: By applying Equation (7) minimum required host’s
length (16/ (2*8))*16 = 16 bits.
HIDING INFORMATION IN WAV-FILE - Implementation, Analysis and Evaluation
279

Reconstruction the embedded signal is simply
done by adding 1 to received signal, converting
decimal to binary by multiplying by 2^ (15), and
finally shifting the result 8 bits to left. Then we get
signal, which is closed to embedded signal.
Table 1 shows the comparison between method 1
and method 2. Note that:
• TBM: total number of encoded bits in the
message,
• N: number of bits to be replaced in the host,
• NPS: number of bits in sample,
• TBC: total number of bits in the Host signal.
4 RESULTS
To test the Information hiding approaches in time
and frequency domains, we encoded different types
of embedded messages in Host signal in the both
domains. After completing experiments in both
domains, we found that signals of various qualities
can be used simultaneously, one for the host and one
for the message. We also discovered some of the
strengths and weaknesses of doing steganography in
each domain.
A few of the strengths of the frequency domain
are that the host only needs to have the same number
of samples as the message. This means that a longer
message can be hidden in a given base signal than in
the time domain (algorithm 1). Also, frequency
domain approach is easy to implement. Finally, the
frequency domain implementation is also much less
likely than the time domain to be affected by errors
that occur during transmission. On the down side,
this approach has a lot of distortion in the stego
signal. This includes an audible high-pitched cosine
that occurs from the modulation. Also, because of
the filtering that occurs, the message signal has a
limited frequency range and low recovery quality.
When steganography was implemented in the
time domain, we found that it had strengths and
weaknesses opposite of those in the frequency
domain. There was almost no distortion in the stego
signals if only a quarter of the base signal's bits were
used to hide the signal. But there is a little distortion
in embedded signal when we use algorithm 2. Also,
the message could be perfectly recovered and had
no frequency limitations. The disadvantages are that
the host signal needs to be longer than the message,
this is harder to implement. This approach is
extremely easy to corrupt during transmission. This
could be resolved by encoding the message using
hamming code to detect errors. If a hash table was
used to determine which samples had bits replaced,
this could be a very effective method for digital
watermarking. And the problem of host’s length is
solved by using method 2.
We encoded different images -my portraits as
example- inside WAV-signal. The first time there
was a large degree of loss in recovered image. We
decided to expand the image using Matlab’s
interpolation features so that there would be more
redundancy and the image came through very
clearly. This improves the quality of recovered
image, which is intelligible, but darker than the
original table 2 show the effect of interpolation.
5 CONCLUSION
After applying and studying approaches of hiding
information inside WAV-file, as well as touching on
the limitations and possibilities of each approach.
And based on our study, using WAV signal is good
candidate for embedding an acceptable amount of
data. Above algorithms for embedding data can
easily be implemented and do not visually degrade
the host signal to the point of being noticeable.
Table 1: Comparison between method one and method two.
Method 1 Method 2
Host length
NPS
N
TBM
×
⎟
⎠
⎞
⎜
⎝
⎛
NPS
N
TBM
×
⎟
⎠
⎞
⎜
⎝
⎛
2
Total number of bits that can be hidden
in the host.
N
NPS
TBC
×
⎟
⎠
⎞
⎜
⎝
⎛
N
NPS
TBC
2×
⎟
⎠
⎞
⎜
⎝
⎛
Distortion of combine signal Acceptable Acceptable
Simple Implementation Weakness strength
Quality of recover signal Better Good
WEBIST 2006 - INTERNET TECHNOLOGY
280
In order to prevent the detection of the
watermark by a user, a hashing algorithm and even
possibly some kind of encoding could be used.
When manufacturers produce CD writers, they could
include the decoder for the encoding method to
determine whether or not it can make copies of the
disk. Once the encoding algorithm is recognized by
the burner it could return a message to the user
stating that the disk is unburnable due to copyright
law.
Since the digital watermark would still be in
place if the users recorded the CD to their hard drive
they still could not burn the music to a CD. In order
for this to work completely, there must also be an
agreement with the makers of "CD-ripping"
software.
REFERENCES
Steven W. Smith, 1997.The Scientist and Engineer’s
Guide to Digital Signal Processing by California
Technical Publishing ISBN 0-9660176-3-3
http://www.dspguide.com/pdfbook.htm.
Wu, Min, Liu, Bede, 2003, Multimedia Data Hiding.
ISBN: 0-387-95426-0. Springer. New York, 1st
edition.
Lenti, Jozsef, 2000. Steganographic Methods. Budapest:
Budapest University of Technology and Economics,
Muhlbauer,
F. Hartung, J.K. Su, B. Girod: “Spread Spectrum
Watermarking: Malicious Attacks and
Counterattacks”, Proc. of SPIE, Security and
Watermarking of Multimedia Contents, vol. 3657,
Jan., 1999.
M. D. Lutovac, D. V. Tosic, B. Filter Design for Signal
Processing using MATLAB and Mathematic L. Evans
Prentice Hall, ISBN 0-201-36130-2.
V. V. Alexandrov, N. D. Gorsky, 1985, Image
Representation and Processing in Recursive Approach,
ISBN: 0-7923-2136-7 Kluwer Academic
F.A.P. Petitcolas, R.J. Anderson, M.G. Kuhn:
``Information Hiding - A Survey'', Proc. of IEEE,
pp.1062-1078, July, 1999.
F. Hartung, M. Kutter: ``Multimedia Watermarking
Techniques'', Proc. of IEEE, pp.1079-1107, July, 1999.
Lenti, Jozsef, 2000. Steganographic Methods. Budapest:
Budapest University of Technology and Economics,
Muhlbauer,
Swanson, 1996, Erik, et al, Steganography in
Signals.http://www.owlnet.rice.edu.
N.F. Johnson. Steganography and digital watermark –
information hiding.
http://www.jjtc.com/Steganography.
F.A.B. Petitcolas. The information hiding homepage -
digital watermarking and Steganography.
WWW:http://www.cl.cam.ac.uk/fapp2/steganography,
1997. University of Cambridge, Computer Laboratory,
Security
Table 2: Effect of interpolation on recovered messages.
Original Image Recovered Image after using interpolation
before hiding process
Recovered Image without using
interpolation before hiding process
HIDING INFORMATION IN WAV-FILE - Implementation, Analysis and Evaluation
281
