
MEASURES FOR ESTIMATING THE QUALITY OF
E-LEARNING MATERIALS IN THE DIDACTIC ASPECT
Alina Stasiecka
2
, Jacek Plodzien
1
, Ewa Stemposz
1,2
1)
Institute of Computer Science, Polish Academy of Sciences, ul. Ordona 21, Warsaw, Poland
2)
Polish-Japanese Institute of Information Technologies, ul. Koszykowa 86, Warsaw, Poland
Keywords: e-learning materials, questionnaire, didactic structure, overrepresentation maps.
Abstract: The paper presents our research on the structure of e-learning materials and its effect on their quality in the
didactic aspect. The research is based on a questionnaire and a statistical analysis of data collected through
this questionnaire from e-learners. During the analysis three theses were verified: (1) time can be used as a
partial measure for estimating the quality; (2) e-learning materials should follow the structure of good
traditional (paper) learning materials proposed by experts; (3) the set of features necessary to determine the
quality can be largely reduced.
1 INTRODUCTION
One of the basic aspects of learning materials is their
didactic structure determined, among other things,
by their parts/elements, the sizes of those elements,
etc. This is true both for traditional (paper) learning
materials and for e-learning (electronic) materials.
As practice shows, the didactic structure strongly
affects the quality of materials, both from the point
of view of teachers and of learners. Unfortunately,
even though the issue of quality is very important, in
our opinion it is still neglected in the e-learning area.
In this paper we discuss our recent research on
the didactic structure and its influence on the quality
of e-learning materials. We constructed a
questionnaire for collecting data from respondents
evaluating e-learning materials and performed a
statistical analysis of those data. During the analysis
we formulated and verified several theses; three of
them will be discussed in this paper: (1) time can be
used as a partial measure for estimating the quality;
(2) e-learning materials should follow the structure
of good traditional learning materials proposed by
experts; (3) the set of features necessary to
determine the quality can be largely reduced – as a
result we can create a sufficient set of those features.
The paper is organized as follows. In Section 2
we start with the description of the general structure
of materials and next we present the corresponding
structure of our questionnaire. In Section 3 we
discuss the statistical analysis of the data collected
through the questionnaire and verify the theses.
Section 4 concludes the paper.
2 DIDACTIC STRUCTURE OF
E-LEARNING MATERIALS –
QUESTIONNAIRE
In our research we employ the idea of the model of
effective learning presented in (Allesi & Trollip,
2001). In this model we define two levels of e-
learning material elements:
• level I for Introduction, Main content, Summary,
and Evaluation elements;
• level II for sub-elements (components) of the
level I elements.
Our questionnaire follows that definition. Below
we present the general structure of the questionnaire
along with some auxiliary questions for the
respondents (we formulated those questions to help
the respondents fill up the questionnaire). Each
element of the questionnaire is labeled with a unique
number; we will use those numbers later in the
paper. The elements are the following:
1. Introduction
1.1. Abstract and indication of key elements:
204
Stasiecka A., Plodzien J. and Stemposz E. (2006).
MEASURES FOR ESTIMATING THE QUALITY OF E-LEARNING MATERIALS IN THE DIDACTIC ASPECT.
In Proceedings of WEBIST 2006 - Second International Conference on Web Information Systems and Technologies - Society, e-Business and
e-Government / e-Learning, pages 204-212
DOI: 10.5220/0001252302040212
Copyright
c
SciTePress

• is the structure of the e-learning material clearly
presented?; are keywords included?; is the
abstract succinct?; is it clearly indicated how the
problems presented in the material are getting
more and more complex?
1.2. Focusing on the content:
• are the substantial elements of the material
described in a concise and interesting manner?
1.3. Motivating the learner to start using the
resource:
• is the usefulness of the new knowledge
indicated?; is the learner’s attention directed at
concepts necessary to understand the problem?;
are interesting examples included?; are there
elements that are supposed to arouse the
learner’s interest?; are there indications of how
the material can support the learner’s
(professional) career?
1.4. Definition of didactic objectives:
• are the topics of the material clearly presented?;
is the knowledge to acquire defined?; are there
indications of how the knowledge can be used in
practice?; is the competence level that the learner
will achieve indicated?
2. Main content
2.1. Base knowledge – prerequisites for the material:
• is the base knowledge (the prerequisites) clearly
defined?; can the learner’s base knowledge be
verified?; are the similarities and differences
between the base knowledge and the content
clearly indicated?
2.2. Support for knowledge acquiring:
• is the content properly ordered?; are there
practical examples?; is the main problem in the
content subdivided into isolated subproblems?;
are the main problem and the subproblems
presented in various contexts (situations)?
2.3. Directing the attention at the most important
elements of the content:
• are the key elements of the knowledge clearly
indicated in the material, for instance,
graphically?
2.4. Applying various teaching and learning
strategies:
• are there diagrams and other graphical tools?; are
there auxiliary questions?; are the problems
presented in various forms?; are there indications
of how the knowledge can be efficiently learnt?
2.5. Examples of applying new knowledge in
practice:
• are there indications of real contexts (situations)
in which the new knowledge can be used?
3. Summary
3.1. Recapitulation:
• are the key points of the content recapitulated?;
are there indications of how the knowledge can
be efficiently learnt and used?
3.2. Indicating opportunities for skills and
knowledge transfer to a new context:
• are there indications of how the acquired
knowledge can be used to solve similar problems
(in different contexts)?; is the practical use of the
knowledge emphasized?
3.3. Dictionary of key concepts:
• is there a list of the definitions of the concepts
together with references to the content?
3.4. Literature:
• is there a list of obligatory and additional
references (books, journals, www pages, etc)?
4. Evaluation
4.1. Self-evaluation:
• are there tests for the learner to self-evaluate?;
are there various kinds of tests, for instance: (1)
simulation: case studies, role playing, games,
guided analysis, etc.; (2) drill and practice: one-
choice questions, multiple-choice questions,
matching, jigsaw puzzles, open questions, etc.
4.2. Problem questions:
• are there problem questions for testing the new
knowledge (solutions to the problems, but in a
new context; evaluating other persons’ solutions;
rationale for the selected solution)?
4.3. Feedback:
• are there indications of how the learner can
contact the teacher (e.g., chat, e-mail)?; are there
feedback mechanisms for the learner?; are there
possibilities to inform the teacher about the
causes of problems in acquiring the knowledge,
for instance, lack of motivation, the structure of
the material, too difficult concepts, etc.
MEASURES FOR ESTIMATING THE QUALITY OF E-LEARNING MATERIALS IN THE DIDACTIC ASPECT
205

3 VERIFICATION OF THE
THESES
To verify the theses we performed a statistical
analysis of data with the program GradeStat based
on grade statistical methods (Kowalczyk et al.,
2004). The data to the analysis were collected
through our questionnaire. The respondents were
generally instructors and students of technical
universities; altogether they evaluated 56 e-learning
materials (they were given identification numbers
from 1 to 56).
The population of those materials was
augmented by a pattern material (its identification
number is 60). This pattern material is considered to
be ideal in the following sense:
• it possesses all the elements and sub-elements;
• all the elements are marked 5.0 (in our scale
from 0 to 5);
• the structure of the level I elements, in particular
their relative sizes, is that proposed by experts
such as (Allesi & Trollip, 2001).
Before starting the statistical analysis we verified
the data gathered through the questionnaire.
3.1 Data Verification
In order to verify the data from the respondents, we
compared the respondents’ subjective marks for the
materials as a whole with the statistical averages of
the respondents’ marks for the level II elements:
• For each level I element its average mark is
based on the respondents’ subjective marks for
the corresponding level II elements.
• Respectively, the average marks for the materials
as a whole are based on the average marks
calculated in the previous point.
• Absent level II elements were ignored when
calculating the average marks.
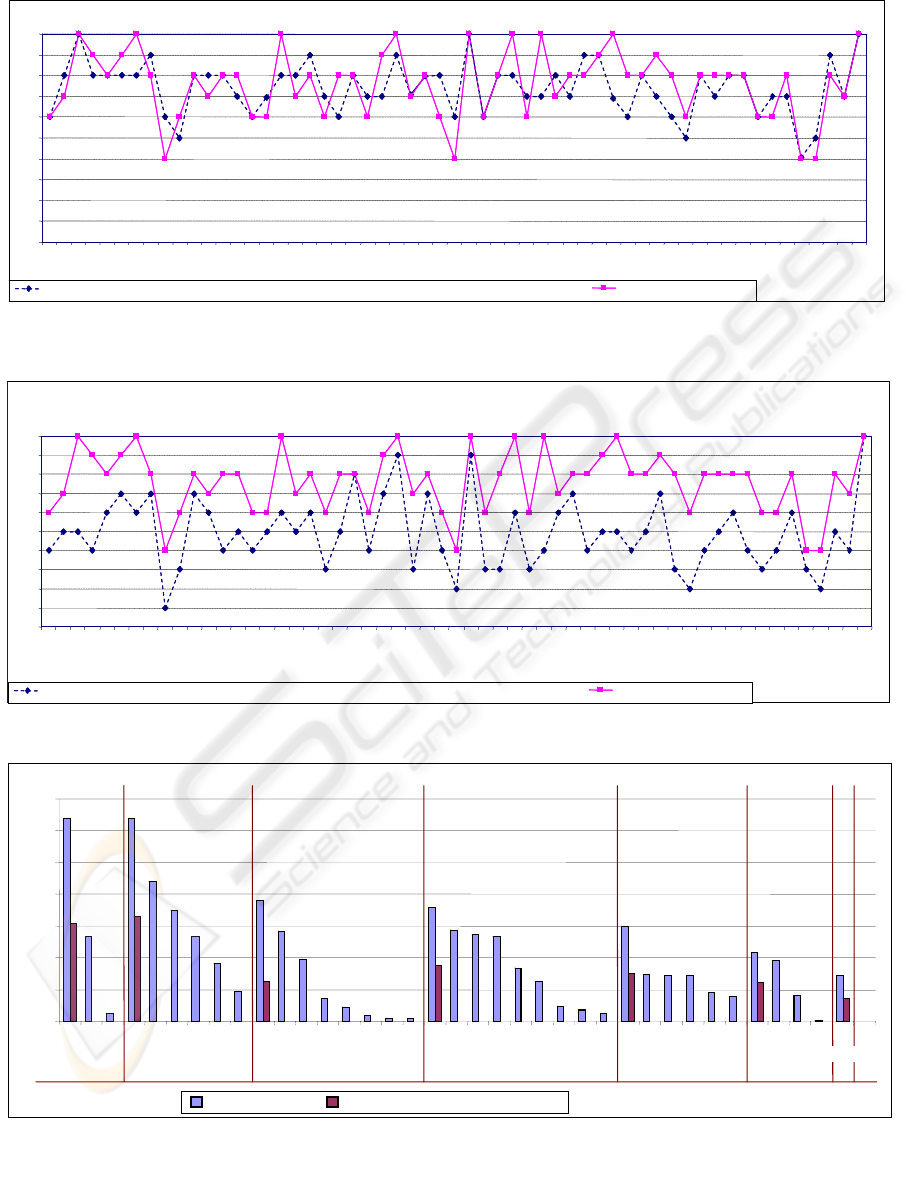
The results are illustrated in Figure 1, where the
OX axis is for the materials ordered by their
identification numbers, and the OY axis is for the
marks (from 0 to 5).
As we can see, the wholesome subjective and
average marks are very similar, probably because,
when establishing their subjective marks for the
materials as a whole, most respondents took into
consideration only the present level II elements,
intuitively estimating their average marks.
In the next step we dealt with the problem of
absent elements/marks: for level II elements missing
in the materials we entered the 0 mark. Next, for the
level I elements we calculated their average marks,
using all the level II elements (i.e., also those with
the entered 0 mark). The comparison of the
subjective marks for the materials as a whole and the
average marks calculated for all the level II elements
is shown in Figure 2.
This time, the difference between the subjective
and average marks is much bigger. Nevertheless,
there is still a similarity between those two kinds of
marks.
After having analyzed those charts we decided to
use in our further work the average marks based on
all the partial marks (i.e., including those with the
entered 0 mark) rather than the respondents’
subjective marks. The main rationale is that the
average marks seem to be much more credible,
because they also reflect the fact that some level II
elements are missing.
In the next step, after verifying the data and
entering the missing marks, we analyzed the
influence of the structure of the level I elements on
the quality of the materials.
3.2 Time of Working with Elements
as a Partial Measure for the
Quality
In this section we will verify the thesis that the
structure of level I elements with regard to the time
of working with those elements (in comparison to
the pattern material) can be used as a partial measure
of the quality of e-learning materials.
According to experts, the structure of a good
didactic material with regard to the relative sizes of
level I elements should be the following:
• Introduction – 10% of the whole material;
• Main content – 65% of the whole material;
• Summary – 15% of the whole material;
• Evaluation – 10% of the whole material.
For traditional (paper) materials it is easy to
determine this ratio by counting the number of
pages. However, in the case of e-learning materials,
which usually contain various kinds of multimedia
and interactive components, this method cannot be
employed. One of the solutions is to estimate the
time of working with each element compared to the
time of working with the material as a whole.
Hereinafter, we will refer to this ratio as time ratio.
WEBIST 2006 - E-LEARNING
206

To verify the thesis we used GradeStat for
constructing tables of ARs. AR is the name given in
(Kowalczyk et al., 2004) to the concentration index;
it has a representation as an area contained in the
unit square. AR’s value for a material determines the
extent to which the material is dissimilar to the
pattern material in the set of features. The greater the
|AR|, the greater the dissimilarity between those two
materials. For simplicity, from now on we use AR
instead of |AR|.
We performed this analysis on a subset of the
population – we considered 37 out of the 56
materials that were evaluated by the respondents
(because only for them the respondents estimated the
time ratio for the level I elements). The set of
features included 4 features for the time ratios of the
level I elements (i.e., Introduction, Main content,
Summary, and Evaluation). Figure 3 shows the chart
of ARs, where OX is for materials ordered by their
average marks, and OY is for the ARs.
In the figure we can see that the results are quite
different even in the same groups (i.e., for the same
marks), but there is a clear trend of descending
values of ARs for subsequent groups. We can
conclude that even though it is rather difficult to
estimate the time ratios for the level I elements in
the case of e-learning materials (consequently, such
ratios are not a perfect quality measure for e-
learning materials), the descending trend of the ARs
and the average ARs makes the ratios a good partial
measure of the quality of e-learning materials. So we
decided to replace the four time ratio features with
one time_AR feature that says how close the time
ratios for the level I elements of a given material are
to the corresponding time ratios of the pattern
material.
3.3 Influence of the Correct Didactic
Structure of an e-Learning
Material on its Quality
In this section we will deal with the thesis that
following the recommendations of traditional
(paper) learning materials experts (in particular,
keeping the structure of such materials) is beneficial
also in the case of e-learning materials, that is, it
improves their quality. Furthermore, the existence of
specific elements (identified by experts), the
assessment of the quality of each such element, and
the time ratio for the level I elements can be used as
partial measures for the quality.
To verify the thesis we analyzed three
populations of materials. The first population was
comprised of all the 56 materials evaluated by the
respondents. The multiplicity of the set of features
was 40: for each of the 20 elements analyzed in the
questionnaire we considered both its existence and
its mark (for the level II elements we considered
either the marks by the respondents or 0 if there was
no such mark; for the level I elements we considered
the average marks based on the respondents’
subjective marks for the level II elements). In this
part of our analysis we did not take into account the
time_AR feature, because the respondents estimated
the time ratios only for 37 materials.
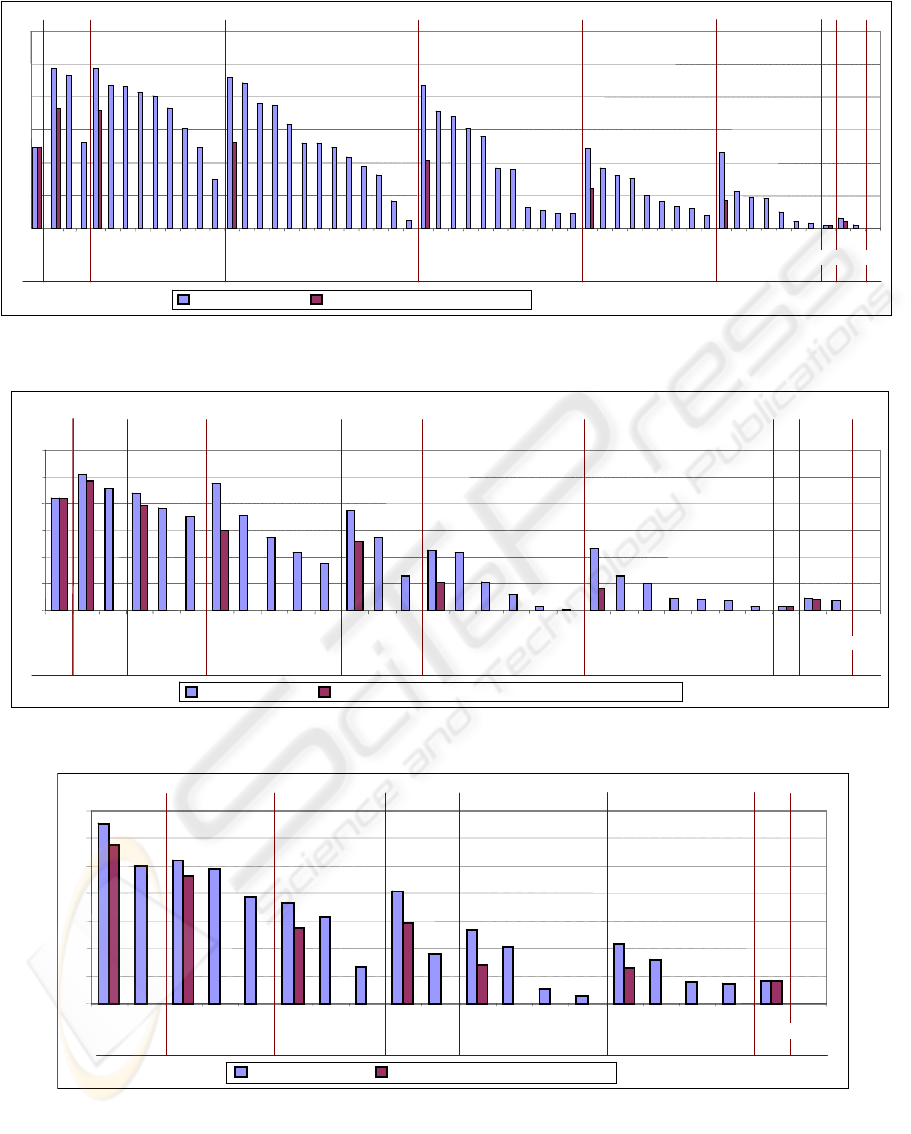
Figure 4 shows the ARs for this population,
where OX is for the identification numbers of the
materials that are ordered and grouped by their
average marks; OY is for the values of the ARs.
In the chart we can see a descending trend: the
smaller the average AR, the better the marks of a
given material. In each of the groups (for subsequent
average marks) we can clearly see that the results are
quite different – there are materials for which the
value of AR strongly deviates from the average
value in their group. Thus, in the next phase of our
analysis we took into consideration only those
materials for which the difference between their
average mark and their subjective mark is at most 2
standard deviations; there were 30 such materials.
We constructed this new population of materials and
computed ARs for it; the chart is in Figure 5.
As before, we can see a descending trend: the
smaller the average AR, the better the marks of a
given material, but this time the differences between
the results in each group are much smaller, probably
because the credibility of the data is greater. Hence,
we decided to increase the credibility even more by
constructing a population of only such materials for
which: (1) as before, the difference between their
average marks and their subjective marks was at
most 2 standard deviations; (2) the respondents
estimated the time ratios for the level I elements;
there were 20 such materials. The multiplicity of the
set of features was 41, because we augmented the
previous set with the time_AR feature. Figure 6
shows the chart of ARs for that population.
The charts in Figure 4, Figure 5, and Figure 6
prove the thesis that the structure of an e-learning
material has a strong effect on its quality. Therefore,
we conclude that the existence of specific elements,
the assessment of the quality of each such element,
and the time ratio for the level I elements can be
used as partial measures for the quality.
The next phase is to select a sufficient subset of
features that can be used to estimate the quality of e-
learning materials.
MEASURES FOR ESTIMATING THE QUALITY OF E-LEARNING MATERIALS IN THE DIDACTIC ASPECT
207
0,0
0,5
1,0
1,5
2,0
2,5
3,0
3,5
4,0
4,5
5,0
1
2
3
4
5
6
7
8
9
10
11
12
13
14
15
16
17
18
19
20
21
22
23
24
25
26
27
28
29
30
31
32
33
34
35
36
37
38
39
40
41
42
43
44
45
46
47
48
49
50
51
52
53
54
55
56
60
average mark based on the average marks of the level II elements
subjective mark
Mark
Material id
Figure 1: Subjective marks and average marks based only on the respondents’ marks for the level II elements (absent data are
not taken into consideration).
0
0,5
1,0
1,5
2,0
2,5
3,0
3,5
4,0
4,5
5,0
1
2
3
4
5
6
7
8
9
10
11
12
13
14
15
16
17
18
19
20
21
22
23
24
25
26
27
28
29
30
31
32
33
34
35
36
37
38
39
40
41
42
43
44
45
46
47
48
49
50
51
52
53
54
55
56
60
Mark
Material id
average mark based on the average marks of all the level II elements
subjective mark
Figure 2: Subjective marks and average marks based on all the level II elements (including those with the entered 0 mark).
AR
0.00
0.10
0.20
0.30
0.40
0.50
0.60
0.70
54 29 45 26 53 31 34 20 50 38 15 23 13 51 56 4 41 39 16 14 3 18 55 40 21 42 36 33 17 12 5 19 11 6 37 27 30 60
1.5 2.0
5.0
2.5
3.0
3.5
4.5
1.0
Marks for the
materials
values of ARs average ARs for particular marks
Material id
AR
0.00
0.10
0.20
0.30
0.40
0.50
0.60
0.70
54 29 45 26 53 31 34 20 50 38 15 23 13 51 56 4 41 39 16 14 3 18 55 40 21 42 36 33 17 12 5 19 11 6 37 27 30 60
1.5 2.0
5.0
2.5
3.0
3.5
4.5
1.0
Marks for the
materials
values of ARs average ARs for particular marks
Material id
Figure 3: ARs for the population of 37 materials (for which the respondents estimated the time ratios for the level I elements).
Figure 1: Subjective marks and average marks based only on the respondents’ marks for the level II elements (absent data
are not taken into consideration).
Figure 2: Subjective marks and average marks based on all the level II elements (including those with the entered 0 mark).
Figure 3: ARs for the population of 37 materials (for which the respondents estimated the time ratios for the level I
elements).
WEBIST 2006 - E-LEARNING
208
0
0.1
0.2
0.3
0.4
0.5
0.6
29
54
45
9
34
32
20
44
31
26
53
50
10
38
28
13
56
46
41
51
4
15
23
1
35
49
3
39
55
18
2
14
21
16
42
40
47
5
52
12
17
7
33
36
19
48
6
11
37
8
24
27
43
22
25
30
60
AR
1.0
1.5 2.0
5.04.0
2.5
3.0
3.5
4.5
0.5
Marks for the
materials
values of ARs
average ARs for particular marks
Material id
Figure 4: ARs for the population of 56 materials.
0
0.1
0.2
0.3
0.4
0.5
0.6
9542931535028
51 23 1 15 18 2 16 5 12 52 36 19 48 6 37 11
24 27 43 8 22 30 25 60
Marks for the
materials
0.5
1.5 2.0
5.0
4.0
2.5
3.0
3.5
4.5
1.0
AR
values of ARs average ARs for particular marks
Material id
0
0.1
0.2
0.3
0.4
0.5
0.6
9542931535028
51 23 1 15 18 2 16 5 12 52 36 19 48 6 37 11
24 27 43 8 22 30 25 60
Marks for the
materials
0.5
1.5 2.0
5.0
4.0
2.5
3.0
3.5
4.5
1.0
AR
values of ARs average ARs for particular marksvalues of ARs average ARs for particular marks
Material id
Figure 5: ARs for the population of 30 materials.
0
0,1
0,2
0,3
0,4
0,5
0,6
0,7
54
29
31 53
50 51
23
15 18
16 12
5
36
19
637
27
11
30
60
Marks for the
materials
1.5 2.0
5.0
2.5
3.0
3.5
4.5
1.0
AR
values of ARs average ARs for particular marks
Material id
Figure 6: ARs for the population of 20 materials.
Figure 4: ARs for the population of 56 materials.
Figure 5: ARs for the population of 30 materials.
Figure 6: ARs for the population of 20 materials.
MEASURES FOR ESTIMATING THE QUALITY OF E-LEARNING MATERIALS IN THE DIDACTIC ASPECT
209

3.4 Selecting a Sufficient Subset of
Features for Estimating the
Quality of e-Learning Materials
– Overrepresentation Maps
In this section we will deal with the following thesis:
from the set of features describing an e-learning
material we can select a sufficient subset that will
enable us to initially approximately assess the
quality of that material.
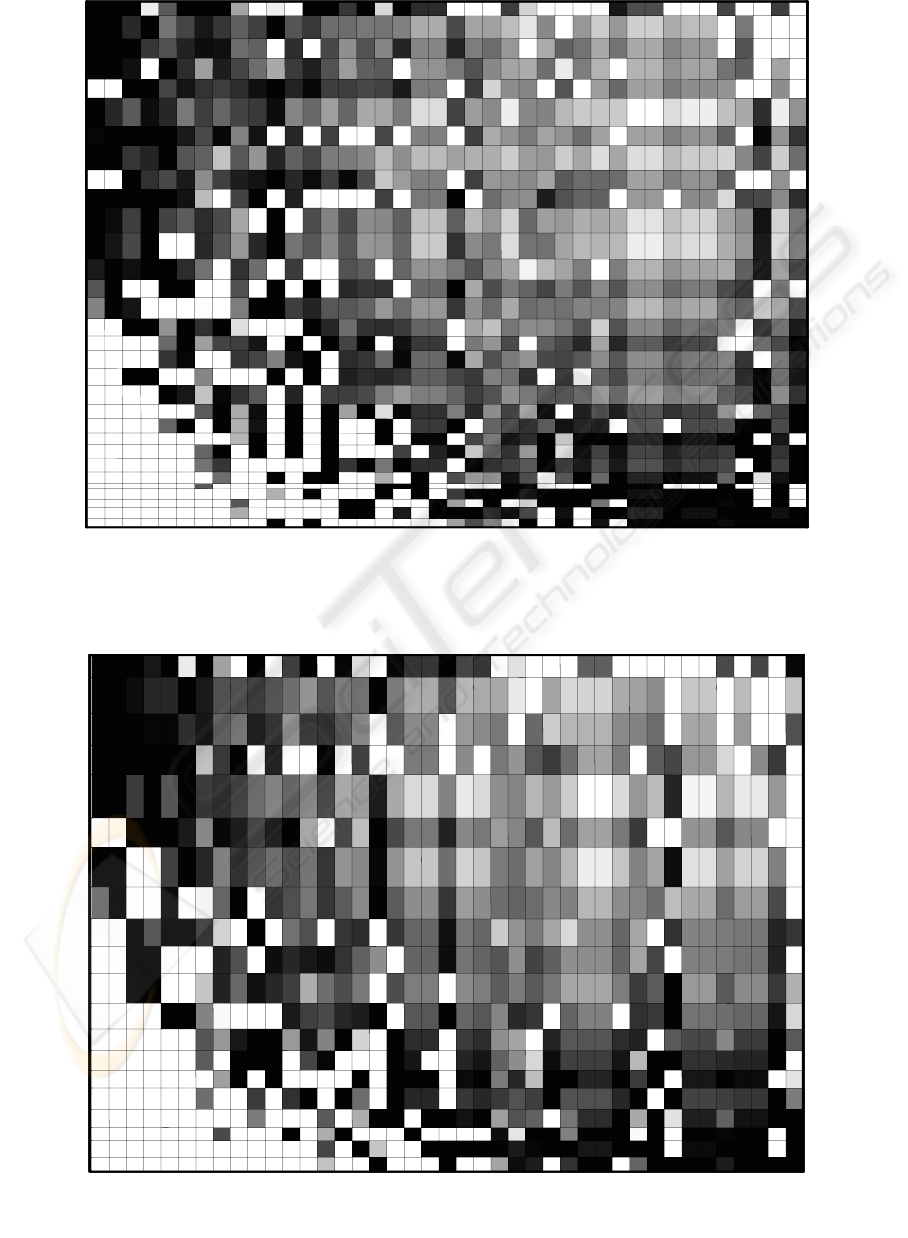
GradeStat offers a useful method for computing
and presenting dependencies among the elements of
a population and the features used to describe them –
it is the so-called overrepresentation map. Because
the overrepresentation map is presented in detail
e.g., in (Kowalczyk et al., 2004), in this paper we
will only give some general idea.
An overrepresentation map presents the
dependency between the elements of a given
population (the map’s rows) and the features
describing those elements (the map’s columns). In
our case, the rows are for materials and the columns
are for features (e.g., the marks for Introduction or
the existence of Summary). Both the heights of the
rows and the widths of the columns are usually
different for different rows and columns. The height
of a row depends on the evaluation of the weight of
the corresponding element in the entire population –
elements of higher evaluation are illustrated with
higher rows. If the global evaluation of a given
feature is higher, then the corresponding column is
wider. Similarly for the widths of the columns.
The fields of the map are rectangles illustrating
the elements of the population and their features;
those rectangles have various shades of gray. The
shade for a given field can be neutral, dark or light
if, correspondingly, the real value of the feature is
equal to, overrepresented or underrepresented with
regard to the value of that feature expected under
fair representation corresponding to the marginals.
When constructing an overrepresentation map,
GradeStat puts rows and columns in the following
manner: the left-most and the right-most columns
represent features that differentiate the elements of
the population to the most possible extent. If the set
of features is appropriately ordered and regular (i.e.,
if they differentiate the population well), the
overrepresentation map has the darkest fields close
to a line decreasing from top-left to bottom-right; the
farther from this line, the lighter the fields.
3.4 e
3.4
m
3.2
m
3.2 e
3 m
3.3
m
4.2
m
4.2 e
3.3 e
2.1
m
4.3 e
2.1 e
3.1
m
4 m
4.3
m
3 e
3.1 e
4.1 e
4.1
m
2.5
m
4 e
2.5 e
1.1
m
2 m
2 e
1.1 e
1 m
2.3 e
2.3
m
2.2
m
1.4
m
1 e
1.2
m
1.4 e
2.2 e
1.2 e
1.3
m
1.3 e
2.4
m
2.4 e
15 2.0
10 1.5
11 3.5
33 3.0
36 3.0
27 3.5
43 3.5
22 4.0
49 2.0
47 2.5
16 2.5
37 3.5
17 3.0
12 3.0
21 2.5
9 0.5
5 3.0
45 1.0
4 2.0
2 2.5
53 1.5
39 2.5
26 1.5
31 1.5
56 2.0
32 1.5
20 1.5
54 1.0
34 1.5
14 2.5
7 3.0
8 3.5
42 2.5
40 2.5
48 3.0
60 5.0
30 4.5
25 4.5
24 3.5
19 3.0
35 2.0
1 2.0
52 3.0
23 2.0
6 3.5
50 1.5
41 2.0
51 2.0
18 2.5
46 2.0
55 2.5
13 2.0
44 1.5
3 2.5
28 2.0
38 2.0
29 1.0
Figure 7: Overrepresentation map for the population of 56 materials.
3.4 e
3.4
m
3.2
m
3.2 e
3 m
3.3
m
4.2
m
4.2 e
3.3 e
2.1
m
4.3 e
2.1 e
3.1
m
4 m
4.3
m
3 e
3.1 e
4.1 e
4.1
m
2.5
m
4 e
2.5 e
1.1
m
2 m
2 e
1.1 e
1 m
2.3 e
2.3
m
2.2
m
1.4
m
1 e
1.2
m
1.4 e
2.2 e
1.2 e
1.3
m
1.3 e
2.4
m
2.4 e
15 2.0
10 1.5
11 3.5
33 3.0
36 3.0
27 3.5
43 3.5
22 4.0
49 2.0
47 2.5
16 2.5
37 3.5
17 3.0
12 3.0
21 2.5
9 0.5
5 3.0
45 1.0
4 2.0
2 2.5
53 1.5
39 2.5
26 1.5
31 1.5
56 2.0
32 1.5
20 1.5
54 1.0
34 1.5
14 2.5
7 3.0
8 3.5
42 2.5
40 2.5
48 3.0
60 5.0
30 4.5
25 4.5
24 3.5
19 3.0
35 2.0
1 2.0
52 3.0
23 2.0
6 3.5
50 1.5
41 2.0
51 2.0
18 2.5
46 2.0
55 2.5
13 2.0
44 1.5
3 2.5
28 2.0
38 2.0
29 1.0
Figure 7: Overrepresentation map for the population of 56 materials.
Figure 7: Overrepresentation map for the population of 56 materials.
WEBIST 2006 - E-LEARNING
210
3.2
m
3.2 e
3.4 e
3.4
m
4.3
m
4.3 e
3 m
3.3
m
4 m
4.2
m
2.1
m
4.2 e
2.1 e
3.3 e
4.1
m
4.1 e
2.5
m
3.1
m
2.5 e
4 e
1.3
m
1.1
m
1 m
3 e
2 m
1.2
m
1.4
m
1.2 e
2.3
m
3.1 e
2.3 e
2 e
1.1 e
1.4 e
1 e
2.2
m
1.3 e
2.4
m
2.2 e
2.4 e
15 2.0
36 3.0
8 3.5
48 3.0
27 3.5
25 4.5
24 3.5
37 3.5
1 2.0
12 3.0
23 2.0
50 1.5
18 2.5
9 0.5
29 1.0
54 1.0
11 3.5
43 3.5
60 5.0
22 4.0
19 3.0
30 4.5
52 3.0
16 2.5
5 3.0
6 3.5
2 2.5
51 2.0
53 1.5
31 1.5
28 2.0
Figure 8: Overrepresentation map for the population of 30 materials.
3.2
m
3.2 e
3.4 e
3.4
m
4.3
m
4.3 e
3 m
3.3
m
4 m
4.2
m
2.1
m
4.2 e
2.1 e
3.3 e
4.1
m
4.1 e
2.5
m
3.1
m
2.5 e
4 e
1.3
m
1.1
m
1 m
3 e
2 m
1.2
m
1.4
m
1.2 e
2.3
m
3.1 e
2.3 e
2 e
1.1 e
1.4 e
1 e
2.2
m
1.3 e
2.4
m
2.2 e
2.4 e
15 2.0
36 3.0
8 3.5
48 3.0
27 3.5
25 4.5
24 3.5
37 3.5
1 2.0
12 3.0
23 2.0
50 1.5
18 2.5
9 0.5
29 1.0
54 1.0
11 3.5
43 3.5
60 5.0
22 4.0
19 3.0
30 4.5
52 3.0
16 2.5
5 3.0
6 3.5
2 2.5
51 2.0
53 1.5
31 1.5
28 2.0
Figure 8: Overrepresentation map for the population of 30 materials.
3.2 m
3.2 e
4.3 e
4.3 m
3.4 e
3.4 m
3m
4m
4.2 m
3.3 m
4.2 e
4.1 m
3.1 m
1.3 m
4.1 e
2.5 m
2.1 m
3.3 e
4e
2.5 e
2.1 e
3e
3.1 e
1m
2m
1.4 m
1.2 m
2.3 m
2e
2.3 e
1.2 e
1.1 m
1.3 e
2.4 m
1e
1.4 e
2.2 m
1.1 e
2.2 e
2.4 e
ti me_A
R
15 2.0
11 3.5
36 3.0
19 3.0
60 5.0
27 3.5
30 4.5
37 3.5
16 2.5
53.0
63.5
12 3.0
23 2.0
51 2.0
50 1.5
18 2.5
53 1.5
29 1.0
31 1.5
54 1.0
Figure 9: Overrepresentation map for the population of 20 materials.
3.2 m
3.2 e
4.3 e
4.3 m
3.4 e
3.4 m
3m
4m
4.2 m
3.3 m
4.2 e
4.1 m
3.1 m
1.3 m
4.1 e
2.5 m
2.1 m
3.3 e
4e
2.5 e
2.1 e
3e
3.1 e
1m
2m
1.4 m
1.2 m
2.3 m
2e
2.3 e
1.2 e
1.1 m
1.3 e
2.4 m
1e
1.4 e
2.2 m
1.1 e
2.2 e
2.4 e
ti me_A
R
15 2.0
11 3.5
36 3.0
19 3.0
60 5.0
27 3.5
30 4.5
37 3.5
16 2.5
53.0
63.5
12 3.0
23 2.0
51 2.0
50 1.5
18 2.5
53 1.5
29 1.0
31 1.5
54 1.0
Figure 9: Overrepresentation map for the population of 20 materials.
Figure 8: Overrepresentation map for the population of 30 materials.
Figure 9: Overrepresentation map for the population of 20 materials.
MEASURES FOR ESTIMATING THE QUALITY OF E-LEARNING MATERIALS IN THE DIDACTIC ASPECT
211

In order to verify the third of our theses we
constructed overrepresentation maps for the three
populations described in the previous section; the
maps are in Figure 7, Figure 8, and Figure 9. The
rows of the maps are labeled with pairs (material
identification number, material average mark). The
columns are labeled with the elements of the set of
features (40 features for the first and second
populations and additionally time_AR for the third
population). The labels include the numbers of the
successive parts of the questionnaire (see Section 2);
the e suffix denotes the feature’s existence in the
material and the m suffix denotes the mark given to
that feature by the respondent.
We can see on the maps an interesting order of
the materials and the features. The upper rows are
wider and symbolize mostly good materials; the
lower rows are narrower and symbolize mostly bad
materials. Analyzing the features based on which the
differentiation was made (the left-most and right-
most columns) we can indicate subsets of features
that can be used to differentiate good materials from
bad ones:
• For the first population: 3.4 (Literature), 3.2
(Indicating opportunities for skills and
knowledge transfer to a new context), 3
(Summary), 3.3 (Dictionary of key concepts), and
4.2 (Problem questions).
• For the second population: 3.2 (Indicating
opportunities for skills and knowledge transfer to
a new context), 3.4 (Literature), and 4.3
(Feedback).
• For the third population: 3.2 (Indicating
opportunities for skills and knowledge transfer to
a new context), 4.3 (Feedback), and 3.4
(Literature).
The results prove that it is possible to identify a
sufficient subset of the features that allow for the
initial approximate assessment of the quality of e-
learning materials. In other words, if such features
exist in a given material and are marked as good,
then statistically we can conclude that the remaining
elements of the material are also good.
4 CONCLUSIONS
In the paper we have discussed how the structure of
e-learning materials can affect their quality. We
presented our questionnaire for gathering data from
e-learners and performed a statistical analysis of
those data. Through the analysis we verified and
proved three theses. First, the existence of specific
elements (identified by experts), the assessment of
the quality of each such element, and the time ratio
for the level I elements can be used as partial
measures for the quality. Second, e-learning
materials should follow the structure of good
traditional learning materials proposed by experts
because it improves their quality. Finally, the set of
features describing an e-learning material can be
reduced to a sufficient subset that allows for the
initial approximate assessment of the quality of that
material. This set includes for instance the following
elements: 3 (Summary), 3.2 (Indicating
opportunities for skills and knowledge transfer to a
new context), 3.3 (Dictionary of key concepts), 3.4
(Literature), 4.2 (Problem questions), and 4.3
(Feedback).
Certainly, there are also other (non-didactic)
factors affecting the quality of e-learning materials.
To analyze those factors we have developed a new,
extended version of our questionnaire; we plan to
collect new data through this questionnaire and
perform new statistical analyses.
ACKNOWLEDGEMENTS
This study was partially sponsored from a grant
awarded by the Ministry of Education and Science
(number 3 T11C 053 28) of Poland.
REFERENCES
Kowalczyk T., Pleszczynska E., Ruland F. (Eds.), 2004.
Grade Models and Methods for Data Analysis, With
Applications for the Analysis of Data Populations,
Studies in Fuzziness and Soft Computing, Vol. 151,
477 pages, Springer Verlag Berlin Heidelberg New
York.
GradeStat, 2006. Program for Grade Data Analysis.
http://gradestat.ipipan.waw.pl/
Allesi, S.M. & Trollip, S.R., 2001. Multimedia for
Learning: Methods and Development, Needham
Heights, MA: Allyn and Bacon.
WEBIST 2006 - E-LEARNING
212
