
DESIGN GUIDELINES FOR E-LEARNING SYSTEMS
Daniela Zambarbieri, Carlo Robino, Sofia Crespi, Licia Calvi
*
Dept. of Computer and Systems Science, University of Pavia, Via Ferrata 1, 27100 Pavia, Italy
A. Marco Luccini
Giunti Interactive Labs, Via Portobello, Abbazia dell’Annunziata, 16039 Sestri Levante (GE), Italy
Keywords: E-learning, usability, eye movements.
Abstract: The effectiveness of an e-learning system of actually transferring knowledge to the users is strictly related to
its level of functionality and usability. Evaluation is usually performed through methods that are mainly
subjective and qualitative. A new evaluation methodology has been developed within the European IST
Project E-TRACKING which is based on the analysis of exploration eye movements made by the subjects
during interaction with e-learning systems. Thus the methodology has the main characteristics to be
objective and quantitative. This methodology has been applied to the evaluation of three e-learning systems
by examining a wide population of subjects. Quantitative results derived from eye movement analysis have
been further processed by statistical methods and the results have been used to identify a number of
guidelines related to browsing and page layout aspects. These guidelines are aimed at the development of e-
learning systems optimized in terms of usability and functionality. Guidelines have been implemented
within the same e-learning material used for the experimentation and further validated through eye
movement analysis.
*
Present address: Centre for Usability Research, Ka-
tholieke Universiteit Leuven, Belgium
1 INTRODUCTION
In the framework of the European Project E-
TRACKING (IST 2001-32323), guidelines were
derived to foster the better design of e-learning
systems. The use of guidelines is indeed very
common in many different fields that spread from
diagnostic and therapy in medical care to check-list
control in airplanes before taking off, just to mention
a couple of examples. Also IT has seen a
proliferation of guidelines, but they have mainly
focused either on usability in general (Nielsen, 1983;
Carrol, 2000; Clark and Mayer 2003; Koyani et al.,
2003) or on accessibility (W3C’s Web Accessibility
Initiative). Only in a limited part, the guidelines
developed so far have been dealing with e-learning
and, within this more specialized field, with the
issue of fostering e-learning system design.
Our starting assumption was that e-learning
systems need to be usable, acceptable and functional
if they have to help users appropriately acquire
knowledge. A number of techniques and
methodologies already exist to measure the system
degree of acceptability, functionality and usability
(Rubin, 1994). Most of them, such as questionnaires,
user tests, (cognitive) walkthroughs and usability
inspection
are qualitative, in the sense that they rely
on the user’s or the experiment’s subjective
evaluation. They focus on the how rather than on the
what.
The E-TRACKING project has instead been
focusing on the what-aspect of the problem.
Therefore, it has developed a methodology based on
the analysis of the user’s eye movement during
interaction with an e-learning system. Thus this
methodology is objective and quantitative.
Eye movements are indeed needed to shift the
gaze from one part to another of the visual scene the
subject is exploring. They can therefore provide cues
on where the subject is looking at and for how long
392
Zambarbieri D., Robino C., Crespi S., Calvi L. and Marco Luccini A. (2006).
DESIGN GUIDELINES FOR E-LEARNING SYSTEMS.
In Proceedings of WEBIST 2006 - Second International Conference on Web Information Systems and Technologies - Society, e-Business and
e-Government / e-Learning, pages 392-397
DOI: 10.5220/0001244203920397
Copyright
c
SciTePress

his/her gaze remains on a specific part of the scene
(in our case, the user interface). The subject’s
exploration behaviour consequently has a direct and
significant influence on the level of learning attained
by the subject: since visual information can only be
acquired when the image of the object of interest
falls onto the fovea, the information included in the
part of the screen that is not explored can not be
acquired by the subject at all. In this sense, eye
movements are extremely informative in
emphasising what would be the best location on the
interface to put important information.
2 EYE TRACKING TECHNIQUE
Eye movements are recorded by the EyeGaze system
(LC Technologies), a video-oculographic device that
consists of a CCD camera mounted below the
computer display. A small, low power, infrared light
emitting diode (LED) located at the centre of the
camera lens illuminates the eye. The LED generates
the corneal reflection and causes the bright pupil
effect which enhances the camera’s image of the
pupil. Specialized image-processing software
identifies and locates the centres of both the pupil
and the corneal reflection and projects gaze position
within the video image.
3 METHODOLOGY
The methodology that has been developed to derive
e-learning guidelines is based on the analysis of eye
movements during subjects’ interaction with e-
learning systems.
Three test-bed scenarios were developed both to
define and to validate this methodology, and they
will be referred to as Case Studies in what follows.
The Case Studies cover different knowledge
domains such as foreign language learning, a
collection of Kipling’s poems as an example of the
cultural heritage domain, and a descriptive statistic
course for the technical issues domain. Their
structures include a linear, a hierarchical, and a
network architecture.
A population of 160 subjects have been
examined during the experimental phase of the E-
TRACKING project. During data acquisition also
other interactions of the subject with the computer
are recorded, such as mouse clicks and keyboard
strokes, and the capture of the pages that the user is
exploring to maintain a correspondence between the
eye movement data and the object that has produced
these movements, thus taking into account page
scrolling. The subject navigates within the Case
Study completely free or following a specific task. A
pre-learning questionnaire is used to control the
level of expertise of the subject within the specific
topic of the Case Study, and a post-learning
questionnaire is used to verify the level of learning
reached after the navigation within the Case Study.
The first step in data analysis is the
reconstruction of the user’s scanpath. For each page,
regions of interest (RoIs) are defined (Figure 1). A
region of interest is a part of the page that contains
visual or content-related information particularly
salient and interesting for the comprehension or that
can attract the subject’s attention. The analysis of
eye movements computes quantitative parameters
for the whole page and for each RoI (
Goldberg,
Schryver, 1995, Goldberg, Kotval, 1998). Permanence
time, mean fixation duration and number of fixations
are temporal measures that can indicate which are
the centres of interest within the page and whether
difficulties have been encountered by the subject
during the identification and the integration of
information. The length of the scanpath and the
sequence of accesses to different zones within the
page are spatial measures, linked primarily to
geometrical and structural characteristics of the
interface. Spatial measures can thus reflect visual
difficulties or attention problems.
Statistical analysis has been conducted on the
previously mentioned dependent variables in order
to verify the following experimental hypotheses: the
existence of a significant difference in terms of eye
movements parameters between the two groups of
experimental subjects characterised by different
tasks (i.e., learning-to-do vs learning-to-recall), and
among homogeneous pages in the e-learning course.
Within-page analysis considers the behaviour of
subjects belonging to different groups for each page
and for each RoI. Significant statistical differences
should demonstrate the influence of the tasks given
to the subjects on their learning behaviour.
Between-pages analysis takes into account the
non-homogeneity of the different pages comparing
pages and RoIs with similar structure among them.
Correlation analysis verifies how strictly two
selected variables vary accordingly, thus expressing
the degree of their linear relationship.
Finally, linear regression analysis expresses the
linear relationship among the selected variables by
the computation of the slope and the intercept of the
best fit regression line.
DESIGN GUIDELINES FOR E-LEARNING SYSTEMS
393
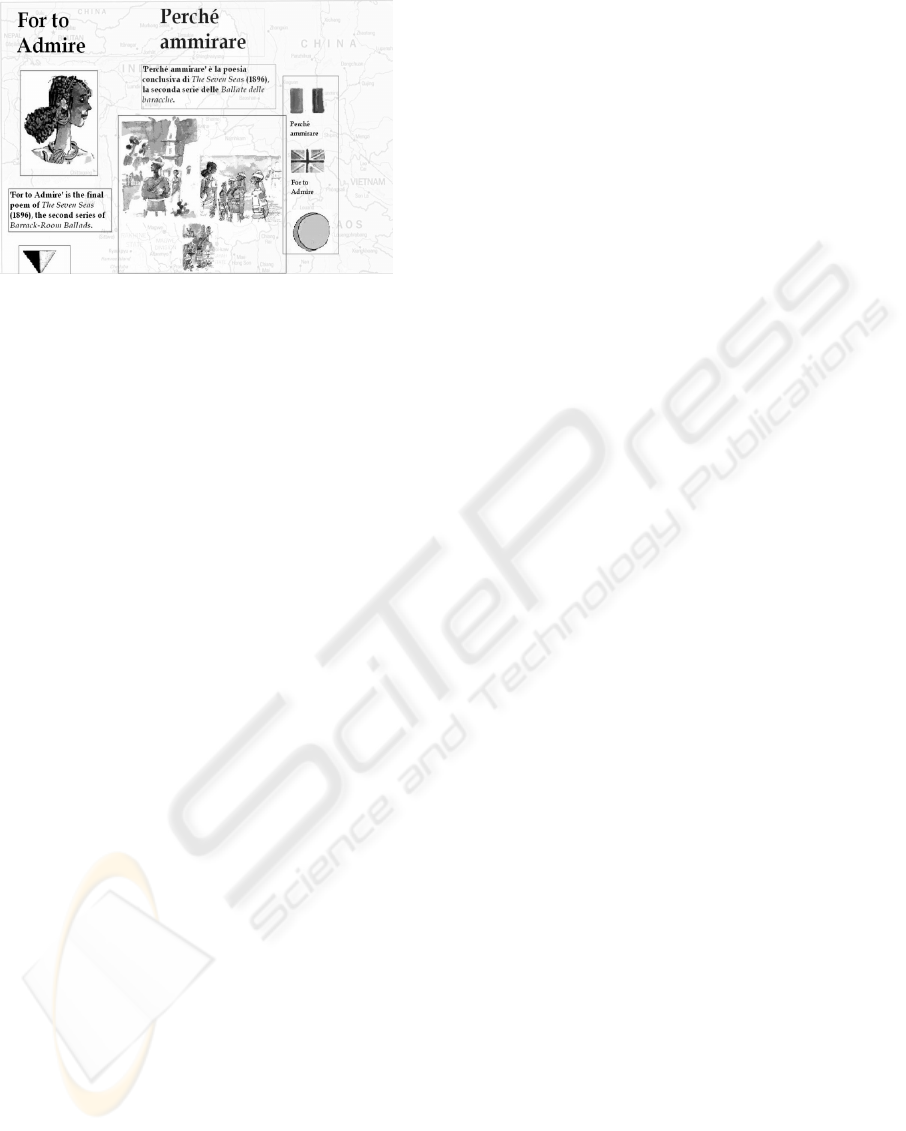
Figure 1: An example of page with identification of
regions of interest (RoI).
The development and validation of this new
methodology has two main outcomes. First, it
provides a simple test for the evaluation of e-
learning systems from the user’s point of view;
second, from the results of the experimental part of
the project, guidelines are constructed for the
development of “optimal” e-learning systems.
4 E-TRACKING GUIDELINES
Guidelines have been derived from the statistical
analyses of the experimental results. They represent
recommendations for the development of e-learning
courses improved in terms of usability and
functionality. Two typologies of guidelines have
been identified. The first one concerns navigation or
browsing through the material, the second one gives
suggestions about the organization of the page
layout.
In this Section guidelines are described by giving
an issue definition to better explain what captured by
the title, followed by the guideline text itself. The
fully detailed description of the E-TRACKING
guidelines with the experimental evidence
supporting them is available on the project web site:
http://e-tracking.unipv.it.
4.1 Navigation Guidelines
Information Architecture
This guideline is necessary to determine which
course organization to adopt. Although this choice
strictly depends on the nature of the content, this
issue is fundamental because it influences users’
navigation and their consequent learning.
1. Make sure that the course plan reflects the course
material organization.
2. Nodes should represent real turning points in the
learning development.
Course plan representation for hierarchical and
graph-connected courses
Hierarchical and graph-connected courses represent
a very special case of course organization since
users can more easily get lost and may have a lower
content comprehension because of this complex
node-and-link structure. In these courses, therefore,
the availability of a well-defined course plan can
make the difference in users’ learning.
1. The course plan should be always available.
2. Make sure that the course plan clearly reflects
the course structure.
3. The course plan in the index page should be
condensed in order to show the first levels of
the structure only.
4. Wording of the course plan items should be
accurate.
5. The course plan itself should be placed in a
prominent position within the index page.
6. Whenever the course plan or part of it is
replicated within the course, all instances should
follow the same pattern set in the index page.
7. The index page should be placed in a prominent
position within the course.
8. The Table of Contents (TOC) should clearly
reflect course structure.
9. The TOC in the index page should be
condensed in order to show the first levels of
the structure only.
10. Wording of TOC should be accurate.
11. The TOC itself should be placed in a prominent
position within the index page.
12. Whenever the TOC or part of it is replicated
within the course, all instances should follow
the same pattern set in the index page.
13. Hierarchical courses with a linear navigation
path should have a direct link (visible and easily
accessible) to course first topic.
Navigation menu tree
The navigation menu tree is the best way of
representing a course plan and of guaranteeing a
quick and easy access to it as a way to improve
users’ confidence in their own learning path
awareness and progress.
1. The Navigation menu tree should be placed in a
fixed and well defined position in the page
structure.
2. The navigation menu tree should be clearly
visible and easy to be accessed.
WEBIST 2006 - E-LEARNING
394

3. Users’ current position in the course structure
should be clearly visible.
4. The navigation menu should be always
available.
Navigation Links
Links, whether textual or symbolic, are essential in
navigating an e-learning course as well as any
hypertextual and / or interactive product. Their
effectiveness can therefore affect course
comprehension.
1. Links should be visible, identifiable and easily
accessible.
2. Links should be readable.
3. Links should be effective.
4. Links must not be confusing.
The introductory page and the summary page for
hierarchical courses
Introductory and summary pages are always useful,
especially for hierarchically highly structured
courses with several nested levels of in-depths, as
they help users get a first general idea (in the case of
introductory pages) of the overall course or draw the
necessary connections among material and review
own learning progress (in the case of summary
pages).
1. The exact positioning of the introductory page
in the courseware should be justified by actual
learning needs.
2. The title of the page should clearly reflect the
summarized course content.
3. The introductory and summary pages should
have the same layout and content format.
4. The introductory page textual content should
clearly summarise the part of the course
depending on it.
5. The summary page textual content should
clearly and concisely recap the part of the
course it is stemming from.
Help
The presence of a menu or of a page explaining the
meaning of the elements used to navigate within the
e-learning course may be useful to help users to
understand the functionalities of the navigational
tools before starting to use the system.
1. Design carefully the help tool.
2. The help tool should be always visible and easy
to access.
3. Symbols associated to the help tool should be
clear and self-explanatory.
4. It could be useful to make the help menu
accessible before the course is started.
4.2 Layout Guidelines
Page layout
Page layout and elements position in a page have an
influence on subjects’ explorative behaviour.
1. Decide what the most relevant element in the
page (the ‘eye catcher’) is.
2. The ‘eye catcher’ should be visible and easily
accessible.
3. The page layout should be maintained through
homogeneous content pages.
Building the lesson page for hierarchical courses
In hierarchically structured e-learning courses, page
layout and format play a key role for users’
comprehension due to their more complex structure.
1. Pages containing informational content should
be easy to identify and access.
2. Page structure has to be clearly defined and set-
up.
3. Page title should be clearly visible and
identified.
4. Overall course plan should be available and
easily accessible.
5. In courses that can be navigated linearly the
lesson page should have direct links (visible and
easily accessible) to course following, previous
and parent topics.
6. Content should be easy to identify and access.
Building the example page
Example pages are very useful for a better course
comprehension. They support the user and provide
some useful in-depths.
1. The example should be effective.
2. The example should be visible and easily
accessible.
3. The page title should clearly reflect the example
page content.
4. The example page content format and layout
should be coherent to the lesson page content
ones.
5. In courses that can be navigated linearly the
example page should have direct links (visible
and easily accessible) to course following,
previous and parent topics (backward, upward
and towards closely-related examples).
Images structure
Images are very important elements in an e-learning
course, and greatly support users’ comprehension
and learning. The structure of an image influences
subjects’ behaviour, and helps to capture subjects’
attention.
1. Choose the image carefully.
2. The image should be visible and easily
accessible.
DESIGN GUIDELINES FOR E-LEARNING SYSTEMS
395
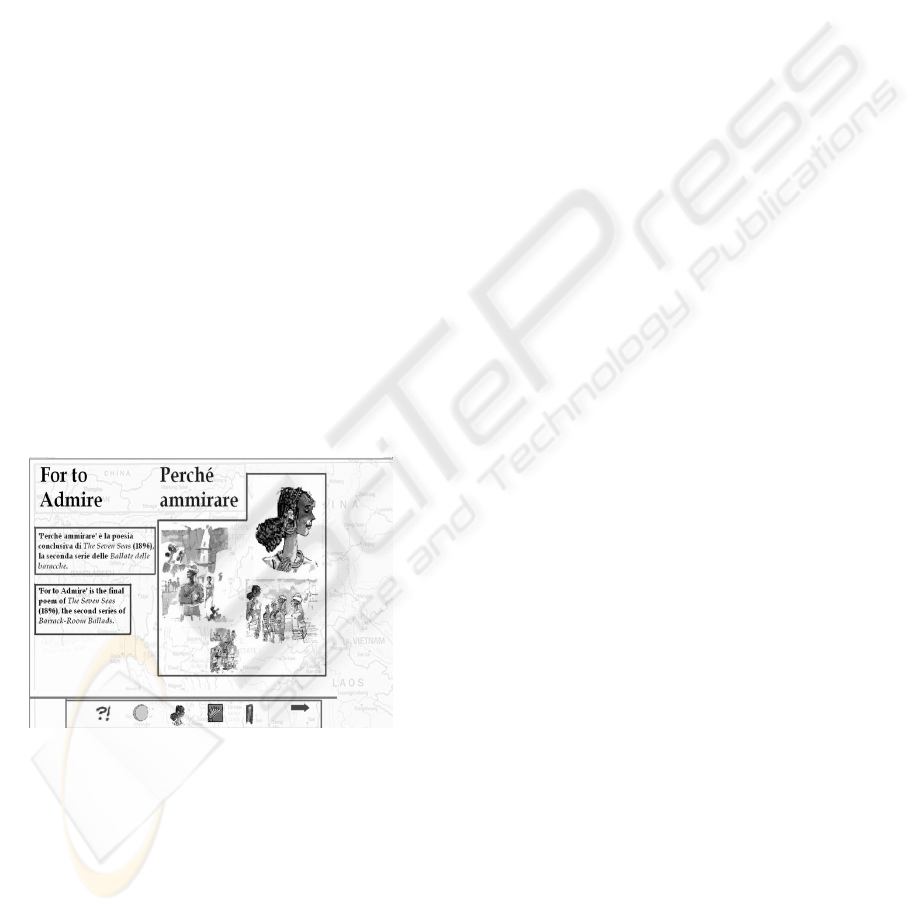
Image captions
Image captions can be a useful support for providing
users more informative content or to explain / detail
image content.
1. Captions should be appropriate.
2. Captions should be informative and salient.
3. Captions should be readable and easily
comprehensible.
Page size and delivery media
Content segmentation is a key issue in building e-
learning courses. The most important factors to be
taken into account are the page size available and the
delivery media to be used. Both have a strong
influence on each other.
1. Scrolling should be preferably avoided.
2. Big content chunks should be split into smaller
‘units’ whenever possible.
3. The content ‘units’ size should fit the displaying
requirements of the delivery device.
Symbols
Symbols are used for several purposes. Usually they
represent navigation elements (such as links) or
shortcuts to supporting tools (for triggering tasks
like printing or starting a collaborative work
session). Their comprehensibility is a key issue that
can greatly affect users learning performance.
1. Symbols should be visible, identifiable and
easily accessible.
2. Links should be effective and meaningful.
5 GUIDELINES VALIDATION
Where a mismatch between the Case Studies and the
guidelines was found, or when the statistical
analyses pointed out users’ difficulty to understand
and to learn the domain content, the Case Study has
been modified by implementing the appropriate
guidelines. As an example some results of validation
are reported concerning the implementation of the
following guidelines:
- Introduction of a navigation bar grouping all
links available for the navigation through the
material
- Suppression of scrolling
- Improvements in the comprehension of the
navigation links
- Changes in pages’ layout in order to maintain the
homogeneity among pages with the same
content.
In Figure 2 it can be observed that all links have
been grouped at the bottom of the page and that
figures and texts are organised in different sections
of the page. This layout is maintained throughout all
the hypertext.
Then, a further experimental phase has been
executed to verify the improvements of the e-
learning systems in terms of subjects’ behaviour and
learning level. A significant reduction in the
permanence time within the page, and in the number
of fixations has been found. Also mean fixation
duration is reduced from 280 to 237 msec.
For the “optimized” Case Studies, statistical
indexes show that a considerable amount of data
meets the requirement of a normal distribution,
differing from the previous version of the Case
Studies. This result could be considered as a first
suggestion that the modifications introduced by
applying the guidelines have produced less biased
data. The increased layout’s homogeneity obtained
by the insertion of the Navigation Bar and by the
separation of text and images has influenced
subjects’ navigation behaviour. The rigorous
material’s organisation let subjects develop a similar
way of interaction with the different pages and RoIs
as indicated by the values of the mean fixation time.
Finally, the correlation analysis results seem to
highlight that the Case Study modifications have
increased the homogeneity of the pages’
organisation, and this in turn has positively
influenced the learning strategy adopted by the
subjects during the navigation. In fact, subjects have
now developed a common exploration strategy that
tends to be the same through all the material. This
behaviour can be explained by the elaboration of a
common mental model that can be always applied
during navigation. This can produce a better
performance in terms of time, accuracy and learning.
The optimisation of the Case Study organisation
supports the optimisation of the learning interaction
allowing a faster and better information acquisition.
This enhanced information acquisition is
demonstrated by the fact that the analysis of the
Figure 2: The page shown in Figure 1 after the
implementation of the Guidelines.
WEBIST 2006 - E-LEARNING
396

post-learning questionnaires indicates a slightly best
performance in terms of learning if compared with
the results obtained during the first round
experimentation. This allows us to conclude that the
interaction at interface level has been improved,
since the interface layout and presentation have been
modified as to take the user’s eye movement into
account. Moreover, this study has also demonstrated
that there is a correlation between the user’s
explorative behaviour as revealed by his/her eye
movements and learning, since a better interface
interaction has resulted in a better learning
performance.
6 CONCLUSION
The paper has presented a set of guidelines for the
design of usable, acceptable and functional e-
learning systems. These guidelines were derived by
means of an evaluation methodology that is based on
the analysis of exploration eye movements. The
application of these guidelines to the Case Studies
set up in the project brought to an optimized e-
learning course organization. This result is
confirmed by the outcomes of all the analyses
carried out on the improved course. In fact,
statistical analysis clearly demonstrated that the
modified Case Study strongly benefited in terms of
homogeneity and of a more rigorous and balanced
structure.
The E-TRACKING guidelines are not in
competition with existing guidelines produced
within the Human-Computer Interaction field but
rather represent a product that aims to complete and
enrich the survey of e-learning systems supplying
both a new evaluation methodology of these systems
and a suggestion for the optimization of the systems
themselves. Compared to classical methodologies,
the data resulting from eye movements analysis can
indeed not be affected by recollection errors and are
not influenced by the personal opinions of both the
subject and the experimenter.
In conclusion, it can be suggested that the
methodology developed within the project and the
corresponding results obtained so far in terms of
quantitative data represent a powerful tool for
further investigations not only of the usability of e-
learning systems but also more in general of all
situations of HCI. Therefore this methodology
represents a first step for future applications of
subjects’ eye movement analysis in other fields of
HCI. Moreover, a possible follow-up which could
bring considerable benefit to the users could be
represented by the institution of a certification of
quality for Human Computer interfaces (e.g. in
particular in relation with e-learning courses) based
on the E-TRACKING Methodology.
ACKNOWLEDGMENTS
E-TRACKING project (IST-2001-32323) is partly
funded by the European Commission under the
Information Society Technologies 5th FP. Partners
of the project: Università di Pavia, Université de
Nice Sophia Antipolis, Giunti Interactive Labs.,
Fraunhofer Institute for Applied Information
Technology, Telefónica I.D., ARDEMI
.
REFERENCES
Carrol, J.M., 2000. Five reasons for scenario-based design,
Interacting with Computers 13(1), 43-60.
Clark, C. R., Mayer, R.E., 2003. e-Learning and the
Science of Instruction. Pfeiffer, John Wiley & Sons.
Goldberg, J.H., Schryver, J.C. 1995. Eye-gaze contingent
control of the computer interface: methodology and
example for zoom detection. Behaviour research
methods, instruments & computers, 27(3), 338-350.
Goldberg, J.H., Kotval, X.P. 1998. Computer interface
evaluation using eye movements: methods and
constructs. Int. J.Industrial ergonomics, 24, 631-645.
Koyani, S.J., Bailey, R.W., Nall, J.L., 2003. Research-
based web design & usability guidelines, NIH
Publications.
Nielsen, J. 1983. Usability Engineering. Academic Press
Rubin, J., 1994 Handbook of usability testing: how to
plan, design, and conduct effective tests, J. Wiley &
Sons, New York.
Web Accessibility Initiative, W3C
®
Recommendation 5-
May-99, Web Content Accessibility Guidelines 1_0,
http://www.w3.org/TR/WAI-WEBCONTENT/
DESIGN GUIDELINES FOR E-LEARNING SYSTEMS
397
