
BENCHMARKING OF WEB SERVICES PLATTFORMS
An Evaluation with the TPC-App Benchmark
Daniel F. García, Javier García, Manuel García, Ivan Peteira
Departamento de Informática, Oviedo University, Campus de Viesques, Gijón, Spain
Rodrigo García, Pablo Valledor
Centro Tecnológico de la Información y la Comunicación,Scientific and Technological Park, Gijón, Spain
Keywords: Web services, benchmarking, B2B systems, e-Commerce platforms.
Abstract: Web services are becoming an essential technology for the development of current distributed applications.
Therefore, the organizations must be aware of the possibilities and limitations of the web services and their
enabling technologies related to interoperability, performance, security, etc. Benchmarking techniques can
provide very useful insights about which technologies are viable and what are the current limitations of the
available implementations of those technologies. Furthermore, well established benchmarks provide a way
to carry out useful comparisons between two or more implementations. In this paper we present several
issues of how web service implementations could be benchmarked. We describe the TPC-App benchmark
and explain the most interesting issues of our implementations. Finally we present benchmarking results for
the two predominant development platforms, .NET and J2EE.
1 INTRODUCTION
The web services technology have changed the
manner in which servers provide services to the
users. Traditionally, a server or a closely-coupled
cluster of servers contained all the information and
the necessary resources to provide its services to the
users.
Currently, it is very common that a server have
to request services from other servers to provide the
final service requested by a user, or other server that
plays the role of user (Menascé 2003). All the
requests and responses carried out between two or
more servers to compose final services are based on
web services technology.
Today, service provision often involves a set of
coupled servers. However, in order to the user
receive the services with acceptable response times,
it is essential that the application servers that
provides the web services have enough capacity to
process the expected workload intensity level.
Benchmarks can be very useful tools to provide
clear indications about the capacity of web services
platforms. Furthermore, they allow the comparison
of multiple platforms and allow exploring the
influence of configuration parameters of platforms
on the achievable performance (García, 2003).
2 RELATED WORK
One of the first synthetic applications or benchmarks
that included web services was PetStore (Sun, 2000).
It was proposed by Sun Microsystems as a well
structured example of how to develop an application
with the J2EE technology. PetStore is essentially a
web forms application that includes a unique web
service to query the status of a purchase order, and
therefore, it can not be considered a representative
application of web services usage.
Immediately, Microsoft developed a version of
PetStore for the .NET platform (Microsoft, 2001)
and compared the scalability, performance, number
of code lines and %CPU necessary to execute its
implementation with the J2EE-based version of Sun.
Shortly afterwards, The Middleware Company
specified and implemented PetStore V2.0 (The
Middleware Company, 2002) that only includes one
75
F. García D., García J., García M., Peteira I., García R. and Valledor P. (2006).
BENCHMARKING OF WEB SERVICES PLATTFORMS - An Evaluation with the TPC-App Benchmark.
In Proceedings of WEBIST 2006 - Second International Conference on Web Information Systems and Technologies - Internet Technology / Web
Interface and Applications, pages 75-80
DOI: 10.5220/0001239600750080
Copyright
c
SciTePress

web service to obtain the status of a purchase order.
The innovation with respect to the previous version
is that consider two scenarios for web service
activation: local (C2B) and remote (B2B). An
important benchmarking aspect is that an average
thinking time of 10 seconds is used between the
successive requests of the clients. This new version
is also too simple to be considered as an acceptable
benchmark for web services.
A more complete benchmark for web services is
@Bench (Doculabs, 2003) that exposes 3 services:
GetOrderDetails, GetCustomer, NewCustomer. The
users request the three services with the same
probability and the time between two successive
requests is chosen as a random value between 2 and
8 seconds. This benchmark models the interactive
requests that users send to the application server of
their own company (this represents a C2B scenario).
However this benchmark does not model the
relations of a server with other servers, that is, the
typical B2B scenario integrated in a server based on
web services.
The Spidermark benchmark (Subramanyam,
2003) models a set of users sending interactive
requests to the application server of their own
company (this represents a C2B scenario). The
benchmark also models the transactions carried out
by the application server with servers of external
suppliers of the company to satisfy the requests of
the users (this represents a B2B scenario). All the
interactions are implemented using web services.
Later, Sun Microsystems proposed the
benchmark WSTest (Sun, 2004) to compare the
technologies used to implement web services. This
benchmark only invocates empty methods in the
remote server, that echo the variables received. This
benchmark has been designed to evaluate only the
communication aspects involved in web services.
Microsoft modified this benchmark adding a method
to generate load in the server (Microsoft, 2004).
WSTest does not model any specific e-commerce
scenario and it is too simple to be considered as a
general benchmark for web services platforms.
Finally, the Transaction Processing Performance
Council organization (TPC) launched the
specification 1.0 of the benchmark TPC-App
(TPC 2004) that is an application server and web
services benchmark. The application modelled by
this benchmark is a retail distributor operating
through Internet that support ordering and retrieving
information of products (this represents a typical
B2B scenario).
For our research work on benchmarking of web
services platforms, we have selected the TPC-App
benchmark, because it models very well the
operations and the workload of a typical e-business
application server that interacts with other
e-business servers through web services.
3 AN OVERVIEW OF TPC-APP
The TPC-App benchmark emulates the activities of
a B2B transactional application server system with
the goal of obtaining an indication of the
performance capabilities of the server system.
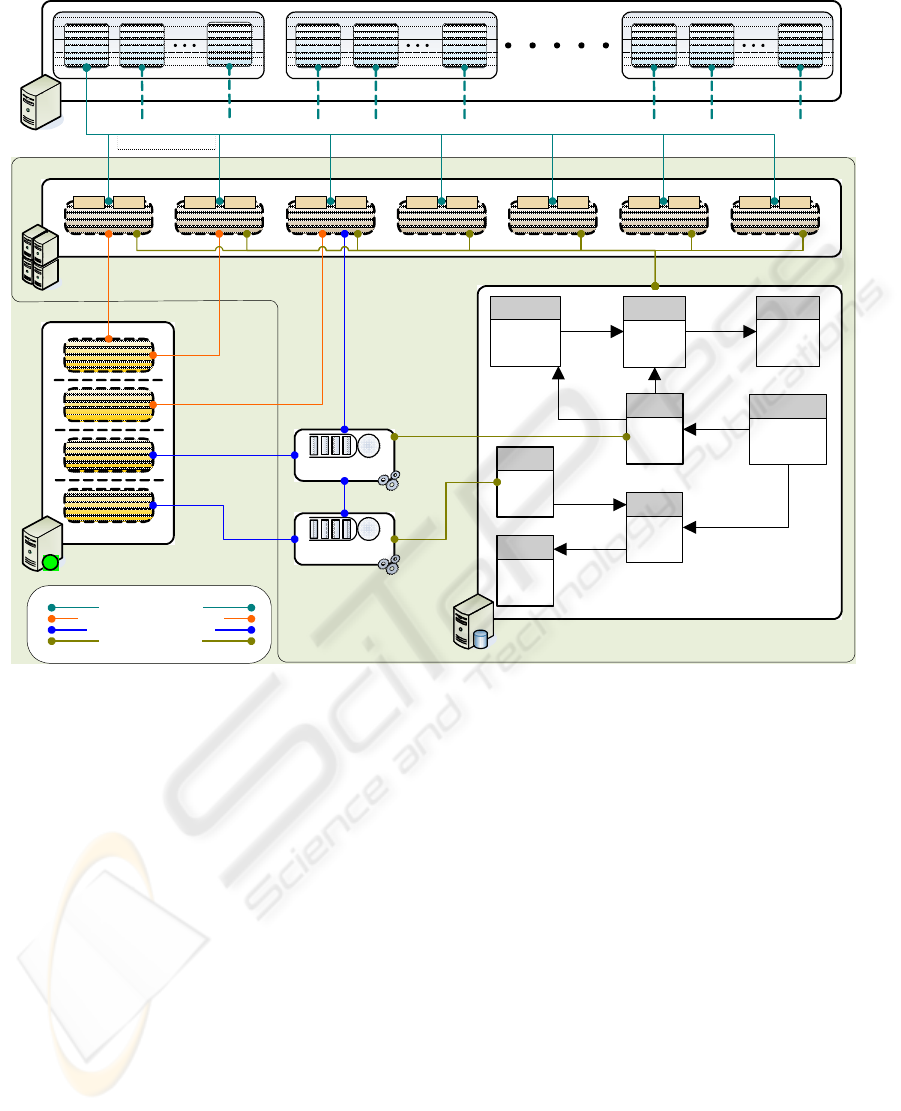
The benchmarking architecture includes three
main elements: the System Under Test (SUT), the
Remote Business Emulator (RBE) and the external
emulators. Figure 1 gives a general overview of
these three elements of the benchmark, showing also
their main internal components.
3.1 The Server Under Test
The server (SUT) exposes 7 remote methods to the
remote business emulator (RBE). Figure 1 shows
these methods, indicating also the percentage of
invocations of each method and the maximum
admissible value of the 90-percentile response time
for the invocations of each particular method.
The most important method is Create Order,
whose operation is explained in the following
paragraphs. The Create Order method creates an
order on the database and sends a message to the
order fulfilment subsystem using the shipping queue.
An order summary is returned to the RBE.
Later the orders are processed asynchronously by
the Shipping Process. It extracts the messages with
the orders from the shipping queue and process the
order in two different ways, as a function of the
order status:
1) If the status is pending, there are enough items
in stock to complete the order and send the items to
the customers. The Shipping Process sends a request
to the external shipment notification emulator (SNE)
which represents an external packet delivering
company. The SNE returns an image that represents
a shipping label and a tracking number for the
shipment package.
2) If the status is back, there are not enough
items in stock to complete the order, and therefore, a
message is sent to the stock management queue in
order to the stock management process add new
items to the stock. Then, it sends a message to the
shipping queue containing the order with its status
assigned to pending.
WEBIST 2006 - INTERNET TECHNOLOGY
76
SUT
DATA BASE SERVER
EXTERNAL VENDORS
WEB SERVICES SERVER
Order Status Product D etailNew Customer Create Order New Products
Change Pay ment
Method
Change Item
POVService
PGEService
SNEService
ICEService
1% 3sec 5% 3sec 50% 4sec 5% 4sec 30% 1sec7% 1sec 2% 1sec
RBE
EB thread
Busine ss
Sessio n
SSL comm unication
Busin ess
Sessio n
EB thread
ORDER_LINE
CUSTOMER
ORDERS
ITEM
ADD RESS
STOCK
AUTH OR
COUNTRY
Busine ss
Sessio n
Busine ss
Session
Busin ess
Sessio n
Busine ss
Sessio n
EB thread
Busine ss
Sessio n
Busin ess
Sessio n
Busine ss
Session
Access to a W eb Service
Access to an External W eb Service
Access to the M essage Queue
Access to the Data Base
Stock Management
Pr ocess
Shipping Process
Figure 1: General layout of the TCP-App benchmark.
The other six methods implemented in the SUT
are simpler. Figure 1 also shows that three methods
and the two internal processes of the application
server use services provided by external vendors.
Other important part of the SUT is the database
server. It supports a database with 8 individual
tables. Figure 1 also shows the entity-relationship
among these tables.
All the interactions of processes and web
services with the database must be made through a
transaction manager supporting full ACID properties
for transactions. The benchmark defines a series of
tests to demonstrate that the requirements of
Atomicity, Consistency, Isolation and Durability are
fulfilled.
The size of the database is scaled with the
number of EBs that is used in a benchmarking
experiment. The benchmark considers two types
of Ebs: Configured Ebs and Active Ebs.
The Configured Ebs refers to the initial
population of the Customer Table divided by 192.
The factor 1/192 is the fraction of registered
customers that can be connected to the SUT
simultaneously at any time. The cardinality of most
important tables is a function of the Configured Ebs.
The Active Ebs refers to the subset of
Configured Ebs that are concurrently connected and
using web services during a load injection test.
The number of Active Ebs during a Test Run
must be at least 90% and not more than 100% of the
Configured EBs.
3.2 The Remote Business Emulator
The remote business emulator (RBE) is typically a
multithreaded process. Each thread emulates an
active EB that request services within business
sessions. An EB must open a new socket connection
BENCHMARKING OF WEB SERVICES PLATTFORMS - An Evaluation with the TPC-App Benchmark
77

and a SSL/TSL secure session for each new business
session.
The benchmark defines the Business Session
Length (BSL) as the number of web service
interactions to be requested in the Business Session.
The BSLs are random values generated with a Beta
distribution scaled between 1 and 120.
There is no think time between two successive
web service requests within a business session.
When a business session ends, the EB starts a
new business session immediately.
Now, the workload injection scenario modelled
by the benchmark is analyzed. The RBE emulates
multiple remote application servers (client
computers) sending requests to the local TPC-App
server. A single active EB (thread) of the RBE
reproduce the behaviour of different client
computers opening business sessions on the
TPC-App server sequentially.
Therefore, the load injection models a typical
B2B scenario, in which, multiple remote application
servers send requests to the local TPC-App server.
3.3 The External Emulators
The application server interacts with other
application servers through web services. The TPC-
App benchmark requires 4 emulators:
The Purchase Order Validation Emulator (POV)
represents an external system that authorizes the
credit for a new customer or for an existing customer
that is changing the method of payment.
The Payment Gateway Emulator (PGE)
authorizes payments with credits cards.
The Inventory Control Emulator (ICE) receives
requests for additional item stock, acknowledging
the received messages.
The Shipment Notification Emulator (SNE)
emulates a packet delivering company, like FEDEX,
UPS, etc.
3.4 The Performance Metrics
The main performance metric provided by the
TPC-App benchmark is the throughput of the
application server measured in Web Service
Interactions per Second (SIPS). The benchmarking
results must include the SIPS per application server
system (for clusters) and the Total SIPS for the
entire tested configuration (SUT). The associated
price per SIPS ($USD/SIPS) and the availability of
the configuration tested must also be reported.
4 IMPLEMENTATION ISSUES
We have developed two different implementations
of the TPC-App benchmark, one for .NET and other
for J2EE. Both implementations share the same
basic design, following the three-tier architecture.
In the presentation tier reside the access points to
web services, and the WSDL is common to both
implementations. The J2EE implementation exposes
the web services using a servlet hosted in the
Tomcat Axis Engine bundled in JBOSS. In the .NET
implementation the web services are hosted in
Internet Information Server (IIS) and perform on the
ASP.NET runtime.
In the business tier, the functionality of the seven
web services is grouped in three components in both
implementations. Other component is integrated to
support distributed transactions. In the J2EE
implementation, Session EJBs are used to manage
the business logic. In .NET, common classes are
used to implement the functionality plus an
additional COM+ serviced component to support
distributed transactions. Therefore the implemented
software can scale automatically using a cluster of
machines to implement the application server.
In the data tier, both implementations use SQL
Server 2000. In the J2EE implementation, JDBC
was used to perform the queries, under the
management of EJBs components. In the .NET
implementation, the queries are performed invoking
methods of the ADO.NET library. Both
implementations use a connection pool with the
database and several processing tasks were put in the
data server using stored procedure calls to alleviate
the load of the application server.
The two processes involved in the Create Order
service, shipping and stock management, require
asynchronous messaging services, and therefore, two
queues must be used. In the J2EE environment,
JBOSS-MQ manages the queues and the process
logic is performed by Message Driven Beans, which
are automatically handled by the JBOSS container.
In the .NET framework, MSMQ controls the queues
and the process logic is implemented as two
Windows services created for that purpose.
Due to the ACID transactional requirements
imposed by the specifications of the benchmark, the
services of a transactional manager are need. The
J2EE implementation uses the “Java Transaction
Service” jointly with EJBs controlled by the JBOSS
container. The .NET implementation uses the
“Distributed Transaction Coordinator” (DTC)
through .COM+ components.
WEBIST 2006 - INTERNET TECHNOLOGY
78
5 EXPERIMENTAL RESULTS
This section shows a brief summary of the results
obtained from the execution of the implementations
of the TPC-App benchmark on the main two web
services development platforms: .NET and J2EE.
The two benchmarks have not been especially
optimized for this evaluation work.
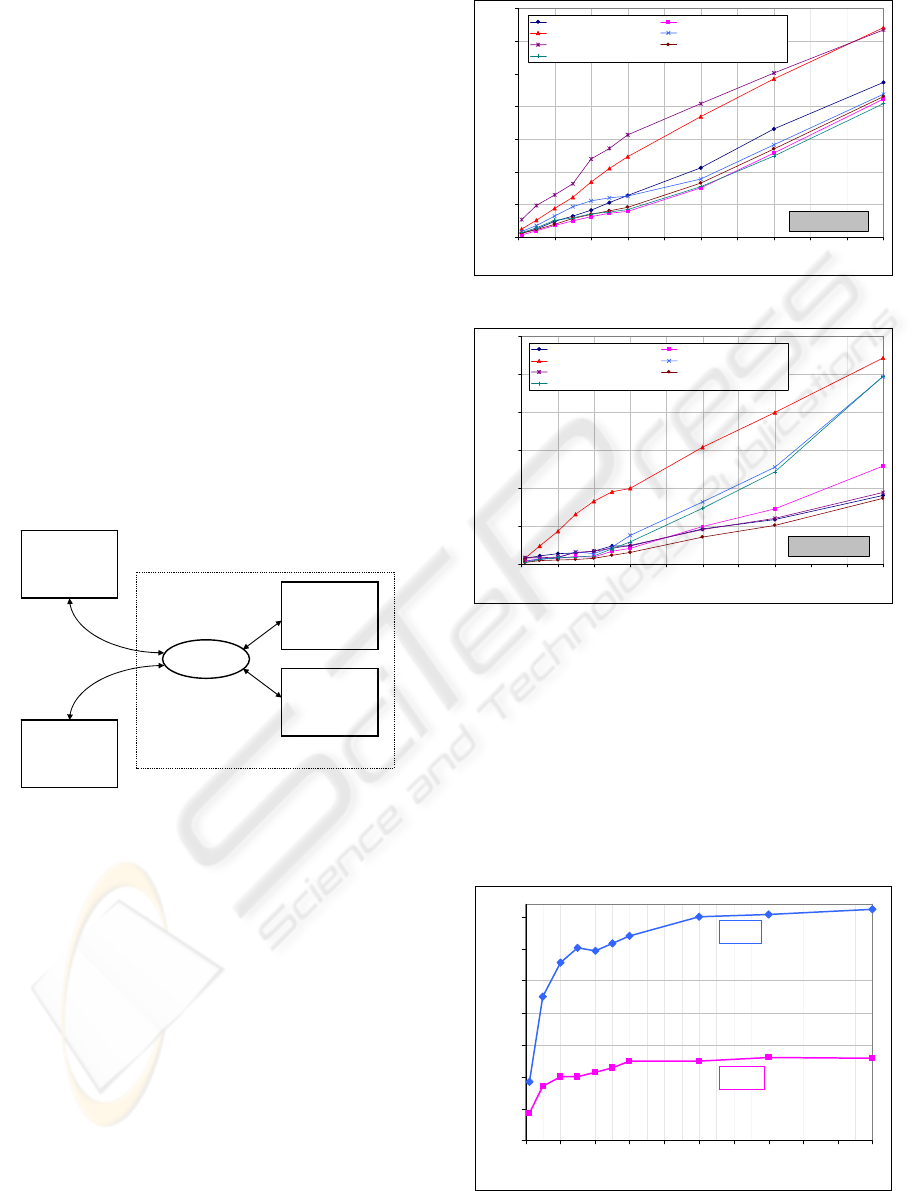
The physical architecture for experimentation is
shown in figure 2. It is composed by four computers
connected by a 100 MBps Ethernet switch. The SUT
has two identical computers based in a Dual
Pentium III at 1100 Mhz. The computers for RBE
and external emulators are identical and they are
based on single Pentium III at 850 Mhz. All
computers run the Windows 2003 Server operating
system and the database used is SQL Server 2000.
The unique admissible difference in this
architecture is the benchmarking software executed
in the application server: a J2EE implementation or
a .NET implementation.
Workload
Driver
Ethernet
switch
External
Emulators
Application
Server
Database
Server
System Under Test (SUT)
RBE
Figure 2: Benchmarking architecture.
The purpose of the experiments is not to give the
specific TPC-App result, but obtaining insights
about the performance issues of the two platforms.
Figures 3 and 4 represent the response time of
the seven interactions with exposed web services
when the number of EBs increases. The .NET
platform performs notably better than J2EE. We
expected that the “Create Order” web service would
show the greater response times due to its high
complexity. The measurements confirm this
behaviour, but in .NET the “New Products” web
service performs worst, in spite of it is a very
simple. This unexpected behaviour requires than an
optimization of this service will be accomplished.
.NET Platform
0,0
0,5
1,0
1,5
2,0
2,5
3,0
3,5
0 102030405060708090100
Number of Emulated Business (EBs)
Average Response Time (sec)
NEW_CUSTOMER CHANGE_PAYMENT_METHOD
CREATE_ORDER ORDER_STATUS
NEW_PRODUCTS PRODUCT_DETAIL
CHANGE_ITEM
Figure 3: Response time of interactions in .NET.
J2EE Platform
0,0
2,0
4,0
6,0
8,0
10,0
12,0
0 102030405060708090100
Number of Emulated Business (EBs)
Average Response Time (sec)
NEW_CUSTOMER CHANGE_PAYMENT_METHOD
CREATE_ORDER ORDER_STATUS
NEW_PRODUCTS PRODUCT_DETAIL
CHANGE_ITEM
Figure 4: Response time of interactions in J2EE.
The primary objective of TPC-App and the most
of benchmarks is to provide an index of the
sustained throughput that a hardware-software
platform can provide. Figure 5 shows the evolution
of the system throughput. The .NET-based
implementation shows better performance for all the
range of EBs considered in the experiment. The
throughput under saturation conditions in .NET is
more than double than in J2EE.
0
5
10
15
20
25
30
35
0 102030405060708090100
Number of Emulated Business (EBs)
Throughput (Total SIPS)
.NET
J2EE
Figure 5: Comparison of throughput.
BENCHMARKING OF WEB SERVICES PLATTFORMS - An Evaluation with the TPC-App Benchmark
79
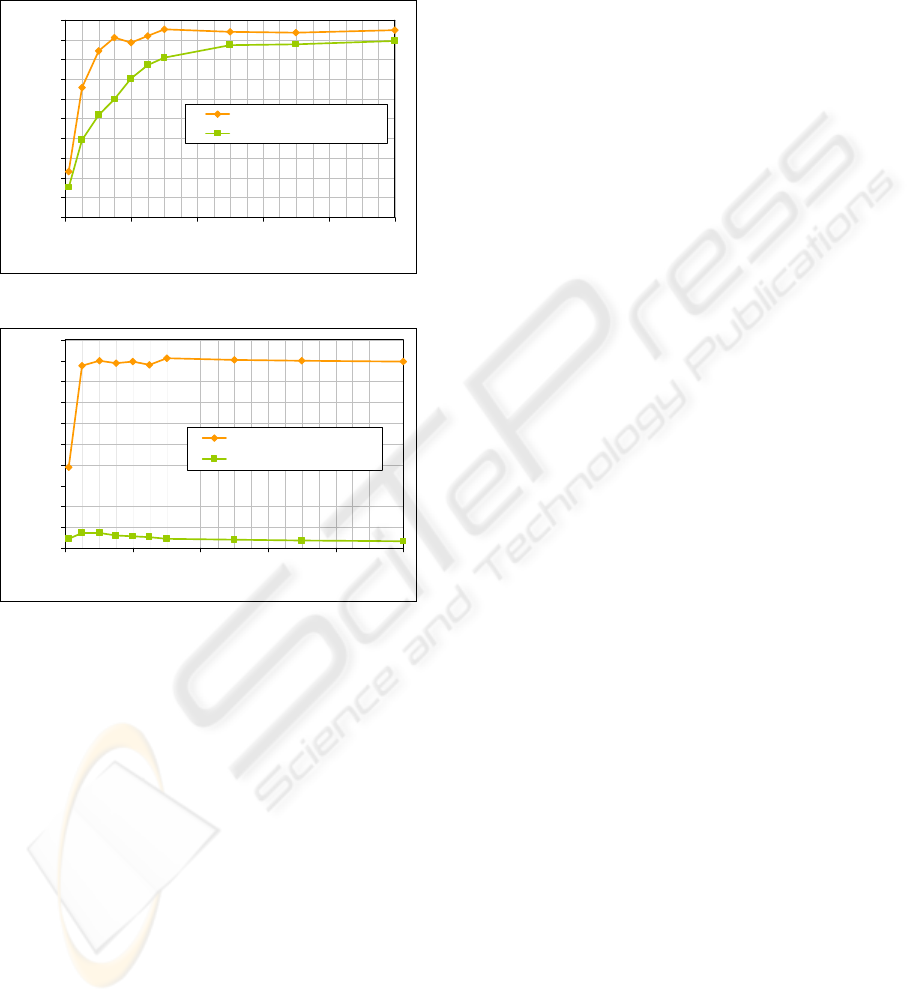
Finally, the previous results can be explained by
the measurements of resource utilization. The main
bottlenecks are the CPU utilizations in the
application server and in the database server. These
utilizations are shown in figures 6 and 7.
0
10
20
30
40
50
60
70
80
90
100
020406080100
Number of Emulated Business (EBs)
CPU Utilization in .NET (%)
Application Serve r .NET
Database Server .NET
Figure 6: Utilization of CPUs in .NET.
0
10
20
30
40
50
60
70
80
90
100
020406080100
Number of Emulated Business (EBs)
CPU Utilization in J2EE (%)
Application Server J2EE
Database Server J2EE
Figure 7: Utilization of CPUs in J2EE.
The main differences in CPU utilization are
derived from the different approaches used to access
the database by the two implementations of the
benchmark.
The common practice developing in Java is to
maintain separated the data-access tier form the
database, trying to reduce the coupling between
them. This approach puts additional load in the CPU
of the application severs and reduces the CPU load
of the database servers.
In .NET development, the use of stored
procedures is a common practice. Therefore, the data
access mainly runs in the database server. This
approach produces a more equilibrated use of the
CPUs of both servers, but it increases the coupling
between tiers.
Two new implementations will be developed
following the common practices used in both
environments.
6 CONCLUSIONS
In this research work we have implemented the
TPC-App benchmark in the two predominant
development platforms, .NET and J2EE. Both
implementations are similar in order to the
comparison of the platforms be objective. The
benchmarking results show a clear advantage of
.NET implementation against J2EE when the
benchmarks are developed following the common
programming practices in each platform.
Future work will be accomplished to find the
detailed reasons of the great differences in the
performance provided by the two web services
development platforms.
REFERENCES
Doculabs, 2003. @Bench web services performance
benchmark study. Technical Report of Doculabs.
The Middleware Company, 2002. J2EE and .NET
application server and web services benchmark.
Technical Report of The Middleware Company.
García, D. F., García, J., 2003. TPC-W E-Commerce
benchmark evaluation. IEEE Computer, February
2003, pag 42-48.
Menascé, D., 2003. QoS issues in web services. In IEEE
Internet Computing, Nov-Dec 2003, pag 72-75.
Microsoft, 2001. Implementing Sun’s Java PetStore using
Microsoft .NET. Report of Microsoft Corporation.
http://www.gotdotnet.com/team/compare/veritest.aspx
Microsoft, 2004. Web services performance: Comparing
Java2EE and .NET framework. A response to Sun
Microsystems benchmark.
http://www.theserverside.net/articles/showarticle.tss?id=Sun
BenchmarkResponse
Subramanyam, S., et al. Designing a web services
benchmark. In ICWS’03. International Conference on
Web Services, Las Vegas, USA.
Sun, 2001. Java Pet Store. White Paper of Sun.
http://java.sun.com/developer/releases/petstore/.
Sun, 2004. Web services performance: Comparing
Java2EE and .NET framework. White Paper of Sun.
http://java.sun.com/performance/reference/whitepapers/
TPC, 2004. TPC Benchmark App (Application Server)
specification, version 1.0. Transaction Processing
Performance Council. http://www.tpc.org/tpc_app/.
WEBIST 2006 - INTERNET TECHNOLOGY
80
