
Comparison of Approximate Entropy Measure and
Poincaré Plot Indexes for the Study of Gait
Characteristics in the Elderly
Ahsan H. Khandoker
1
, Marimuthu Palaniswami
1
, and Rezaul K. Begg
2
1
Department of Electrical & Electronic Engineering, The Universityof Melbourne,VIC
3010,Australia
2
Biomechanics Unit, Centre for Ageing, Rehabilitation, Exercise and Sport, Victoria
University, VIC 8001,Australia
Abstract. Early identification of at-risk gait helps prevent falls and injuries.
The aim of this study is to investigate the relationship between approximate en-
tropy (ApEn) and Poincaré plot indexes of elderly gait patterns and to test
whether ApEn could be used as a reliable gait identifier for falls-risk. Minimum
foot clearance (MFC) data of 14 elderly and 10 elderly participants with a his-
tory of falls and balance problems were analyzed. The ApEn values of MFC
were significantly correlated with Poincaré plot indexes of MFC in the healthy
elderly group, whereas correlations were absent in the elderly fallers group.
Mean ApEn in the fallers group (0.18±0.03) was significantly higher than that
in the healthy group (0.13±0.13). The higher ApEn values in the fallers group
might indicate increased irregularities in their gait patterns and a loss of gait
control mechanism. Results are useful for the early diagnosis of common gait
pathologies.
1 Introduction
It has been well documented in the literature that ageing influences gait patterns that
affects the control mechanism of human locomotor balance. One major aim of study-
ing gait characteristics is to identify gait variables that reflect gait degeneration due to
ageing with linkages to the causes of falls. This would help to undertake appropriate
measures to prevent falls.
Approximate entropy (ApEn), a mathematical approach to quantify the complexity
and regularity of a system, has been introduced by Pincus [1], based on a novel sys-
tematic biological theory [1,2]. Such theory has suggested that healthy dynamic sta-
bility arises from the combination of specific feedback mechanisms and spontaneous
properties of interconnected networks, and the weak connection between systems or
within system is the mechanism of disease, which is characterized by an increased
irregularity of the time series [2]. Therefore, ApEn was considered to provide a di-
rect measurement of feedback and connection, and a low ApEn value often indicates
H. Khandoker A., Palaniswami M. and K. Begg R. (2006).
Comparison of Approximate Entropy Measure and Poincaré Plot Indexes for the Study of Gait Characteristics in the Elderly.
In Proceedings of the 2nd International Workshop on Biosignal Processing and Classification, pages 144-151
DOI: 10.5220/0001225701440151
Copyright
c
SciTePress

predictability and high regularity of time series data, whereas a high ApEn value
indicates unpredictability and random variation [2]. Previous studies [7] on the en-
tropy of human gait in multiple scale discussed the scaling effect of entropy on vari-
ous walking patterns, indicating the changes of multiscale entropy values with slow,
normal and fast walking.
Poincaré plot is a geometrical representation of a time series into a Cartesian plane,
where the values of each pair of successive elements of the time series define a point
in the plot. Indexes derived from Poincaré plot of minimum foot clearance (MFC)
were used to classify young-old gait types in our previous study [6].
In order to test whether the ApEn of MFC variability could be used as a better
identifier of gait pathologies or not, we apply ApEn analysis method to the MFC gait
data obtained from elderly subjects with and without having balance problem, and
compare the results with those obtained with Poincaré plot indexes analysis.
2 Gait analysis
2.1 MFC Gait data
Minimum foot clearance (MFC) data from 14 healthy elderly (mean age: 62 years)
and 10 elderly with a history of falls (mean age: 63.2 years) were taken from Victoria
University (VU)’s Biomechanics Unit database. Foot clearance (FC) data for these
subjects were collected during their steady state self-selected walking on a treadmill
using a PEAK MOTUS 2D motion analysis system (Peak Technologies Inc, USA).
Minimum foot clearance (MFC) was calculated by subtracting ground reference from
the minimum vertical coordinate during the swing phase through a 2D geometric
model [9].
2.2 Estimation of ApEn of MFC
ApEn is defined as the logarithmic likelihood that the patterns of the data that are
close to each other will remain close for the next comparison within a longer pattern.
ApEn is computed by using the following equation:
where C, N, r, and m represent the correlation integral, the total number of data points
in the MFC time series, vector comparison length, and embedding dimension, respec-
tively. In the ApEn calculation with our MFC data, N was fixed at 400 points and m
at 2. The tolerance r was chosen as 40% of the SD of the MFC data points and C was
the number of vectors with a maximum distance less than or equal to r to the template
()
∑
+−=
−−
=
−
)1m(N
1i
m
i
1
)r(Cln1mN)r,m,N(ApEn
∑
−−
−
=
+
−
mN
1i
1m
i
1
)r(Cln)mN(
145

vector. The natural logarithm of C was averaged over the 400 stride numbers and this
process was repeated for m=3. ApEn was defined as the difference between the val-
ues calculated using m=2 and m=3.
2.3 MFC Poincaré plots
MFC data plots between successive gait cycles, i.e., between MFCn and MFCn+1
(see Figure 1B,D), known as MFC Poincaré plots [6], shows variability of MFC data
and describes performance of the locomotor system in controlling the foot clearance
at this critical event. Poincaré plots with high correlation coefficient is attributed to
high level of control between strides, whereas a low correlation shows less control
since one stride is loosely affected by the previous stride. These plots were used to
extract indexes, such as length (SD2) and width (SD1) of the long and short axes of
Poincaré plot images [3]
. The width of this plot corresponds to the level of short-term
variability, while the length of the plot corresponds to the level of long-term variabil-
ity.
3 Results
In order to compare the gait patterns of healthy elderly and falls-risk elderly, two
representative examples of MFC time series and its corresponding Poincaré plots
taken from each group have been presented in figures 1A,B,C&D. Gait characteristics
of a healthy elderly subject with mean MFC (1.56 ± 0.21cm), and its corresponding
Poincaré plot (Fig.1B) with indexes (SD1=0.31, SD2= 0.5, SD1/SD2=0.63) and esti-
mated ApEn (0.15) seemed quite different from the gait characteristics of falls-risk
elderly subject with mean MFC (1.71±0.41cm), and its corresponding Poincaré plot
(Fig.1D) with indexes SD1=0.72, SD2= 0.92, SD1/SD2=0.79) and estimated ApEn
(0.21). Student’s t-test showed that average values of mean MFC, sdMFC, SD1,
SD2, and ApEn in healthy elderly group are significantly different from those in the
falls-risk elderly group (P<0.05) ( Table 1 &2).
3.1 Relationship between ApEn and mean MFC
Table 1 & 2 show the Pearson correlation matrices among all tested indexes in the
healthy elderly group and falls-risk elderly group. The correlation coefficient of mean
MFC with ApEn is significantly (P<0.05, student t-test) higher in the falls-risk group
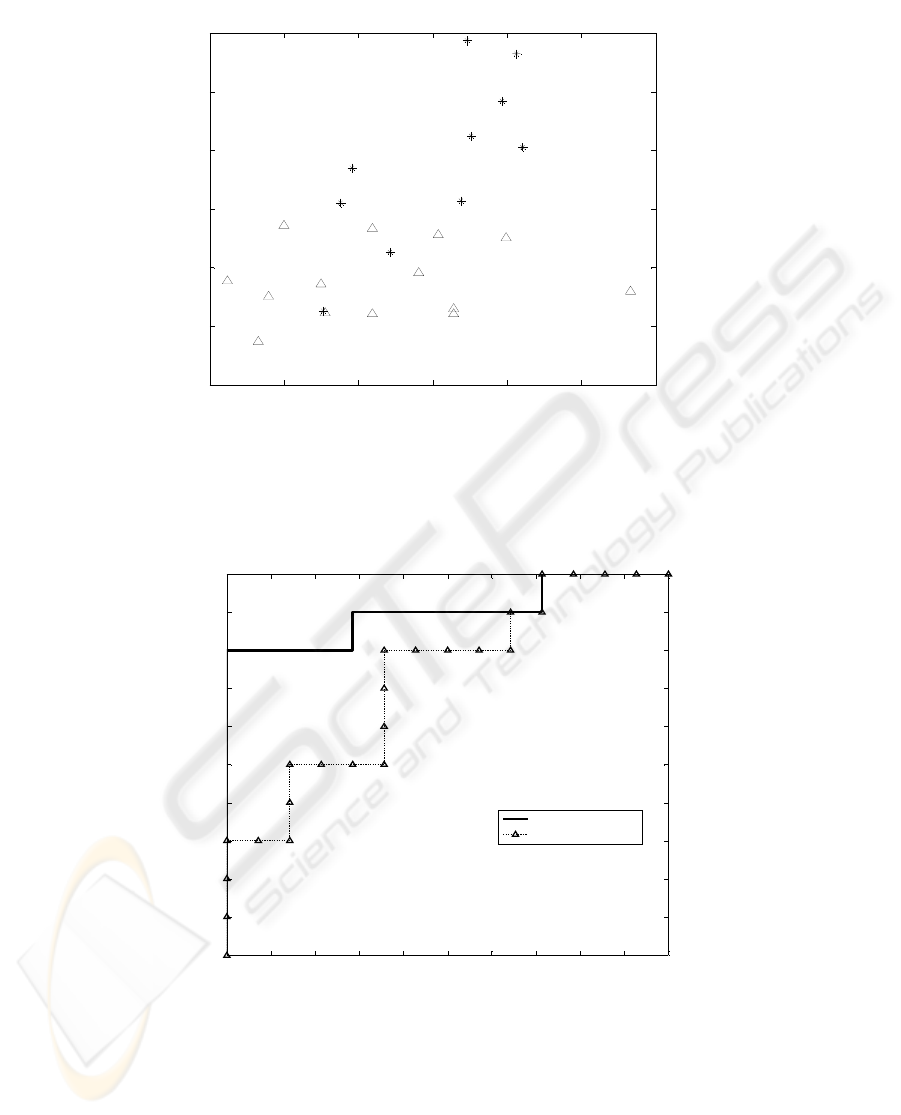
(0.74) compared to that in the healthy group (0.14). Figure 2 illustrates a positive
correlation between ApEn and mean MFC measures within the fallers group, how-
ever, such correlation was absent in the healthy elderly group.
146
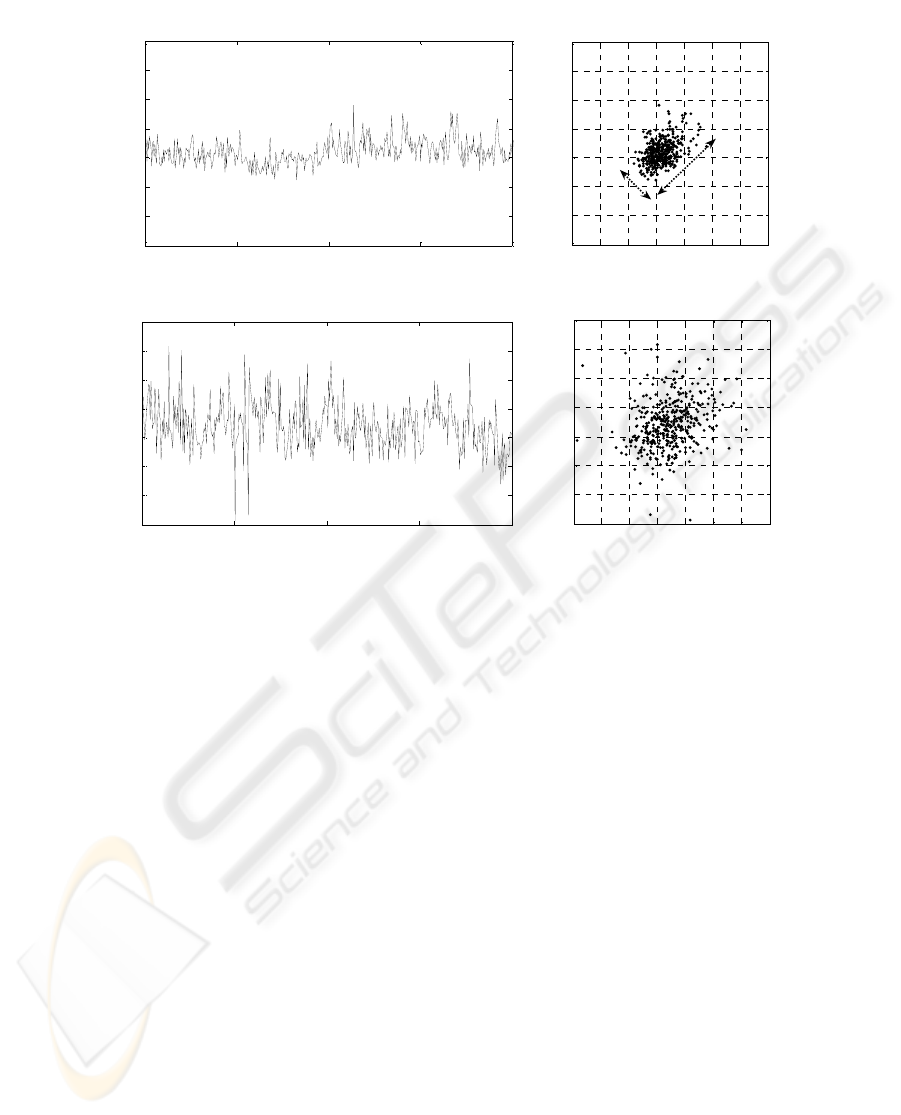
Fig. 1. Top panels show MFC time series from a healthy elderly subject (A) and its corre-
sponding poincaré plot (B). Bottom panels show MFC time series from an elderly subject with
balance problem (C) and its corresponding poincaré plot (D).
3.2 Relationship between ApEn and Poincaré plot indexes
Correlation analysis also shows that ApEn was significantly correlated with Poincaré
plot indexes (SD1, SD2), however not with the SD1/SD2 ratio in the healthy elderly
group. No significant correlation was found between ApEn and Poincaré plot indexes
in the fallers group.
3.3 ROC curve analysis
Receiver Operating Characteristics (ROC) curves were used to characterize the qual-
ity of the single MFC indexes with respect to the identification task. Table 3 summa-
rizes the ROC areas calculated for each index. The larger area under ROC curve indi-
cates better performance of that classifier. The largest ROC area (0.90) was found for
ApEn, whereas the lowest area (0.55) was for SD1/SD2 ratio. In order to show the
comparative performance of ApEn and SD2 as a gait pattern identifier, ROC curves
for ApEn and SD2 were plotted (see Fig. 3).
0 100 200 300 400
0
0.5
1
1.5
2
2.5
3
3.5
Stride number
Minimum foot clearance (MFC) (cm)
MFC+1
MFC
Minimum foot clearance (MFC) (cm)
MFC
MFC+1
Stride number
0 0.5 1 1.5 2 2.5 3 3.5
0
0.5
1
1.5
2
2.5
3
3.5
0 100 200 300 400
0
0.5
1
1.5
2
2.5
3
3.5
0 0.5 1 1.5 2 2.5 3 3.5
0
0.5
1
1.5
2
2.5
3
3.5
C
A B
D
SD2
SD1
147
0.5 1 1.5 2 2.5 3 3.5
0.1
0.12
0.14
0.16
0.18
0.2
0.22
Mean MFC (cm)
Approximate entropy
0 0.1 0.2 0.3 0.4 0.5 0.6 0.7 0.8 0.9 1
0
0.1
0.2
0.3
0.4
0.5
0.6
0.7
0.8
0.9
1
False positive
True positive
Approximate entropy
Poincare length
Fig. 2. Scatter plot for ApEn vs mean MFC for the healthy elderly subjects (Δ) and the elderly
subjects with balance problem (*). Note: good separation between healthy and non healthy
subjects with clustering of points in two distinct “clouds”. Correlation coefficients between
ApEn and mean MFC for the two groups were 0.14 (Δ )and 0.74 (*) respectively. (Table 1 &
2).
Fig. 3. ROC (receiver operating characteristics) curves showing true positive (sensitivity) and
false positive rate (1-specificity) for various thresholds using Approximate entropy (ApEn)
and length of the Poincaré plots (SD2) across 14 healthy elderly subjects and 10 elderly sub-
148

jects with balance problem. Areas of ROC curves for ApEn and SD2 were 0.9 and 0.73 respec-
tively. (Table 3).
Table 1. Correlation coefficients among mean MFC, Poincaré plot indexes and ApEn of MFC
in the healthy elderly subjects (n= 14).
Table 2. Correlation coefficients among mean MFC, Poincaré plot indexes and ApEn of MFC
in the elderly with balance problem (n=10).
Table 3. ROC areas for ApEn and Poincaré plot indexes.
4 Discussion
The results of this study suggest that ApEn analysis of MFC data provides useful
information regarding identification of gait characteristics in the elderly. Early detec-
tion of gait pattern changes due to ageing and falls-risk using a nonlinear index like
ApEn might provide the opportunity to initiate pre-emptive measures to be under-
Mean
MFC
sd
MFC
SD1
SD2
SD1/
SD2
ApEn
Mean
±sd
1.65
±0.75
0.35
±0.13
0.51
±0.19
0.89
±0.32
0.64
±0.13
0.13
±0.13
mean MFC 1 0.31 0.51 0.21 0.38 0.14
sd MFC 1 0.90*** 0.99*** -0.36 -0.73**
SD1 1 0.81** 0.082 -0.58*
SD2 1 -0.50 -0.74**
SD1/SD2 1 0.38
ApEn 1
* P<0.05 ** P<0.01 *** P<0.001 SD1= Poincaré width,
SD2= Poincaré length, sd=standard deviation
9
Mean
MFC
sd
MFC
SD1
SD2
SD1/
SD2
ApEn
Mean
±sd
2.01
±0.51
0.48
±0.16
0.72
±0.25
1.15
±0.40
0.64
±0.12
0.18
±0.03
mean MFC 1 0.85*** 0.70* 0.86** -0.44 0.74*
sd MFC 1 0.90*** 0.99*** -0.37 0.58
SD1 1 0.81** 0.06 0.49
SD2 1 -0.51 0.59
SD1/SD2 1 -0.28
ApEn 1
* P<0.05 ** P<0.01 *** P<0.001 SD1= Poincaré width
SD2= Poincaré length sd=standard deviation
mean
MFC sd MFC SD1 SD2
SD1/SD2 ApEn
ROC area 0.71 0.74 0.76 0.73 0.55 0.9
149

taken to avoid injurious falls. Also, such nonlinear index could potentially be used as
gait diagnostic parameter in clinical situation.
In this study, MFC data from steady-state gait have been used to characterize gait
patterns. There are two major reasons for this. Firstly, MFC provides a more sensitive
measure of motor function of the locomotor system compared to some gross overall
kinematic descriptions of gait such as joint angular changes or stride phase times,
secondly its close linkage with tripping falls [8]. Furthermore, long-term MFC data,
as used in this study, are required so that variability indexes of MFC having long
range correlation could be
captured representative of the real gait performance.
Our results suggest that gait pathologies with falls and balance problems are re-
flected in Poincaré plots and features extracted from these plots are effective in dif-
ferentiating between healthy and falls-prone gaits. Poincaré plots were used in our
earlier study for young-old gait classification [6]. In this study, such analysis has been
extended to identifying elderly with a history of falls and balance problems. More-
over, nonlinear parameter like ApEn has been applied in this study in identifying gait
characteristics. Although both Poincaré plot indexes and ApEn were effective in
discriminating the gait characteristics patterns, results of our present study suggest
that ApEn could perform better than Poincaré plot indexes in identifying gait pattern.
One possible reason why a nonlinear index like ApEn could be a more effective gait
identifier might be that physiologic control mechanism of healthy human gait is
nonlinear and correlated. However, higher ApEn values displayed in the fallers group
might be an indication of the breakdown of locomotor control mechanism in the falls-
risk elderly. ApEn reflects irregularity, randomness and complexity of the MFC time
series data, and would therefore, indicate the stability in the control of foot motion
over the ground.. In a previous study involving gait, Costa et al [7] applied multi-
scale entropy (MSE) for analysing gait with different speeds and studied the scaling
effect on sample entropy for different walking rates. Sample entropy (SampEn) on
single scale in a healthy walking time series was found to be the lowest value in that
study [7]. Although both SampEn and ApEn quantify the regularity of a time series,
methods of calculation are different [5]. However, ApEn results of this study sug-
gests that the pathologic gait having higher ApEn is more random than healthy physi-
ologic gait having lower ApEn. Nonlinear index like ApEn which probe a dynamical
property of human gait control, has, therefore, implications for quantifying and mod-
elling gait control under various conditions. Further investigation should be carried
out to derive additional nonlinear variability indexes of human gait.
Acknowledgements
MFC gait data for this study were taken from VU Biomechanics Unit. Several people
have contributed to the creation of the gait database, especially Simon Taylor of the
VU Biomechanics Unit.
150

References
1. Pincus SM, Goldberger AL, : Physiological time-series analysis: what does regularity
quantify? Am J Physiol, (1994) 266:H1643-H1656.
2. Pincus S: Approximate entropy (ApEn) as a complexity measure. Chaos , (1995) 5:110-
117.
3. Brennan, M., Palaniswami, M. and Kamen, P.W.: Do existing measures of Poincaré plot
geometry reflect nonlinear features of heart rate variability? IEEE Trans. Biomed. Eng.,
(2001) vol. 48, pp. 1342-1347.
4. R. J. Best, R. K. Begg, and L. Dell’Oro: The probability of tripping during gait. Int. Soc.
Biomech. Conf., (1999) Calgary, AB, Canada.
5. Richman JS, Moorman JR: Physiological time series analysis using approximate
entropy and sample entropy. Am J Physiol Heart Circ Physiol, (2000) 278: H2039-H2049.
6. Begg R.K, Palaniswami M., and Owen B.: “Support vector machine for automated gait
classification. IEEE Trans. Biomed. Eng., (2005) vol. 52, No. 5 pp. 828-837.
7. Costa M, Peng C-K, Goldberger AL, Hausdorff JM.: Multiscale entropy analysis of human
gait dynamics. Physica A (2003);330:53-60.
8. Winter, D. : The Biomechanics and Motor Control of Human Gait: Wormal, Elderly and
Pathological.Waterloo: University of Waterloo Press (1991).
9. Begg RK, Best RJ, Taylor S & Dell'Oro L:Minimum foot clearance during walking:
Strategies for the minimization of trip-related falls. In Press (2006) Gait and Pos-
ture.
151
