
Toward Automatic Defects Clustering in Industrial
Production Process Combining Optical Detection and
Unsupervised Artificial Neural Network Techniques
Matthieu Voiry
1,2
, Kurosh Madani
1
, Véronique Amarger
1
and François Houbre
²
1
Images, Signals, and Intelligent System Laboratory
(LISSI / EA 3956), Paris-XII – Val de Marne University,
Senart Institute of Technology, Avenue Pierre Point, Lieusaint, 77127, France,
2
SAGEM REOSC
Avenue de la Tour Maury, Saint Pierre du Perray, 91280, France
Abstract. A major step for high-quality optical surfaces faults diagnosis con-
cerns scratches and digs defects detection and characterization in products. This
challenging operation is very important since it is directly linked with the pro-
duced optical component’s quality. A new scratches and digs defects detection
and characterization method exploiting Nomarski microscopy issued imaging
has been developed. The items detected using this high-performance approach
can correspond to real defects on the structure but some dusts and cleaning
marks are detected too. Thus, a classification phase is necessary to complete
optical devices diagnosis. In this paper, we describe a data extraction method,
which supplies pertinent features from raw Nomarski images issued from in-
dustrial process. Then we apply this method to construct a database from real
images. Finally we analyse the pertinence of features and the complexity of ob-
tained database by clustering operation using an unsupervised Self Organizing
Maps technique.
1 Introduction
We are involved in the fault diagnosis of optical devices in industrial environment. In
fact, faults detection and issued information processing are among chief phases for
succeeding in such diagnosis. This paper focuses mainly on these two aspects with a
particular attention on scratches and digs defects, which are among the most frequent
shortcomings in high-tech optical devices. These kinds of aesthetic flaws, shaped
during different manufacturing steps, could provoke harmful effects on optical de-
vices’ functional specificities, as well as on their optical performances by generating
undesirable scatter light, which could seriously degrade the expected optical features.
Taking into account the above-mentioned points, a reliable diagnosis of these defects
in high-quality optical devices becomes a crucial task to ensure products’ nominal
specification and to enhance the production quality. Moreover, the diagnosis of these
defects is strongly motivated by manufacturing process correction requirements in
Voiry M., Madani K., Amarger V. and Houbre F. (2006).
Toward Automatic Defects Clustering in Industrial Production Process Combining Optical Detection and Unsupervised Artificial Neural Network
Techniques.
In Proceedings of the 2nd International Workshop on Artificial Neural Networks and Intelligent Information Processing, pages 25-34
DOI: 10.5220/0001223100250034
Copyright
c
SciTePress

order to guarantee mass production (repetitive) quality with the aim of maintaining
acceptable production yield.
Unfortunately, detecting and measuring such defects is still a challenging dilemma
in production conditions and the few available automatic control solutions remain
ineffective. That’s why, in most of cases, the diagnosis is performed on the basis of a
human expert based visual inspection of the whole production. However, this usual
solution suffers from several acute restrictions related to human operators’ intrinsic
limitations (reduced sensitivity for very small defects, detection exhaustiveness al-
teration due to attentiveness shrinkage, operators’ tiredness and weariness due to
repetitive nature of fault detection and fault diagnosis tasks).
To overcome these problems we propose an approach based on Nomarski micros-
copy issued imaging [1]. This method provides robust detection and reliable meas-
urement of outward defects, making plausible a fully automatic inspection of optical
products. However, the above-mentioned detection process should be completed by
an automatic classification system in order to discriminate the “false” defects (cor-
rectable defects) from “abiding” (permanent) ones. In fact, because of industrial envi-
ronment, a number of correctable defects (like dusts or cleaning marks) are usually
present beside the potential “abiding” defects. That is why the association of a faults
classification system to the aforementioned detection module is a foremost supply to
ensure a reliable diagnosis. Since they have shown many attractive features in com-
plex pattern recognition and classification tasks [2] [3], neural network based tech-
niques will be used to solve this challenging task. Relevant data extraction is a key
issue to ensure the accuracy of a classification scheme. In this paper, a method in two
phases is proposed: the first one consists in extracting items from Nomarski image;
the second one allows coding each isolated item. Consequently the suggested classifi-
cation process is described in broad outline in the diagram of Figure 1.The present
article deals also with the pertinence of proposed information coding method and
with the structure of obtained data, using the Self-Organizing Maps.
Fig. 1. The block diagram of the proposed defect classification scheme.
This paper is organized as follows: in the next section, the Nomarski microscopy
technique used to properly detect the defects and its advantages are presented. Then,
in Section 3, we describe the proposed method to extract pertinent data from raw
Nomarski images. The Section 4 deals with the data analysis methods. In Section 5,
some investigations on real industrial data are carried out and the obtained results are
discussed. Finally, the last section will conclude the presented work and will give a
number of perspectives.
Nomarski's microscopy
issued
Images
Defect's Image
Defect's
Features
Defect's Nature
CLASSIFICATIONDATA EXTRACTIONDETECTION
26
2 Defects Detection Method
Detecting defects as small as 1µm in an efficient and robust way is a challenging task.
In order to overcome this difficulty, an approach based on Nomarski microscopy is
proposed.
2.1 Nomarski Mcroscopy Tchnique.
The Nomarski microscopy, known also as “Differential Interference Contrast” mi-
croscopy (DIC), is a differential interference technique [4]. The principle of this tech-
nique is to laterally split the incident electromagnetic wave into two waves each in-
fluenced by a close but separate part of the specimen, and then to recompose these
two waves to obtain an interference figure. Imaging a given surface with such a mi-
croscope leads to interference figure displaying the studied surface’s gradient related
information [5]. Figure 3 a) gives an example of a Nomarski microscopy issued im-
age.
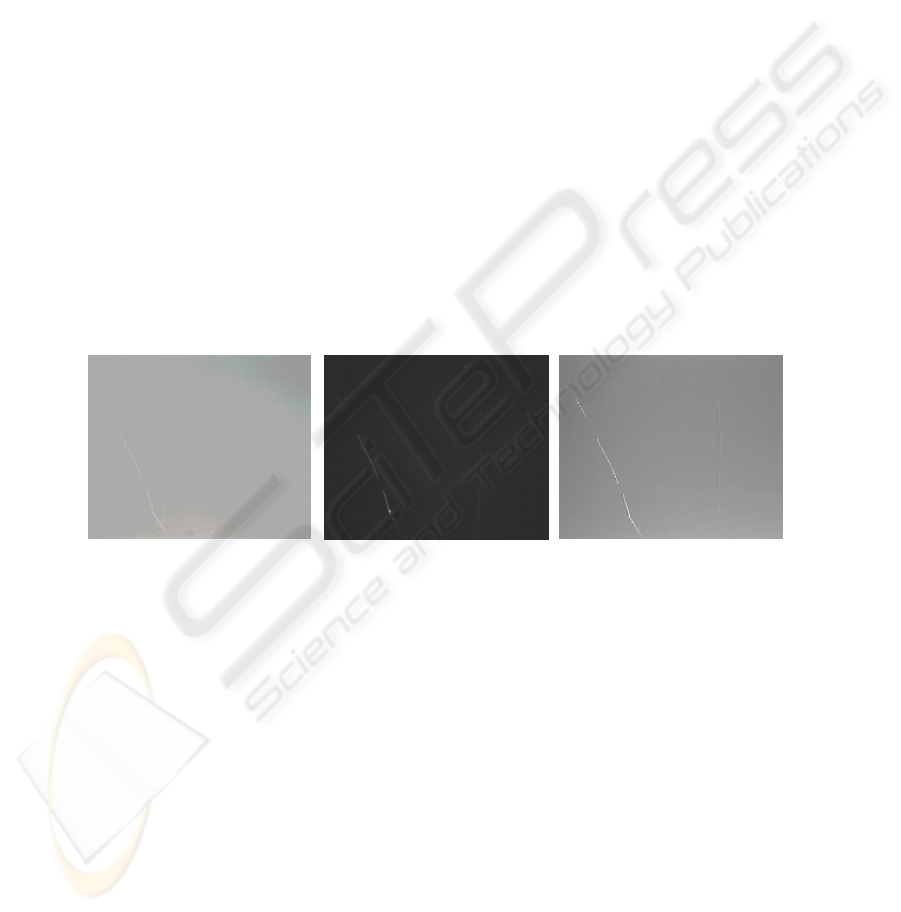
Three main advantages distinguish DIC microscopy from other microscopy tech-
niques. The first of them is related to the higher sensitivity of this technique compar-
ing to the other classical microscopy techniques (Dark Field, Bright Field
[6]). Figure
2 shows a comparative example: the two scratches on the right of the image can only
be observed by DIC microscopy. In fact, DIC microscopy allows detecting defects
attaining 1 nm depth.
Fig. 2. The same microscope field image obtained by a) Left: Bright Field microscopy; b)
Middle: Dark Field microscopy; and c) Right: Nomarski microscopy.
Furthermore, the DIC microscopy is robust regarding lighting non-homogeneity
while Bright Field and Dark Field are not. Finally, this technology provides informa-
tion relative to depth (3-th dimension), which could be exploited to typify roughness
or defect’s depth. This last advantage offers precious additional potentiality to charac-
terize scratches and digs flaws in high-tech optical devices. Therefore, Nomarski
microscopy seems to be a suitable technique to detect surface imperfections.
2.2 Items Detection.
A new method to exploit images issued from such technology has been developed
[1]. It provides robust, reliable and accurate detection and dimensional characteriza-
27
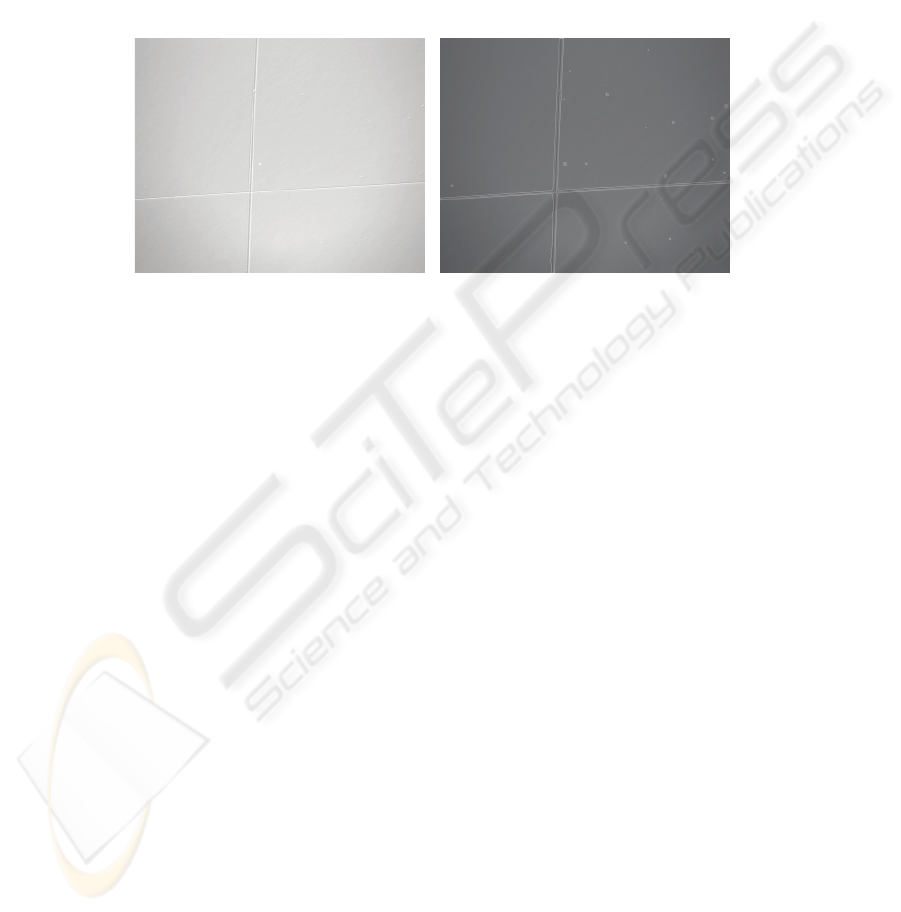
tion of items (Figure 3).We have demonstrated the pertinence of suggested approach
by applying this concept to automatically control quality of a SAGEM product. Since
this method uses an adaptive matching phase exploiting physical considerations, it
allows the detection of all items deeper than roughness range. It ensures that all de-
fects to detect actually are; however, as it has been mentioned before, it implies that
some other items (among which, dust or cleaning marks) could also be detected as
plausible defects. That is why the classification of detected items remains a chief
necessity for an efficient automatic control system able to diagnose defects on optical
devices.
Fig. 3. a) Left: Image obtained from DIC microscopy; b) Right: The same image after item
detection processing.
3 Relevant Data Extraction Method
In order to obtain exploitable data for a classification scheme, we first need to extract
relevant information from raw Nomarski microscopy issued images. We propose to
proceed in two steps: first a detected items images extraction phase and then an ap-
propriated coding of the extracted images.
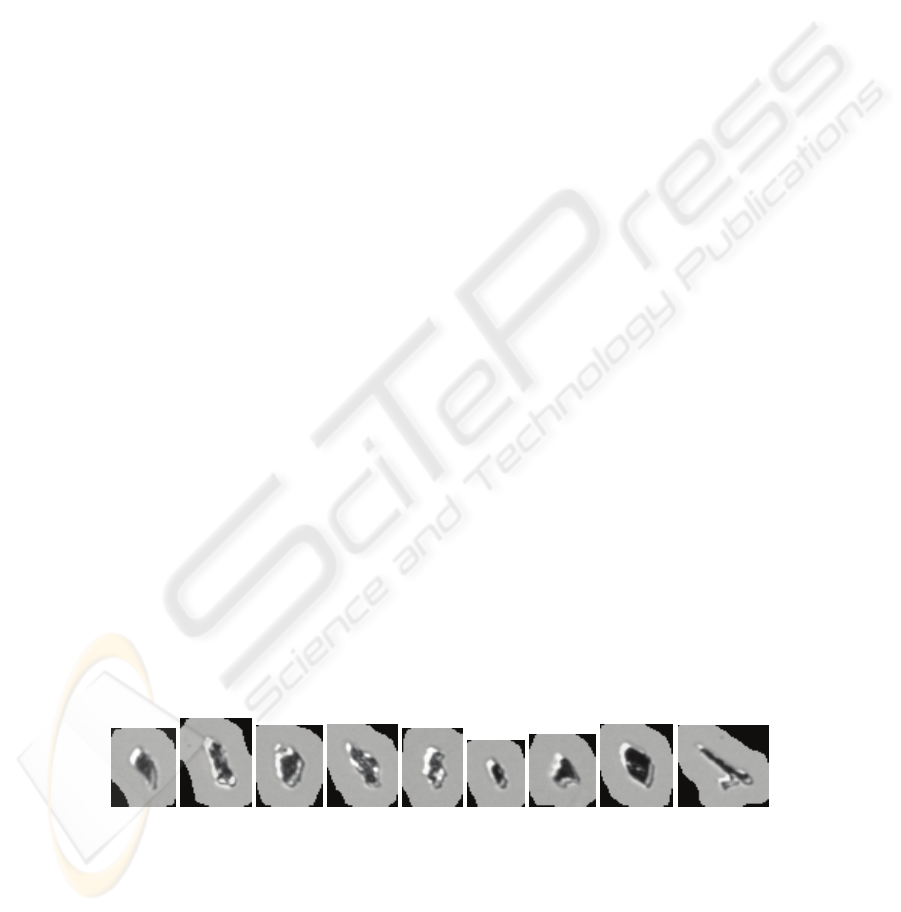
The image associated to a given detected item is constructed considering a stripe of
ten pixels around its pixels. Thus the obtained image gives an isolated (from other
items) representation of the defect (e.g. depicts the defect in its immediate environ-
ment). Figure 4 gives four examples of detected items images using the aforemen-
tioned technique. These images have been generated using the detection step de-
scribed in Section 2, performed on raw images of an optical device in industrial envi-
ronment. It shows different characteristic items which could be found on such device.
The information contained in such images is highly redundant. Furthermore, the
generated images don’t have necessarily the same dimension (typically this dimension
can turn out to be hundred times as high). That’s why these raw data (images) cannot
be directly processed, and have to be appropriately encoded. This is done using a set
of transformations described bellow.
28

a) b) c) d)
Fig. 4. Images of different characteristic items: a) scratch; b) dig; c) dust; d) cleaning marks.
An appropriate transformation is applied on the image in order to extract pertinent
non-redundant information. Such transformation must naturally be invariant to geo-
metric transformations (translation, rotation and scaling) and robust regarding differ-
ent perturbations (noise, luminance variation and background variation). Fourier-
Mellin transform is used as it provides invariant descriptors, which are considered to
have good coding capacity in classification tasks (see [7]). The Fourier-Mellin trans-
form of a function
);(
θ
rf , in polar coordinates, is given by relation (1), with q∈ Z,
s = σ + ip ∈ C (see[8]):
∫∫
∞
==
−
−=
0
2
0
1
);()exp();(
r
s
f
ddrrfiqrsqM
π
θ
θθθ
(1)
In [9], is proposed a set of features invariant on geometric transformation:
[]
[
]
q
f
q
f
s
fff
MMMsqMsqI );1();1();0();();(
σσσ
σ
−
−
=
(2)
In order to calculate efficiently Fourier-Mellin transform using discrete Cartesian
coordinates, we perform the convolution of the image with an appropriate filters
bench proposed in [10]:
),(),();(
00
)(1
,
2
max
22
llkkflkhipqM
rlk
kl
qpf
−−≈+
≤+≤
∑
∑
σ
(3)
where
);( jif
is the grey-level of pixel whose Cartesian coordinates are
);( ji
,
);(
00
lk are the Cartesian coordinates of the image’s centre of gravity,
max
r is the maximal radius of the image, and where :
2
1
22
22
,
)(
)arctan()ln(
2
exp
),(
σ
−
+
⎟
⎟
⎠
⎞
⎜
⎜
⎝
⎛
⎥
⎦
⎤
⎢
⎣
⎡
⋅−+
=
lk
k
l
qlk
p
i
lkh
qp
(4)
Finally, the processed features have to be normalized. In this purpose, we use the
centring-reducing transformation, modifying each feature
i
F as follows:
29

σ
MF
F
i
i
−
=
(5)
where M is the mean value of the feature
i
F over the database and σ its standard
deviation.
In order to evaluate the number of degrees of freedom of features, the Grassber-
ger-Procaccia algorithm [11] is used.
d
42 samples, where d is the true intrinsic di-
mension of the features, are necessary to properly evaluate this dimension [12].To
overcome this limitation, we process an approached value of the dimension (underes-
timated).
4 Data Analysis Method
In the aim of studying the structure of space described by database and evaluating the
pertinence of adopted data coding scheme, we perform a clustering operation using an
unsupervised neural network technique, the Self-Organizing Map (SOM) [13]. This
algorithm projects a multidimensional space into a low-dimensional representation.
Typically a SOM consists of a two dimensional grid of neurons. A vector of features
is associated with each neuron. During the training phase, these vectors are tuned to
represent training data. Similar data are projected to the same or nearby neurons in
the SOM, while different ones are mapped to neurons located further from each other,
resulting in clustered data. Thus SOM is an efficient tool for quantizing the data space
and projecting this space onto a low-dimensional space, while conserving its topol-
ogy. SOM is often used in industrial engineering [14], [15] to characterize high-
dimensional data or to carry out classification tasks.
Since the considered space has a dimension (number of features) greater than 2, we
cannot show directly the neurons in the weights space. To properly project neurons
grid onto a 2-dimensional representation, we use the curvilinear representation intro-
duced in [16]. It consists in representing the neurons by their curvilinear coordinates
on the surface described by the neurons grid in the weights space.
The evaluation of the quality of non-linear projection of the data space onto the
neurons grid space is performed by studying, for each pair of neurons, the distance dx
between this two neurons in the data space versus the distance dy between this two
neurons in the grid space [17]. For each couple of neurons
);( ji we draw a point
)),();,(( jidxjidy where
ji
xxjidx
r
r
−=),( and
ji
yyjidy
r
r
−=),( .
k
x
r
(resp.
k
y
r
) is the vector of features corresponding to the k-th neuron in the data
space (resp. in the grid space). If the topology of the data space is not well respected,
dx is not related to dy and we obtain a diffuse cloud of points. On the contrary, if the
neurons organization is correct, the drawn points are almost arranged along a straight
line.
30
5 Implementation and Validation on Industrial Data
We carried out an experiment on real data which allows us to study:
• the pertinence of the chosen raw data coding method,
• the complexity of the data space,
• the ability of SOM to map and clusterize this space.
5.1 Experimental Set-up
5000 items images were extracted from raw Nomarski images acquired during two
scans on two different optical devices (it represents 1180 microscopic field images
and an approximate surface of 28 cm²). Nomarski microscopy issued images were
supplied by Olympus BX52 microscope combined with a Corvus stage, which allows
scanning of optical piece. 50x magnification was used that leads to microscopic
1,77mm x 1,33 mm fields and 1,28µmx1,28µm sized pixels. The two studied devices
were not specially cleaned, what accounts for the presence of some dusts and clean-
ing marks. Images were coded using the Fourier-Mellin transform with
0=
σ
and
{}
);1()0;0/(),(),( PpPQqPpqpqpq
≤
≤
−
≤
≤
∪
≤
≤=∈
where
1=
P
and
2=Q
(see Equation 2). Such transform provides a set of 13 features for each defect.
Using the Grassberger-Procaccia algorithm we found out that the studied features
have an intrinsic dimension about 7. Then we trained a Self Organized Map with the
defects database. SOM’s neurons are arranged along a 15 x 7 rectangular grid and the
distance between two neurons is the classical Euclidean distance. The shape of the
grid has been set experimentally by maximizing topology conservation (by the study
of the dy-dx graphs).
5.2 Results and Discussion
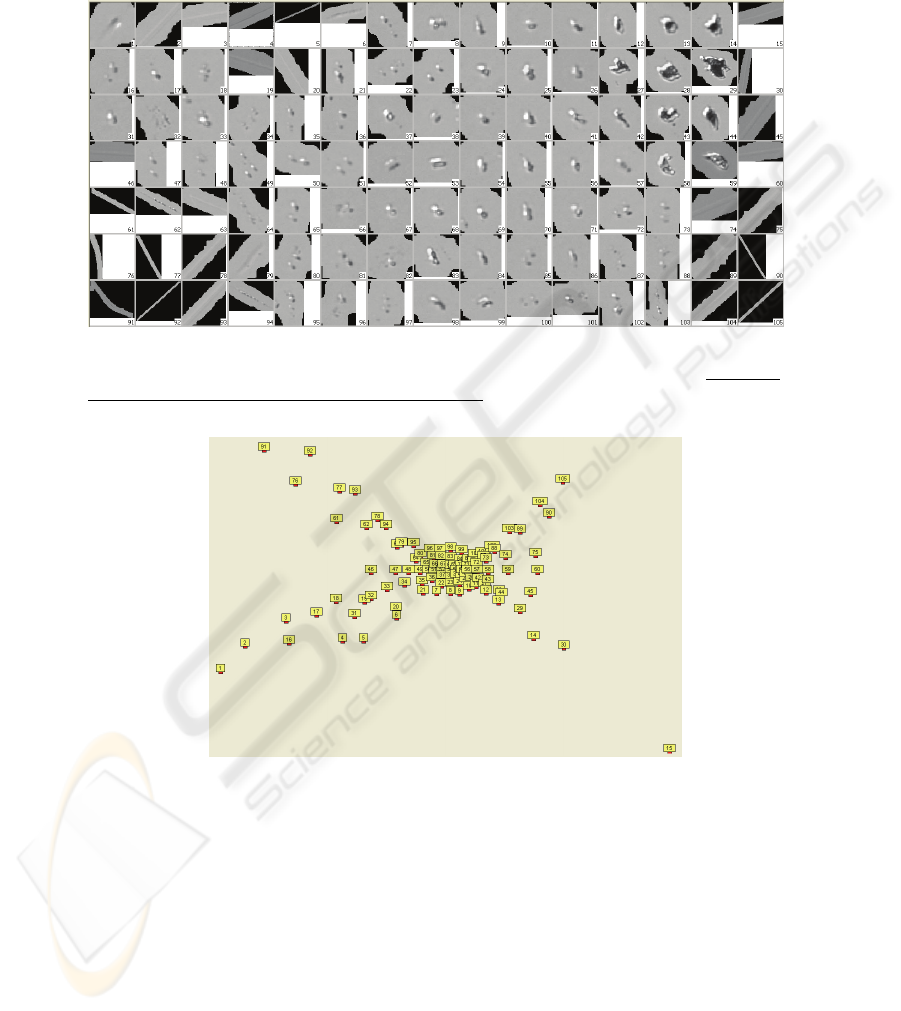
Figure 6 shows the raw grid of neurons. The similarities between adjacent nodes are
apparent and some clusters of similar data are identified. Moreover, in major cases,
database items projected in the same neurons have the same appearance; an example
is presented in the Figure 5. Such defects probably belong to the same class of de-
fects. Thus, the performed clustering operation seems relevant. However, data pro-
jected onto neurons which are near “natural” class boundaries, are sometimes hetero-
geneous.
Fig. 5. Some items corresponding to the 28
th
neuron.
31
The curvilinear representation, which emphasizes the distance between the nodes of
the grid (Figure 7) shows that neurons corresponding to scratches are clearly separate
from the others.
Fig. 6. Representation of the map (the depicted defect for each node is chosen randomly among
the examples of the database which are projected onto the node under consideration; the size of
images is normalized, so the real scale is not respected).
Fig. 7. Curvilinear representation of the SOM’s neurons (the number associated with each
neuron is the same as in the Figure 6). It highlights the relative distances between neurons in
the weights space.
Finally, we check the accuracy of the projection using the dy-dx representation. As
shown in Figure 8, the curve constituted by averages of dx for each dy is uniformly
monotonic; it means that the topology of data space is kept, on the whole. However,
we can see that the group of dots is relatively diffuse. This can be explained by the
fact that the projection of a space of intrinsic dimension 7 onto a bidimensional space
is necessarily imperfect!
32
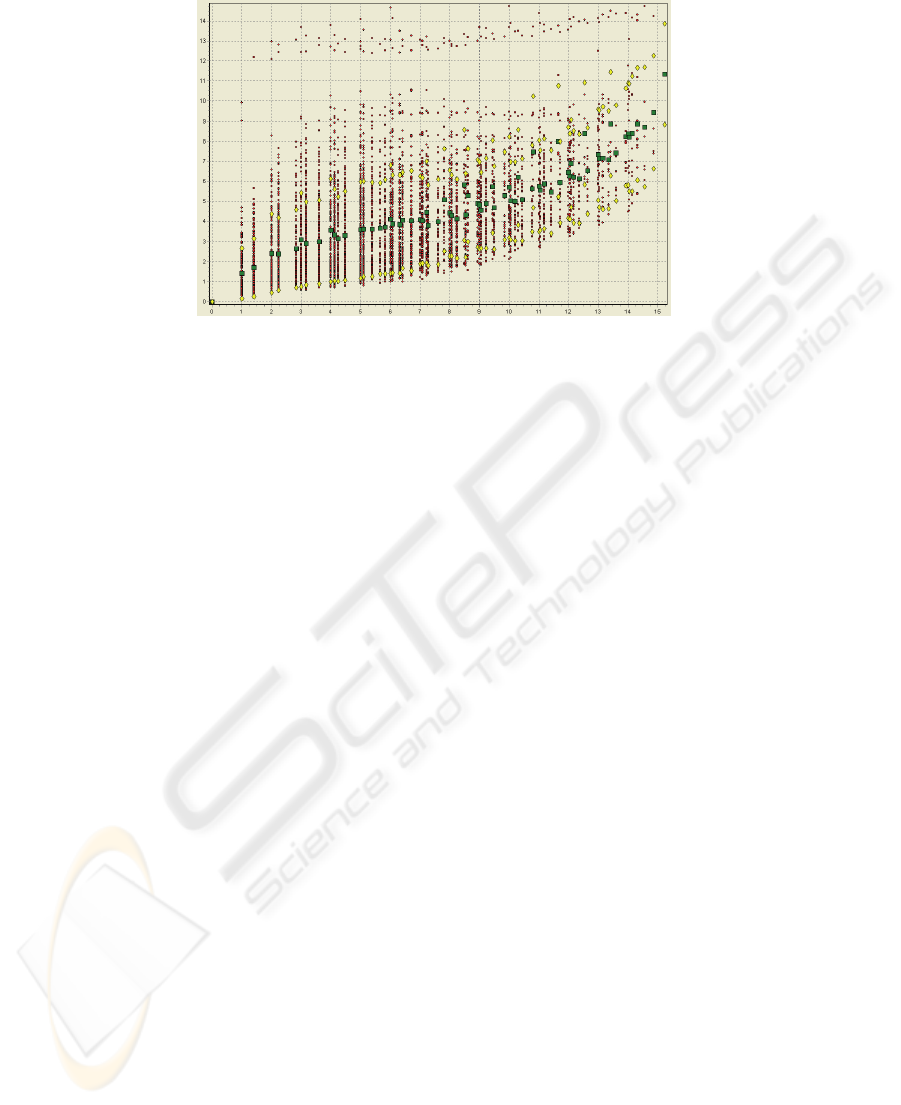
Fig. 8. dy-dx representation of SOM (mean □ and standard deviation ◊ of dx are also repre-
sented for each dy). It depicts the relative distances between neurons in the grid space (ab-
scissa) versus in the weights space (ordinate).
First, since the described experiment shows the emergence of well-founded clustering
and consistent clusters of data, the proposed data coding scheme is pertinent. How-
ever, using shape features (like binary Fourier-Mellin invariants) in conjunction with
texture features (like wavelet coefficients) could also be attractive. Furthermore, if the
structure of database is highly non-linear, the used centring-reducing normalization is
certainly a suboptimal solution. On the other hand, since we work with a high-
dimensional data space and even if we obtain a correct representation of data space
with a 2 dimension SOM, using a greater dimension SOM can probably improve the
results. There are also limitations using SOM: first the neuron grid’s structure is set a
priori and unfortunately such a structure, if not suited to the data distribution shape,
leads to inappropriate projection. Moreover, SOM provides a discrete projection onto
a low-dimensional space, but it could be desirable to continuously project data.
6 Conclusion and Perspectives
A reliable diagnosis of the aesthetic flaws in high-quality optical devices is a crucial
task to ensure products’ nominal specification and to enhance the production quality
by studying the impact of the process on such defects. We propose an approach based
on Nomarski microscopy, which provides robust detection and reliable measurement
of outward defects. To ensure a reliable diagnosis, this process should be completed
by an automatic classification system in order to discriminate the “false” defects (cor-
rectable defects) from “abiding” (permanent) ones. We first need to extract relevant
information from raw Nomarski image, to obtain exploitable data for a classification
scheme. This paper has presented a data extraction method and studied a real database
using SOM. It can be compared with [18] (use of Fourrier-Mellin transform for data
coding in an artificial neural network based pattern recognition system)
or [19] (use of
SOM for pattern recognition tasks). Since well-founded clusters and pretty homoge-
neous neuron associated data are exhibited, the proposed method is pertinent. On the
33

other hand, using SOM is in itself attractive, because it allows exploiting non-labelled
samples (without expert intervention). However, data projected onto neurons which
are near “natural” class boundaries, are sometimes heterogeneous. If this problem is
overcome, classification could be directly completed by expert neuron labelling [20].
SOM can also constitute an efficient pre-processing phase for a finer classification.
References
1. M. Voiry, F. Houbre, V. Amarger, and V. Madani: Toward Surface Imperfections Diagno-
sis Using Optical Microscopy Imaging in Industrial Environment. ACD Workshop on Ad-
vanced Control and Diagnosis – IAR-ICD 2005, pp. 139-144 (2005)
2. G. P. Zhang: Neural Networks for Classification: A Survey. IEEE Trans. on Systems, Man,
and Cybernetics - Part C: Applications and Reviews, vol. 30, no. 4, pp. 451-462 (2000)
3. M. Egmont-Petersen, D. de Ridder, and H. Handels: Image Processing with Neural Net-
works - A Review. Pattern Recognition, vol. 35, pp. 2279-2301 (2002)
4. P. Bouchareine: Métrologie des Surfaces. Techniques de l'Ingénieur, vol. R1390 (1999)
5. T. J. Holmes and W. J. Levy: Signal-processing Chracteristics of Differential-Interference-
Contrast Microscopy. Applied Optics, vol. 26, no. 18, pp. 3929-3939 (1987)
6. P. E. J. Flewitt and R. K. Wild: Light Microscopy. in Physical Methods for materials char-
acterisation (1994)
7. A. Choksuriwong, H. Laurent, and B. Emile: Comparison of invariant descriptors for object
recognition. IEEE International Conference on Image Processing (ICIP) pp. 377-380
(2005)
8. S. Derrode, "Représentation de Formes Planes à Niveaux de Gris par Différentes Approxi-
mations de Fourier-Mellin Analytique en vue d'Indexation de Bases d'Images." Phd Thesis
- Université de Rennes I (1999)
9. F. Ghorbel: A Complete Invariant Description for Gray Level Images by the Harmonic
Analysis Approach. Pattern Recognition, vol. 15, pp. 1043-1051 (1994)
10. G. Ravichandran and M. Trivedi: Circular-Mellin features for texture segmentation. IEEE
Trans. Image Processing, vol. 4, pp. 1629-1640 (1995)
11. P. Grassberger and I. Procaccia: Measuring the strangeness of strange attractors. Physica,
vol. D9, pp. 189-208 (1983)
12. F. Camastra and A. Vinciarelli: Intrinsic Dimension Estimation of Data: An Approach
Based on Grassberger-Procaccia's Algorithm. Neural Processing Letters, vol. 14, no. 1, pp.
27-34 (2001)
13. T. Kohonen: Self Organizing Maps, 3rd edition ed. Berlin: Springer (2001)
14. T. Kohonen, E. Oja, O. Simula, A. Visa, and J. Kangas: Engineering Applications of the
Self-Organizing Maps. Proceedings of the IEEE, vol. 84, no. 10, pp. 1358-1384 (1996)
15. J. Heikkonen and J. Lampinen: Building Industrial Applications with Neural Net-
works.,Proc.European Symposium on Intelligent Techniques, ESIT'99 (1999)
16. P. Demartines: Organization Measures and Representations of Kohonen Maps.,First IFIP
Working Group Workshop (1992)
17. P. Demartines and F. Blayo: Kohonen Self-Organizing Maps:Is the Normalization Neces-
sary? Complex Systems, vol. 6, no. 2, pp. 105-123 (1992)
18. Y. Sheng and C. Lejeune: Invariant pattern recognition using Fourier-Mellin transforms
and neural networks. Journal of Optics, vol. 22, no.5, pp. 223-228 (1991)
19. J. Lampinen and E. Oja: Distortion Tolerant Pattern Recognition Based on Self-Organizing
Feature Extraction. IEEE Trans. on Neural Networks, vol. 6, pp. 539-547 (1995)
20. O. Silvén, M. Niskanen, and H. Kauppinen: Wood Inspection with Non-Supervised Clus-
tering. Machine Vision and Applications, vol. 13, no. 5, pp. 275-285 (2000)
34
