
EMBEDDED FPGA SOLUTION FOR WATER QUALITY
MONITORING SYSTEM
Calibration and Measurement
1,2
Octavian Postolache,
1,2
Miguel Dias Pereira,
1
Pedro Girão
1
Instituto de Telecomunicações, Av. Rovisco Pais, 1049-001, Lisboa, Portugal
2
EST Setúbal LabIM/IPS, Rua do Vale de Chaves, Estefanilha, 2914-508, Setúbal, Portugal
Keywords: Reconfigurable measuring system, calibration control, real-time processing.
Abstract: This paper presents a field operating water quality monitoring system based on real time controller and
FPGA module. The system features functioning includes in-situ automatic cleaning and calibration of stand
alone sensors such as turbidity, pH or conductivity, on-line measurement of water quality parameters using
the calibrated sensors. In order to perform the above mentioned calibration and measurement tasks the
system uses a set of centrifugal pumps and electrovalves and associated embedded control materialized by
the LabVIEW programmed FPGA module. The voltages associated with water quality measurement
channels are acquired using a four channels analog input module that work also under FPGA control. The
data processing tasks are distributed between the FPGA module and the real-time controller included in the
system. A practical approach concerning the sensor model implementation capabilities using the real-time
controller (NI cRIO-9002) or FPGA (NI cRIO-9003) is also included. In order to provide the wireless
remote control of the system an Ethernet – wireless bridge (IEEE802.11g) and client-server TCP software
developed in LabVIEW were included in the system. A PDA based remote control solution was also
implemented to evaluate system performance.
1 INTRODUCTION
Real time monitoring and water quality assessment
of surface waters represents nowadays an important
challenge associated with water quality assurance
and requires measuring systems with multiple
measuring nodes with calibration facilities.
The systems architectures generally includes
different measuring nodes, installed at different
points of the monitored area, that includes sensors
able to output information related with the quantities
elected to characterize water quality and the
hardware required to power the sensors and to
process their outputs. Data collected at the different
nodes is preferably transmitted to a central land-
based station where it is further processed to yield
the desired information. The nodes must then also
include hardware for data transmission and usually
some kind of processing unit (e.g. microcontroller)
able not only to format data for transmission but also
to transform sensors’ output voltages into values of
the measured quantities. In previous papers, the
authors have presented solutions of distributed
measuring systems for water quality monitoring and
assessment (Postolache, 2002, Postolache 2003,
Girao, 2003, Postolache, 2005).
The quantities commonly used in the assessment of
water quality are: temperature, pH, conductivity,
turbidity, dissolved oxygen, and heavy metals
concentration. With the exception of temperature,
the performance of the sensors for these quantities is
highly dependent on periodic cleaning and
calibration.
Considering the calibration and measurement
requirements associated with water quality
measurement nodes the present work propose a
novel architecture based on a reconfigurable control
and acquisition system (NI CompactRIO). The
system permits accurate timing and the control of
several pumps and electrovalves associated with
water quality sensor (e.g. conductivity) test or
calibration for different standard solutions. Data
acquisition, data processing and data communication
are additional capabilities of the presented system.
Considering the field operation conditions and the
Wi-Fi compatibility of the presented system a
mobile solution based on a PDA is developed in
154
Postolache O., Dias Pereira M. and Girão P. (2006).
EMBEDDED FPGA SOLUTION FOR WATER QUALITY MONITORING SYSTEM - Calibration and Measurement.
In Proceedings of the Third International Conference on Informatics in Control, Automation and Robotics, pages 154-160
DOI: 10.5220/0001221301540160
Copyright
c
SciTePress
order to perform tasks such as water quality data
reading, start/stop calibration or measuring, fault or
pollution events checking, calibration or measuring
control, fault or pollution events detection and
diagnosis.
2 SYSTEM HARDWARE
The water quality field measurement system
includes as the main parts: a set of water quality
measurement channels (temperature, pH,
conductivity and turbidity) connected to high
accuracy analog input module plug in NI cRIO-9103
FPGA reconfigurable chassis that communicate
through the PC bus with NI CompactRIO 9002 real
time controller (National Instruments, 2005).
Additional digital output modules assure the control
of the system pumps and electrovalves, devices that
are actuated when the system works in calibration or
measuring mode. In order to distribute the data and
to receive the control commands an Ethernet to
wireless bridge is connected to the cRIO Ethernet
port. Data access, calibration and measurement
commands can be sent using a PDA Pocket PC (HP
iPaq 2700) included in the water quality wireless
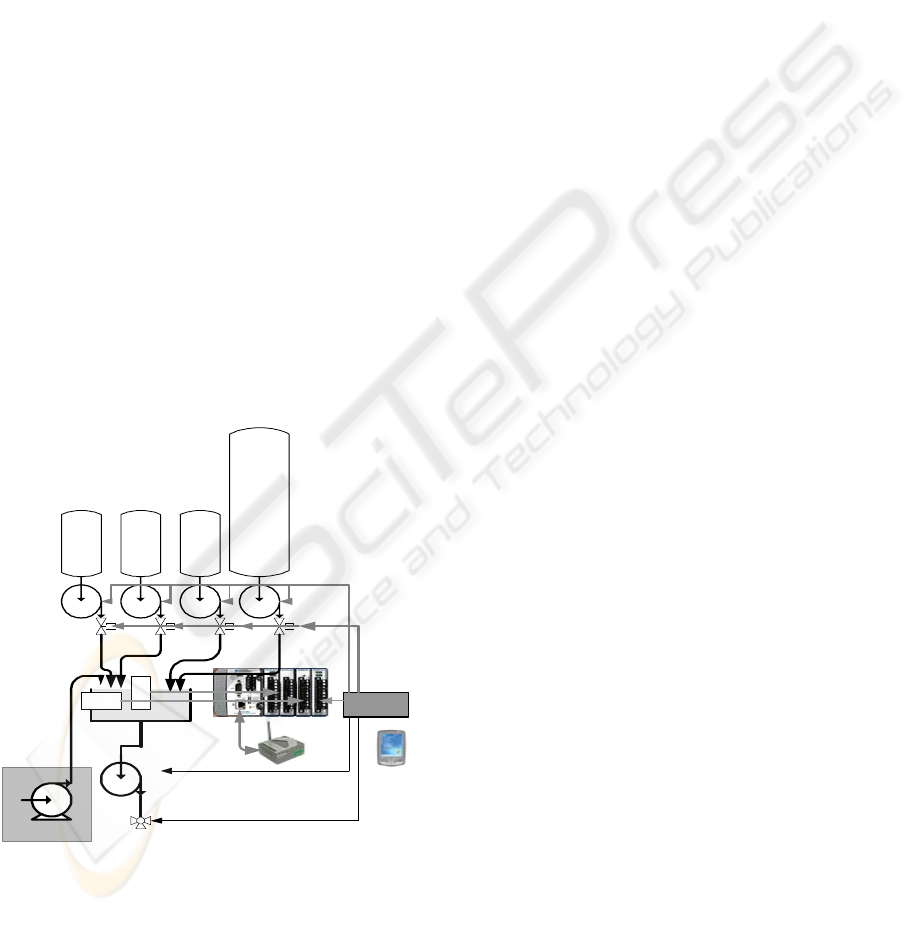
network (Figure 1).
Figure 1 shows the block diagram of the field
operating WQ monitoring system hardware that
includes the main sensing, control and processing
blocks associated with WQ parameters measurement
and the calibration of corresponding sensors such as
turbidity, conductivity and pH. Thus the control is
based on the FPGA reconfigurable I/O hardware (NI
cRIO 9103) which control the system actuators
(pumps and electro-valves) through a NI- cRIO 9472
digital output block, acquires the level information
(on/off) of the liquid (standard calibration solution,
water under test) in the test cuvette using the optical
level sensor connected to one of the digital input of
the NI cRIO 9423 module. In the calibration or
measurement mode the system acquires the voltage
from the WQ measurement channels using four
analog input of the NI cRIO 9215 module.
In Figure 1 the following notations were used: CSi –
calibration solution vessels l, P
1
, P
2
, P
3
, P
4
-
calibration pumps, LS-level sensor, WQ-S water
quality sensor under calibration, CP-cleaning pump,
WP –waste pump, ACTcc- actuator conditioning
circuit block, EVi-calibration electrovalves, CEV-
cleaning electrovalve and M_WEV-measurement
and waste electro-valve. The FPGA module
communicates using the PCI bus with a NI cRIO-
9002 real-time embedded controller characterized by
32 MB DRAM memory and 64 MB of non-volatile
flash storage. The real-time controller permits to
implement advanced processing algorithms (fault
detection, data forecasting, data fusion), WQ file
storage and wireless communication using an
Ethernet to wireless bridge (D-LINK DWL 810)
connected to the Ethernet port.
Considering the communication capabilities the
designed WQ calibration and measurement unit can
be considered as a smart node of WQ monitoring
distributed network that can deliver and receive the
data from different devices such as laptop, desktop
PC or a PDA included in the network. In the present
application special attention was dedicated to the
utilization of the PDA to read current values of the
measurement data delivered by the WQ
measurement system based on cRIO 9002.
As it was presented in Figure.1 the WQ sensor
calibration is performed using a set of standard
calibration solution (e.g. OAKTON pH 4.01, 7 and
10 standard buffer solutions for pH) stored in the
CS
i
calibration vessels and injected in the testing
cuvette using a set of pumps (pumps - Jabsco Pumps
42510-000, 12 VDC, 1.5A, 7.5 l/min) and
electrovalves (Bergamo 0-15 bar, 12 VDC, ¼”) that
work under control of embedded FPGA calibration
program. Additional pumps included in the system
are: the CP pump that is used to pass the cleaning
solution from the cleaning vessel to the test cuvette,
the WP pump is used to empty the test cuvette either
\
L
P
cRIO system
ACTcc
CS1 CS2 CS3
CS
PDA
Pocket
PC
WBridge
EV1 EV2 EV3 CEV
M_WEV
LS
WQ
S
P1 P2 P3 CP
WP
Water
MP
Figure 1: cRIO based embedded system for water
quality measuring and W Q sensor calibration tasks
Figure 1: CRIO based embedded system for water quality
measuring and WQ sensor calibration tasks
EMBEDDED FPGA SOLUTION FOR WATER QUALITY MONITORING SYSTEM - Calibration and Measurement
155

to the waste vessel (calibration phase) or to water
under test (measurement session), and the MP
(measuring pump) that is a submersible pump (1
submersible 12 VDC, 2.5A, 49 l/min Johnson pump)
and used to assure the circulation of the water
between the monitored area (river, estuary) and the
test cuvette
.
3 SYSTEM SOFTWARE
The system software includes two parts, one related
with
the smart calibration and measurement system based
on cRIO real-time controller and FPGA
reconfigurable module and another represented by
the software of the PDA Pocket PC.
The FPGA reconfigurable module software was
developed using LabVIEW for FPGA toolset and is
associated with the pump and electrovalves control
through digital output lines, the level on/off sensor
reading, the acquisition of the water quality sensors
voltage values when the system works in the
measurement mode and the sensor under test voltage
acquisition when the system works in calibration
mode. Using the FPGA onboard memory and the
memory read/write functions the FPGA embedded
algorithms for digital-code voltage to water quality
parameter (e.g. temperature) is carried out.
Taking into account the limitation of the FPGA
related the numerical values calculation (only
integers operation) the main part of processing of the
acquired data is developed on the real-time
controller level using the LabVIEW real-time. Thus
a multichannel voltage-to-WQ conversion block was
implemented. Taking into account temperature
variation influence on the measurement channel
accuracy, the temperature compensation based on
IEEE1451.2 correction engine algorithm was also
implemented.
Data logging software block was implemented on
the cRIO controller in order to store the information
about measured water samples.
Regarding data distribution in the water quality
network that includes the PDA and other PCs
(laptop or desktop PC) the cRIO real-time controller
includes a TCP server-multiple client component.
Implementing client software on the PDA level
using (LabVIEW for PDA) the PDA operator can
obtain the current values of the Water Quality
parameters and the calibration coefficients of the
water quality measurement channels. Calibration
and measurement start-up actions or measurement
channel tests when anomalous functioning is
reported (fault events) can be ordered using the PDA
software component.
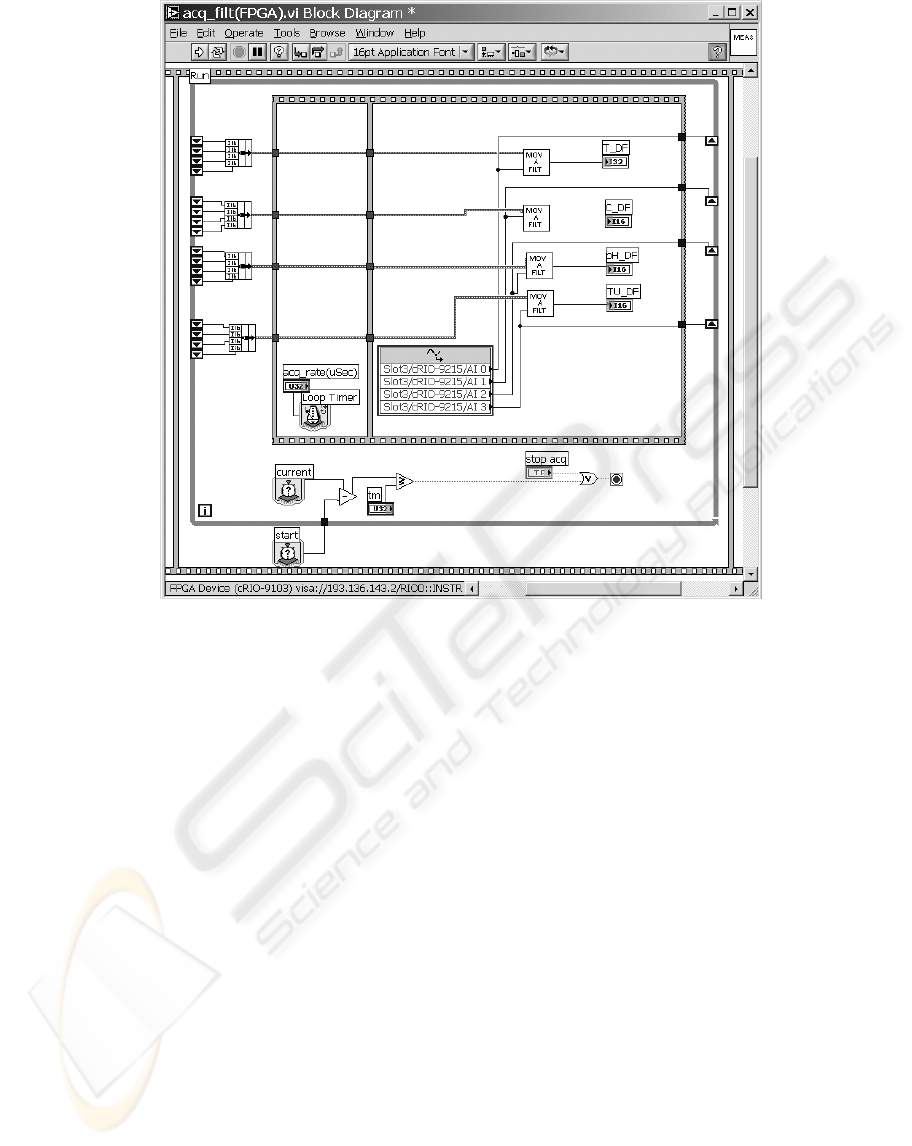
3.1 Embedded FPGA Software
The embedded FPGA software is developed using
the LabVIEW FPGA toolset and is associated with:
electro-valves and centrifugal pumps control, WQ
sensor calibration, water quality measurement, fault
or pollution event detection multi-channel analog-
input and digital input control, digital filtering of
the acquired samples from the WQ measuring
channels associated with NI cRIO-9215 module.
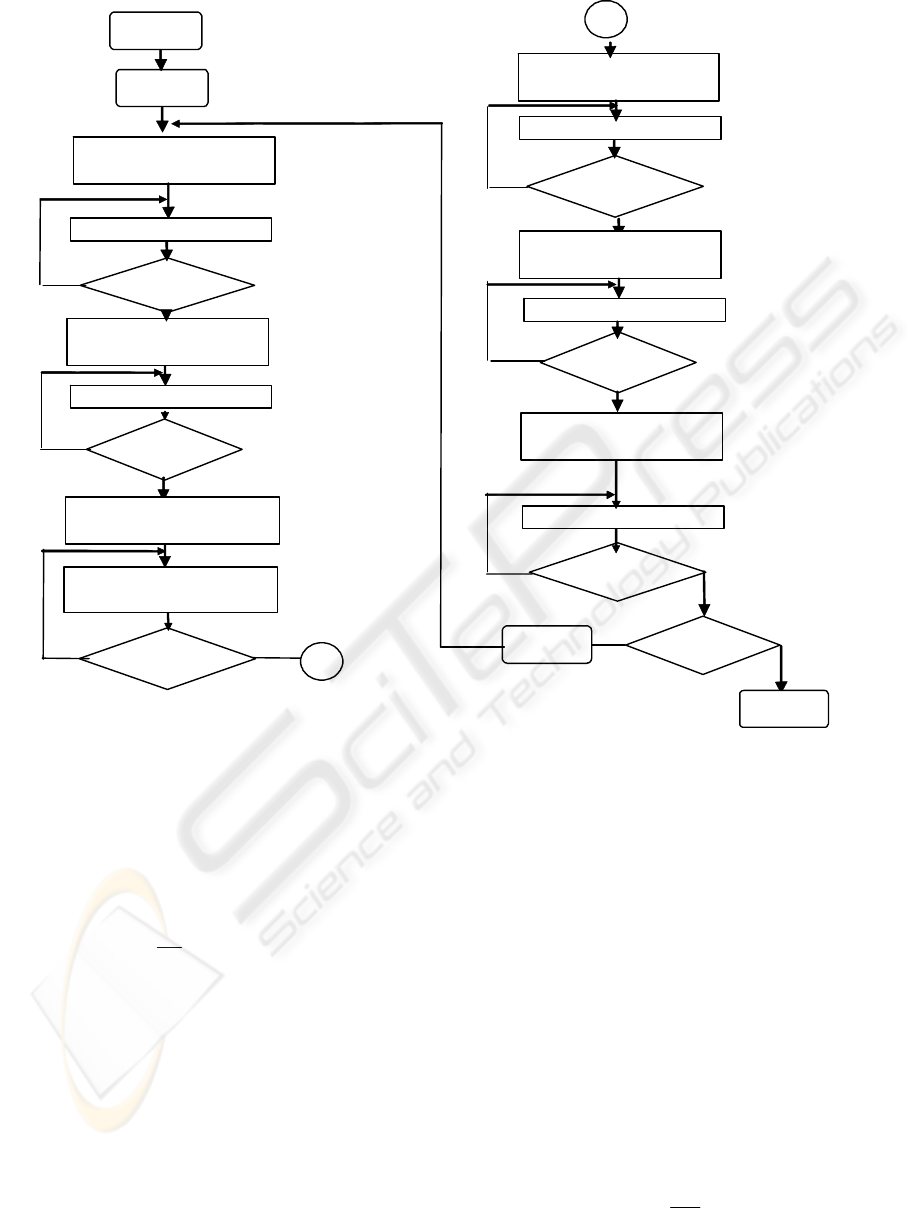
For the particular case of WQ sensor calibration the
flowchart of the calibration session is presented in
Figure 2.
Referring the measuring mode an additional
submersible pump is used to bring the water under
test into the test cuvette and the voltages obtained on
the sensor channels are acquired. The water under
test level on the testing cuvettte is imposed constant
thus a simple on/off control of the WP and M_VEW
is implemented on the system while the level
information is obtained from the LS sensor.
When the system works in the measuring mode and
a strong variation of WQ parameter from one of the
measuring channel is detected (using the derivative
information) the pollution event detection mode is
start-up. In order to make an accurate discrimination
between the pollution and measuring channel
anomalous functioning a “one point test procedure”
is designed and implemented.
The action associated with this procedure is similar
to the calibration of the considered measuring
channel for one standard solution.
A comparison between the current acquired voltage
)(tU
CS
WQ
from the tested channel and reference
voltage value
)(
ref
CS
WQ
tU considered for the same
calibration solution (CS) is carried out.
The fault detection is expressed by the following
relation:
faultWQrefWQWQ
tUtU
ξ
≤− )()( (1)
Thus if the difference between the considered values
is greater than an imposed limit
faultWQ
ξ
(5% of
)(
ref
CS
WQ
tU in the present case) the anomalous
functioning message is delivered in the WQ
monitoring network. In opposite case the pollution
event signal is generated.
In order to increase the SNR (signal to noise ratio)
the acquired samples from the WQ measuring
channels are filtered using a FPGA embedded
ICINCO 2006 - SIGNAL PROCESSING, SYSTEMS MODELING AND CONTROL
156
moving average digital filter algorithm. that is
implemented for each analog input channel of NI
cRIO-9215 module (Figure 3)
∑
−
=
+⋅=
1
0
)(
1
)(
M
j
jTiTx
M
iTy (2)
The effectiveness of the implemented filter is
controlled by selecting the appropriate number of
samples M for the averaged group. For the present
case a M=4 “smoothing factor” was used. Other
filter technique was also implemented in order to
achieve a shorter measurement time and less noise
sensitivity:
()
))1((1)()( TiyFiTxFiTy −⋅
−
+⋅= (3)
where F represents the filtering coefficient varying
between [0,1].
The acquired and smoothed voltages during the t
m
period are sent through PCI communication to the
cRIO-9002 controller where a LabVIEW Real-Time
developed software performs data processing, data
storage and data communication tasks
.
3.2 Real-time Controller Software
The software component associated with the cRIO
real time controller includes the GUI of the system,
the data processing, the data storage and data
communication blocks.
Referring to the data processing block it provides the
digital-code to voltage conversion:
VFS
FS
codeWQV
n
WQ
10,
2
_ =⋅= (4)
Figure 2: Calibration flowchart: U
WQ
j
–voltage associated with the sensor under calibration for the calibration point j,
U
T
– voltage associated with the temperature measuring channel, m – number of calibration points, Δt – time interval
associated with filling and disposal of test cuvette contents, LS –level sensor
level
measuring
next
calibration
LS=0?
standard solution
selection j=1..m
j=1
yes
j
≥
m?
n
o
j=j+1
WP, M_WEV
–
off,
EV
j
-off P
j
-on
mixing of
standard sol.
Δt>Δt
mix
mixing time
measuring
WP, M_WEV
–
off,
EV
j
-on P
j
-on
pumping standard
solution and
measurin
g
the
Δ
t
f
measuring
& primary
p
rocessing
Δt>Δt
m
?
no
y
es
n
o
δ
disposal of
test cuvette
contents
WP, M_WEV
–
off,
EV
j
-off P
j
-off
U
WQij
, U
T
acq. Δt -meas
Data
p
rocessin
g
Δt
meas
LS
meas
yes
Δ
t>
Δ
t
p
?
n
o
WP, M_WEV
–
on,
EV
ij
-on P
ij
-off
Δ
t meas
WP, M_WEV
–
off
CEV-on CP-on
yes
pumping
cleaning
LS=0?
LS meas
level
measuring
n
o
y
es
WP-on, M_WEV
–
off
CEV-on CP-on,
cleaning the
test cuvette
Δ
t>
Δ
t
c
l
?
Δ
t
meas
cleaning time
measuring
n
o
y
es
time
measuring
Start Cal
Stop calib
δ
yes
Figure 2: Calibration flowchart: U
WQ
j-voltage associated with the sensor under calibration for the calibration point j, U
T
-
voltage associated with the temperature measuring channel, m – number of calibration points, ∆t – time interval associate
d
with the filling and disposal of the test cuvette contents, LS – level sensor.
EMBEDDED FPGA SOLUTION FOR WATER QUALITY MONITORING SYSTEM - Calibration and Measurement
157
and voltage to WQ parameter value conversion that
uses the IEEE1451.2 for Smart Transducers
(correction engine) standard (Eidson,1998) given by:
[][ ][ ]
∑∑ ∑
== =
−−−⋅=
)1(
0
)2(
0
)(
0
2211,,
D
i
D
j
nD
p
p
nn
ji
pji
HXHXHXCWQ ……
…
(5)
where X
n
represent the input variable expressed by
acquired voltages from the sensor measurement
channel (U
T
, U
pH
, U
σ,
, U
TU
) in the present case, H
n
the offsets of the input variables, D(k) the degree of
the input X
k
, and C
i,j,..p
the POL
m
coefficients. The
C
i,j, p
coefficients are obtained using the multiple
regression method [11] associated with the latest
calibration of the measurement channel. Thus on the
particular case of considered water quality sensors:
temperature, pH, conductivity and turbidity sensors,
the multivariate relations are used to extract the
following quantities:
;
010
010
1110010
1110010
T
TT
TU
TUTU
TT
TpH
pH
T
pH
pH
pHpH
UCCT
UCCTU
UUCUCUCC
UUCUCUCCpH
+=
+=
+++=
+++=
σ
σσ
σ
σσ
σ
(6)
where U
pH
, U
σ
, U
TU
, U
T
represents the primary
variable associated with pH,
σ, TU, T quantities. At
the same time U
T
represents the perturbing effect
variable for pH and conductivity (
σ) calculation.
The calibration solution for the particular case of
conductivity, assumes the following conductivity
values
σ={80 uS/cm, 447uS/cm, 1413 uS/cm and
2070 uS/cm} and the temperature variation was
included in the [5;30]
°C interval.
Referring the implemented software it permits to
perform the WQ data logging during the
measurement mode. For example the operator can
specify a fixed data logging rate (DTR=
WQ/15min)
where the
WQ represents the water quality vector.
The data file can be accessed through the cRIO-9002
ftp server capabilities from other PCs of the water
quality wireless network. At the same the current
Figure 3: The LabVIEW sequence of FPGA based WQ channel acquisition software including the acquisition rate
control(acq_rate(uS)), the acquisition time period and the moving average filtering block for average factor M=5.
Figure 3: The LabVIEW sequence of FPGA based WQ channel acquisition software including the acquisition rate
control(acq_rate(uS)), the acquisition time period and the moving average filtering block for average factor M=5.
ICINCO 2006 - SIGNAL PROCESSING, SYSTEMS MODELING AND CONTROL
158
values of the WQ can be shared with a PDA pocket
PC using the TCP client-server architecture
implemented in LabVIEW.
3.3 PDA Software
The mobile software component of the water quality
calibration and measuring system were developed in
order to permit an easy access of the WQ measured
data and send commands associated with measuring
and calibration procedures. The software that
implements the TCP/IP communication between the
PDA and cRIO real time controller was developed
using the LabVIEW PDA for PocketPC toolkit
(National Instruments, 2006). Based on the TCP
client components the operator can check the normal
functioning of the field water quality measurement
system by a direct access of the data acquired from
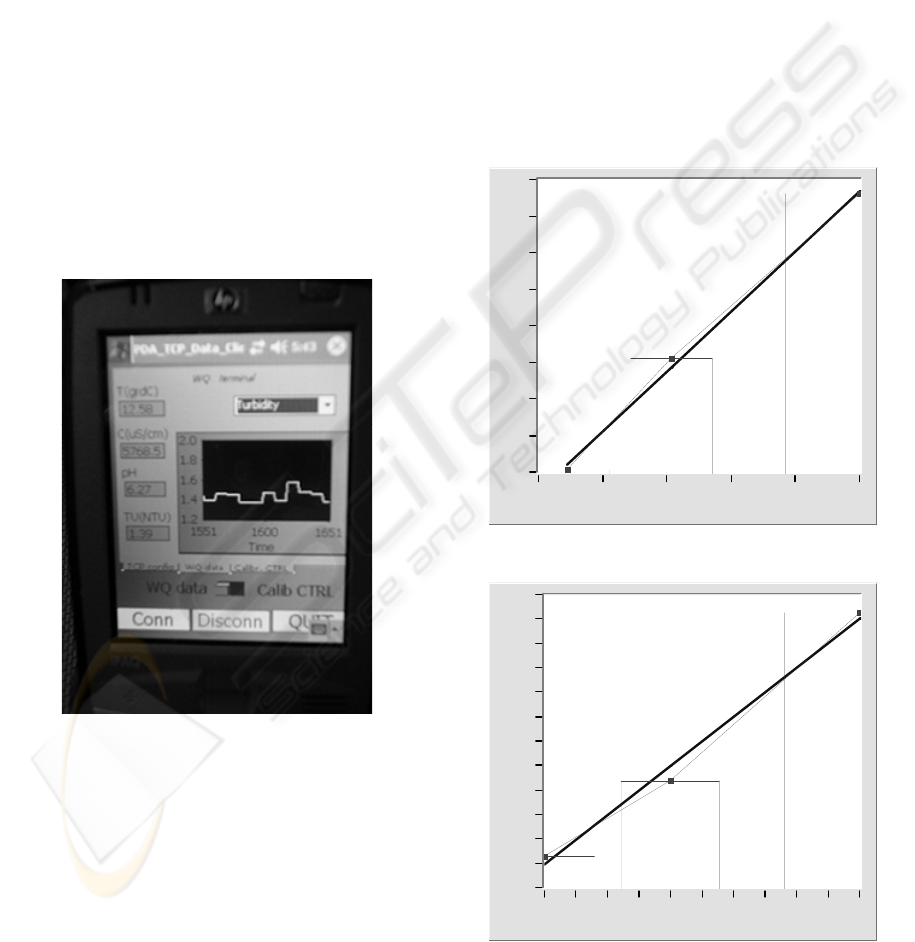
one of the measuring channels. The Figure.4 present
the PDA user interface associated with WQ
parameters values.
Figure 4: PDA interface for data visualization and
remote calibration control
In the figure can be observed the current values
measured by the field node based on the cRIO
system during a measurement cycle. Changing the
WQ data to Calib CTRL tab the user can verify the
date of the latest calibration and also can start-up a
new calibration. Additional functionalities related
with the fault detection and diagnosis are also
included.
4 RESULTS AND DISCUSSIONS
In order to underline the proposed solution
capabilities, in terms of the water quality
measurement, auto-calibration, data processing and
data communication capabilities, different testing
procedure were carried out.
4.1 Calibration and Measurement
Using the above mentioned calibration and
measurement system and the associated software
components several laboratorial and field tests were
carried out. In Figure 5 and Figure 6 present several
calibration curves associated with conductivity and
turbidity measurement channel calibration.
5
1
1.5
2
2.5
3
3.5
4
4.5
C(uS/cm)
5000
0 1000 2000 3000 4000
UC(V)
Figure 5 Conductivity calibration curve.
3.75
0.75
1
1.25
1.5
1.75
2
2.25
2.5
2.75
3
3.25
3.5
TU
50
0 5 10 15 20 25 30 35 40 45
UTU (V)
Figure 6: Turbidity calibration curve.
Figure 4: PDA interface for data visualization and remote
calibration control.
EMBEDDED FPGA SOLUTION FOR WATER QUALITY MONITORING SYSTEM - Calibration and Measurement
159

Referring to the above mentioned figure it can be
underlined that the turbidity curve non-linearity is
about
ε
TU
= 4% that justify the implementation of
voltage-to-turbidity conversion algorithm based on
piecewise linear approximation of sensor channel
inverse model.
4.2 Power Consumption Tests
Considering the measurement requirements the field
operation water monitoring system must have an
autonomy, power consumption is a very important
issue. The system is powered by a 12 VDC battery
and tests were conducted to obtain the evolution of
current and power consumption during both
calibration and measurement sessions.
The calibration session includes a maximum 3
cycles (1 cycle flowchart being presented in Fig.2)
according to the number of calibration points. Figure
6 shows the current and power evolution during the
calibration of one point for the TU sensor. The total
time (
Δt
i
sum) is 178 s, for an average current of
1.67 A and an average power consumption of 20.19
W.In the measurement phase, which takes about 200
s, the current consumption is 1.25 A.
5 CONCLUSIONS
The hardware and software proposed solution makes
not only viable stand-alone smart sensing nodes for
distributed water quality monitoring and assessment
but also increases the accuracy of the measured
quantities and assures equipment autonomy and life
time, reducing, in particular, maintenance costs. The
reconfigurable system based on FPGA assures
accurate timings and voltage acquisition that
guarantees accurate results on measuring or
calibration procedures. The system interface with the
operator is strongly improved by using the mobile
component expressed by a PDA and the
corresponding software is included in the system.
This feature is especially important when the WQ
measuring node is installed in inaccessible points.
Another important feature of the proposed system,
now presented, are the fault detection and diagnosis
capabilities at WQ node level and the advantage of
mobile component implementation in order to
receive signalling messages associated with
anomalous functioning, of one or multiple
measurement channels, pollution events that
occurred in the monitored area.
REFERENCES
O. Postolache, P.M. Girão, J. M. Dias Pereira, H.G.
Ramos; "An Internet and Microcontroller Based
Remote Operation Multisensor System for Water
Quality Monitoring", Proc. IEEE Sensors, Orlando,
USA, Vol. 1, pp. 254 - 259, June, 2002.
O. Postolache, P.M. Girão, J. M. Dias Pereira, H.G.
Ramos; "Wireless Water Quality Monitoring System
Based on Field Point Technology and Kohonen
Maps", Proc. IEEE Canadian Conf. on Electrical &
Computer , Montreal, Canada, Vol. 3, pp. 1873 - 1876,
May , 2003.
P. M. Girão, O. Postolache, J.M. Dias Pereira; H.G.
Ramos; "Distributed Measurement Systems and
Intelligent Processing for Water Quality Assessment",
Sensors & Transducers Magazine, Vol. 38, No. 12, pp.
74 - 85, December, 2003.
O. Postolache, P.M.B.S. Girão, J.M.D. Pereira, H.M.G.
Ramos, “Self Organizing Maps Application in a
Remote Water Quality Monitoring System”, IEEE
Trans. on Inst. and Meas., Vol. 54, n. 1, pp. 322-329,
February 2005.
National Instrument “CompactRIO Reconfigurable
Embedded System” on-line at http://www.ni.com,
2005
J. Eidson “IEEE1451.2 Correction Engine Applications”,
Hewlett-Packard Press, August 1998
National Instruments, “What is the LabVIEW PDA
module”, on-line at www.ni.com, 2006
ICINCO 2006 - SIGNAL PROCESSING, SYSTEMS MODELING AND CONTROL
160
