
EXTRACTION OF SIGNIFICANT REGIONS IN COLOR IMAGES
FOR LANDMARK IDENTIFICATION
Jose-Luis Albarral and Enric Celaya
Institut de Robòtica i Informàtica Industrial (IRI), UPC-CSIC, Barcelona, Spain
Keywords: Color vision, image segmentation, landmark characterization.
Abstract: In this paper, we address the problem of natural landmark characterization in outdoor environments. Our
approach assumes that the image has been previously processed in order to detect the most color-salient
areas of the image, which are considered as possible candidates to contain a landmark. We take each of
these selected areas and perform a color segmentation of them involving only the most relevant regions,
which will be used to characterize a possible landmark contained in this area. The re-identification of the
same landmarks in successive views should be done in a posterior step by comparing their descriptions,
which consist in the color and first and second order moments of each segmented region. The main
contribution of this paper is the algorithm for the segmentation of the relevant regions of an image.
1 INTRODUCTION
To make vision-based robot navigation possible in
outdoor environments, a robot must be able to detect
and characterize relevant landmarks found in the
environment so that they can be recognized later on.
In order to make this task feasible it is necessary to
restrict the search for landmark candidates to the
most promising areas of the scene. In our approach,
we assume that a number of salient areas have
already been selected for further processing. The
procedure to find the salient areas of an image is not
the subject of this paper, but a description of some
methods that could be applied can be found in
(Celaya and Jimenez, 2003) or (Itti, 1998).
This paper focuses on the characterization of the
selected areas to allow the identification of the same
landmarks in different views. Techniques for
landmark characterization based on grey level
gradients, like the SIFT algorithm (Lowe, 2004),
have had a great success, but they are too dependent
on the point of view, which may change a lot during
the navigation process. A more robust landmark
characterization can be obtained using color
information. The approach we follow consists in a
color-based segmentation with the particularity that
not all pixels in the image are necessarily assigned to
a region: only those parts of the image that constitute
a relevant feature are obtained as the result of the
segmentation. The candidate landmark is then
characterized by the color content and the spatial
moments of its relevant regions, and matched
against other landmarks found in subsequent images.
Many color-based image segmentation
techniques can be found in the literature. Pixel-based
techniques, such as histogram thresholding
(Littmann, 1997) or color clustering methods
(Uchiyama, 1994), work exclusively in the color
space and extract regions with excellent color
homogeneity, but with no spatial continuity. Region
based techniques, such as split-and-merge (Celenk,
1990) or region growing methods (Themeau, 1997),
are a better option as they assure both color
homogeneity and spatial continuity, but their results
depend too much on the order in which pixels are
processed. Other techniques such as contour based
methods (Macaire, 1996) make use of gradient or
Laplacian operators which make them too sensitive
to noise. Finally, physics based methods, such as the
dichromatic reflection model (Shafer, 1985), avoid
effects of reflections and shading by modelling how
light interacts with each object, but they can only be
used when the reflection properties of objects are
known, something unfeasible in previously unknown
outdoor environments.
In this paper we present our approach to the
segmentation and extraction of significant regions of
an image that combines region growing and
histogram thresholding. It can be seen as an
552
Albarral J. and Celaya E. (2006).
EXTRACTION OF SIGNIFICANT REGIONS IN COLOR IMAGES FOR LANDMARK IDENTIFICATION.
In Proceedings of the Third International Conference on Informatics in Control, Automation and Robotics, pages 552-556
DOI: 10.5220/0001218305520556
Copyright
c
SciTePress

"incomplete" image segmentation, in the sense that
not all pixels need to be classified in some region,
but only those defining significant regions. With
significant region we mean that it presents sufficient
color homogeneity, is sufficiently different from its
surroundings, and its size is not too small. Ideally, a
useful landmark should be characterized with a
small number of significant regions. Thus we
designed our algorithm so that only the most
significant regions are obtained.
In the next Section we define the color
similarity test used by the segmentation algorithm,
which is described in Sec. 3. Some experiments and
results obtained with this approach are presented in
Sec. 4.
2 COLOR SIMILARITY TEST
Our segmentation algorithm uses a color similarity
test to determine if a pixel should be included in a
region or not. For this, instead of computing a
complex distance defined in a 3-dimensional color
space, our test uses three one-dimensional distances,
one for each color component. The test succeeds
only if all three distances stay below their respective
fixed thresholds. Clearly, the results of the test will
depend on the color space we use. A major
requirement for any outdoor vision system is
robustness in front of varying illumination. In these
conditions, the HSI color space (hue, saturation,
intensity) is preferable to RGB, since it provides
more robustness to changes in light intensity and
other effects. However, a well known drawback of
the HSI color space is that the hue value is not
reliable for low values of saturation or intensity, and
similarly, the saturation value is not reliable for low
intensity values. According to this, we compute the
distance between HSI components using two
correction factors K
g
and K
d
to take into account the
above mentioned indeterminacies associated with
greyness and darkness, respectively:
()
12
*,min)
2
,
1
( hhKKhhdist
dgH
−= (1)
12
*)
2
,
1
( ssKssdist
dS
−= (2)
12
)
2
,
1
( iiiidist
I
−= (3)
where
()
),(min
21
1
1
)
2
,
1
(
grey
sss
g
e
ssK
−−
+
=
(4)
()
),(min
21
1
1
)
2
,
1
(
dark
iii
d
e
iiK
−−
+
= (5)
K
g
makes the hue distance vanish as one of the
compared saturations falls below the grey saturation
threshold s
grey
, empirically set to 10% of the
saturation range. On the other side, K
d
makes both
the hue and the saturation distances vanish as one of
the compared intensities falls below the dark
intensity threshold i
dark
, set as 10% of the intensity
range. These two correction factors take the form of
sigmoid functions to guarantee a continuous gradual
correction when values are near both thresholds.
Two colors are considered similar by the test if:
1,,max ≤
⎟
⎟
⎠
⎞
⎜
⎜
⎝
⎛
I
I
S
S
H
H
thresh
dist
thresh
dist
thresh
dist
(6)
3 SEGMENTATION METHOD
Our segmentation algorithm is based on the
combination of two complementary methods: region
growing and histogram thresholding.
3.1 Random Seeds & Region
Growing
The segmentation method consists in a series of
region growing processes initiated at seed pixels
selected at random. This is done to avoid a complete
examination of all image pixels, since our goal is not
a classification of all pixels, but the identification of
the most significant regions composing the image.
Since too small regions are not considered
significant for landmark characterization, it is
appropriate to use a random exploration, which
gives more probability to find large regions than
small ones. Instead of using a fixed number of
random seeds, we define a minimum percentage of
the image to be segmented and let the process
continue until this percentage is reached. However,
this percentage may be hard to reach in the case of
textured images that give rise to a large number of
small regions. To tackle these situations, an
alternative stop condition occurs when the number
of segmented regions goes beyond a limit.
The process of region growing from a seed pixel
is done using a mask of the image to hold the pixels
included in the region, and a list of pixels to be
expanded, both of them initialized with the selected
seed. The region is characterized by a specific color,
initially taken as that of the seed pixel.
EXTRACTION OF SIGNIFICANT REGIONS IN COLOR IMAGES FOR LANDMARK IDENTIFICATION
553

The expansion of a pixel consists in checking its
eight neighbours for color similarity with its region.
Pixels considered similar are included in the mask
and added at the end of the expansion list. The
process stops when all pixels in the expansion list
have been processed. Repeated checking of the same
pixels is avoided by keeping track of the already
examined pixels. Also, if a seed pixel is contained in
a segmented region, it is not expanded again.
3.2 Defining a Region Color
To decide if a pixel is included in a region, we
perform a similarity test between the color of the
pixel and the color that characterizes the region.
Initially, the region is characterized by the color of
the seed pixel and, as new pixels are included, the
region color evolves to better represent the region.
To determine the current region color, two
approaches have been tested: taking the color
average of the included pixels, and taking the peak
value of the current histogram. In both cases, since
the region color evolves, the inclusion of a pixel in a
region depends on the precise time at which the test
is performed. To solve this, an iterative process of
relaxation can be done in the following way: once a
growing process is completed, the region color is
fixed and all the included pixels are incorporated in
the expansion list. Then the region growing process
is repeated as before, except that the region color is
not updated during the process. The pixels in the
resulting region are used to compute the new region
color that will be used in the next iteration of the
relaxation process. Successive relaxation steps can
be repeated until convergence to a stable region.
Tests performed in a number of images show
that, when using the color average, convergence is
reached in about five steps in most cases. However,
if the histogram peak is used, convergence is faster,
and is reached after just one or two steps. In both
cases, the segmentation is robust to the random
selection of seeds, always providing equivalent
results in different executions.
Therefore, we adopted the histogram peak to
represent the region color. Moreover, since results
do not vary significantly with relaxation, we perform
a single step in order to improve computing time.
3.3 Merging Regions
The region growing processes are independent, in
the sense that a pixel may be included in a region no
matter if it was already included in another one or
not. This mitigates the well known problem of
region growing techniques, whose outcome often
depends on the order in which seeds are expanded.
Thus, in our approach regions may overlap,
indicating that they are relatively similar. For this
reason, after the growing processes overlapping
regions are merged provided they pass a test of color
similarity, though with a larger tolerance than in the
case of pixels.
Since we allow regions to overlap, in some
cases highly overlapped regions, only differing in a
few pixels, may be obtained from different seeds.
This affects efficiency since the same tests are
repeated unnecessarily. To avoid this, the expansion
of a region into an already existing one is limited
only to region borders: pixels already included in
another region are added to the region mask, but not
to the expansion list.
An additional merge process is also done to join
similar regions that don’t overlap, but that are close
enough to each other.
In the final output of the segmentation process,
regions below a predetermined size are filtered off.
The remaining regions are then characterized by
their representing color and their spatial moments up
to order 2, which will be used later on for landmark
identification.
4 EXPERIMENTS AND RESULTS
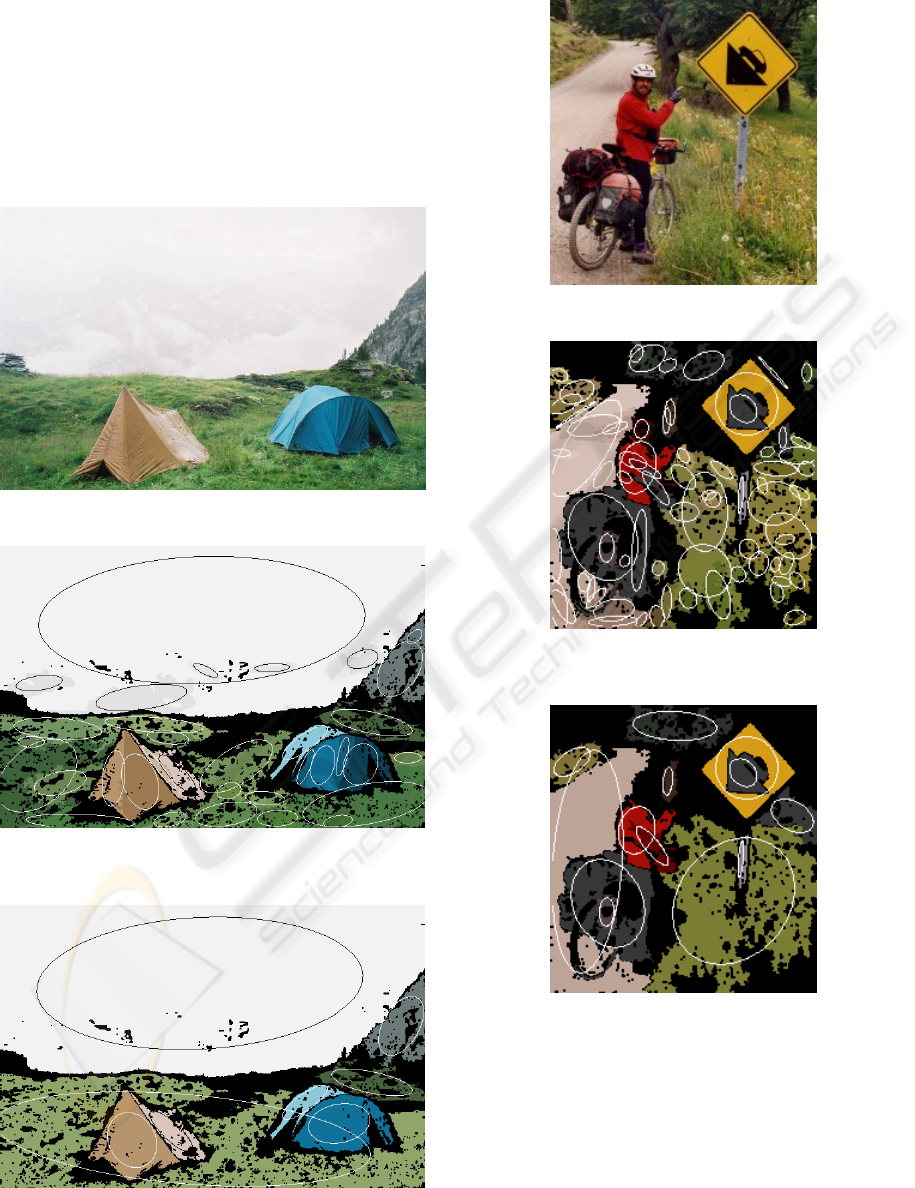
In figures 1 to 3 a mountain environment image is
segmented. The result of the region growing process
is shown in figure 2, where an oversegmentation is
present with more than 30 regions. Each extracted
region is represented by its color and an ellipse
representing its spatial moments. The result after the
merge process is shown in figure 3, resulting in 8
final regions. The image size is 640x480 and 85% of
it was segmented, taking about 500 ms in a 2.40GHz
processor.
In figures 4 to 6 a field road environment image
is segmented. A strong oversegmentation is present
after the region growing process with more than 70
regions, as shown in figure 5. But, after the merge
process the final result is 13 regions, as shown in
figure 6. The image size is 240x240 and only 60% of
it was segmented, taking about 150 ms in the same
processor.
For real-time navigation we need shorter
processing times and therefore the integration with a
previous salient region detection module would be
useful to reduce the fraction of the image to be
segmented.
ICINCO 2006 - ROBOTICS AND AUTOMATION
554
The output of the saliency module is an ellipse
indicating the approximate position, orientation and
size of a salient color region in the image together
with its color range. This information is used to
separate the salient region from its background.
Then, its convex hull is obtained and the enclosing
area is considered a candidate landmark, in which
the segmentation takes place.
Figure 1: Image of a mountain environment.
Figure 2: +30 extracted homogeneous regions after the
growing process. The image is oversegmented.
Figure 3: 8 final regions after the merge of the similar
overlapped and neighbour regions.
Figure 4: Image of a field road environment.
Figure 5: +70 extracted regions after the growing process.
The image is oversegmented.
Figure 6: 13 final regions after the merge of the similar
overlapped and neighbour regions.
Figures 7 and 8 show two experiments where
the integration of the saliency and segmentation
modules has been tested. In each upper image, the
saliency ellipse indicates the presence of one salient
area, red lighthouse and blue tent, respectively.
Then, the extracted salient area, its convex hull, and
the result obtained after segmentation are shown
below.
EXTRACTION OF SIGNIFICANT REGIONS IN COLOR IMAGES FOR LANDMARK IDENTIFICATION
555
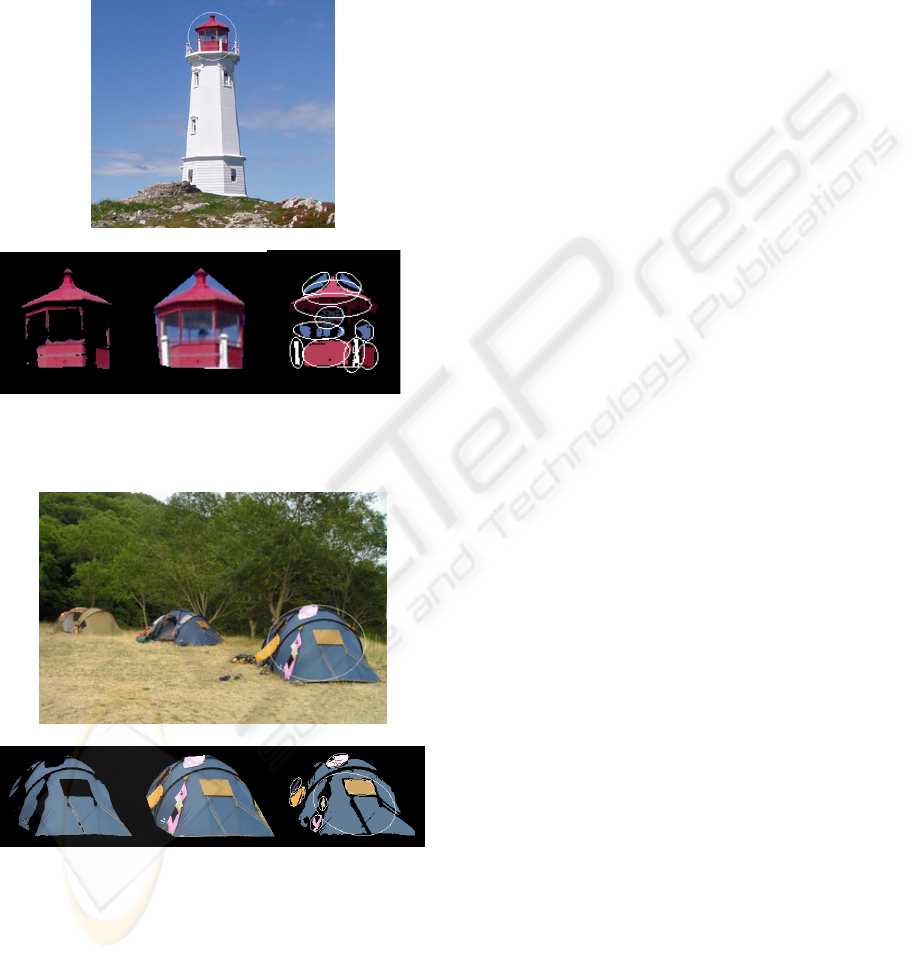
In the first experiment, figure 7, the image size
is 600x570 and only 1% of the image was
segmented (73% of the landmark) with 50 ms of
total processing time for the three steps process. The
second experiment, figure 8, took a total of 80 ms to
segment a 6% of the 640x430 image (77% of the
landmark).
Figure 7: The red lighthouse is given as salient area. It is
separated from the background and its convex hull is
segmented in a 11 regions landmark.
Figure 8: The blue tent is given as salient area in the
image. It is separated from the background and its convex
hull segmented in a 7 regions landmark.
5 CONCLUSIONS
The results of our experiments show that the
implemented segmentation algorithm can be used in
a landmark detection system for robot navigation.
Our next step will consist in testing a matching
algorithm to identify landmarks in different views.
ACKNOWLEDGEMENTS
This work has been partially supported by the
spanish Ministerio de Educación y Ciencia and
FEDER, under the project DPI2003-05193-C02-01
of the Plan Nacional de I+D+I.
Jose-Luis Albarral holds grant BES-2004-6203
from the spanish Ministerio de Educación y Ciencia.
Image in figure 7 has copyright © Louisbourg
Institute, Cape Breton University
REFERENCES
Celaya, E., Jimenez, P., 2003. Salience detection in time-
evolving image sequences. Design and Application of
Hybrid Intelligent Systems, A. Abraham, M. Köppen,
K. Franke ed., IOS Press, Amsterdam, pp. 852-860.
Celenk, M, 1990. A color clustering technique for image
segmentation. Graphical Models and Image
Processing, vol. 52, no. 3, pp. 145-170.
Itti, L., Koch, C., 1998. A model of saliency-based visual
attention for rapid scene analysis. IEEE Trans. on
Pattern Analysis and Machine Intelligence, vol. 20,
no. 11, pp. 1254-1259.
Littmann, E., Ritter, H., 1997. Adaptive color
segmentation: a comparison of neural and statistical
methods. IEEE Trans. on Neural Networks, vol. 8, no.
1, pp. 175-185.
Lowe, D., 2004. Distinctive image features from scale-
invariant keypoints. International Journal of
Computer Vision, vol. 60, no. 2, pp. 91-110.
Macaire, L., Ultre, V., 1996. Determination of
compatibility coefficients for color edge detection by
relaxation. International Conference on Image
Processing, C, pp. 1045-1048.
Shafer, SA., 1985. Using color to separate reflexion
components. Color Research and Applications, vol.
10, no. 4, pp. 210-218.
Tremeau, A., Borel, N., 1997. A region growing and
merging algorithm to color segmentation. Pattern
Recognition, vol. 30, no. 7, pp. 1191-1203.
Uchiyama, T., Arbib, M., 1994. Color image segmentation
using competitive learning. IEEE Trans. on Pattern
Analysis and Machine Intelligence, vol. 16, no. 12, pp.
1197-1206.
ICINCO 2006 - ROBOTICS AND AUTOMATION
556
