
EVOLUTIONARY DATA MINING APPROACH TO CREATING
DIGITAL LOGIC
James F. Smith III, ThanhVu H. Nguyen
Code 5741, Naval Research Laboratory, Washington, DC, 20375-5320, USA
Keywords: Optimization problems in signal processing, signal reconstruction, system identification, time series and
system modeling.
Abstract: A data mining based procedure for automated reverse engineering has been developed. The data mining
algorithm for reverse engineering uses a genetic program (GP) as a data mining function. A genetic
program is an algorithm based on the theory of evolution that automatically evolves populations of
computer programs or mathematical expressions, eventually selecting one that is optimal in the sense it
maximizes a measure of effectiveness, referred to as a fitness function. The system to be reverse engineered
is typically a sensor. Design documents for the sensor are not available and conditions prevent the sensor
from being taken apart. The sensor is used to create a database of input signals and output measurements.
Rules about the likely design properties of the sensor are collected from experts. The rules are used to
create a fitness function for the genetic program. Genetic program based data mining is then conducted.
This procedure incorporates not only the experts’ rules into the fitness function, but also the information in
the database. The information extracted through this process is the internal design specifications of the
sensor. Significant mathematical formalism and experimental results related to GP based data mining for
reverse engineering will be provided.
1 INTRODUCTION
An engineer must design a signal that will yield a
particular type of output from a sensor device (SD).
The engineer does not have design specifications for
the sensor system and the machine may not be
disassembled or invasively examined. The engineer
might attempt to find the correct signal through trial
and error, but this would be very time consuming
and access to experimental resources is very
expensive. To deal with this problem a genetic
program (GP) based data mining (DM) procedure
has been invented (Smith 2005).
A genetic program is an algorithm based on the
theory of evolution that automatically evolves
populations of computer programs or mathematical
expressions, eventually selecting one that is optimal
in the sense it maximizes a measure of effectiveness,
referred to as a fitness function (Koza 1999; Smith
2003a, 2003b, 2004). The system to be reverse
engineered is typically a sensor. The sensor is used
to create a database of input signals and output
measurements. Rules about the likely design
properties of the sensor are collected from experts.
The rules are used to create a fitness function for the
genetic program. Genetic program based data
mining is then conducted (Bigus 1996, Smith 2003a,
2003b, 2004). This procedure incorporates not only
experts’ rules into the fitness function, but also the
information in the database. The information
extracted through this process is the internal design
specifications of the sensor. The design properties
extracted through this process can be used to design
a signal that will produce a desired output (Smith
2005). Determination of such signals can be
essential to ultimate determination of control rules
for automatic multiplatform coordination (Smith
2003a, 2003b, 2004).
GPs require a terminal set and function set as
inputs. The terminals are the actual variables of the
problem. These can include a variable like “x” used
as a symbol in building a polynomial and also real
constants. The function set consists of a list of
functions that can operate on the variables. When a
GP was used as a DM function in the past to
automatically create fuzzy decision trees, the
terminals consisted of fuzzy root concepts and the
functions consisted of fuzzy logical connectives and
107
F. Smith III J. and H. Nguyen T. (2006).
EVOLUTIONARY DATA MINING APPROACH TO CREATING DIGITAL LOGIC.
In Proceedings of the Third International Conference on Informatics in Control, Automation and Robotics, pages 107-113
DOI: 10.5220/0001212201070113
Copyright
c
SciTePress
fuzzy modifiers (Smith 2003a, 2003b, 2004).
When the GP is used as a data mining function, a
database of input and output information is required.
When the GP is used as a data mining function for
evolving digital logic (DL), the database contains
inputs to the DL as well as measured outputs. The
experts’ opinions are manifested in the selection of
the input and associated output to be included in the
database. For the DL case an additional form of
input consisting of “rules” about DL construction
are included.
Section 2 discusses data mining and the use of a
genetic program as a data mining function. Section
3 examines one of the digital logic designs to be
reverse engineered using genetic program based data
mining. Section 4 explains the genetic program’s
terminal set, function set, and fitness function.
Section 4 also gives detailed formulations of the rule
fitness, fitness score, input-output fitness, and
overall fitness. Section 5 provides experimental
results with detailed descriptions of the evolutionary
properties. Finally, section 6 provides conclusions.
2 GP BASED DATA MINING
Data mining is the efficient extraction of valuable
non-obvious information embedded in a large
quantity of data (Bigus 1996). Data mining consists
of three steps: the construction of a database that
represents truth; the calling of the data mining
function to extract the valuable information, e.g., a
clustering algorithm, neural net, genetic algorithm,
genetic program, etc; and finally determining the
value of the information extracted in the second
step, this generally involves visualization.
When used for reverse engineering, the GP,
typically data mines a database to determine a
graph-theoretic structure, e.g., a system’s DL
diagram or an algorithm’s flow chart or decision tree
(Smith 2003a, 2003b, 2004). The GP mines the
information from a database consisting of input and
output values, e.g., a set of inputs to a sensor and its
measured outputs. GP based data mining will be
applied to the construction of the DLs described in
sections 3 and 5.
To use the genetic program it is necessary to
construct terminal and function sets relevant to the
problem. Before the specific terminal and function
sets for the reverse engineering problems are
described, a more detailed description of one of the
digital logic examples to be considered will be given
in section 3.
3 DIGITAL LOGIC TO BE
REVERSE ENGINEERED
The first DL design to be reverse engineered is
given in prefix notation in (1) and is depicted
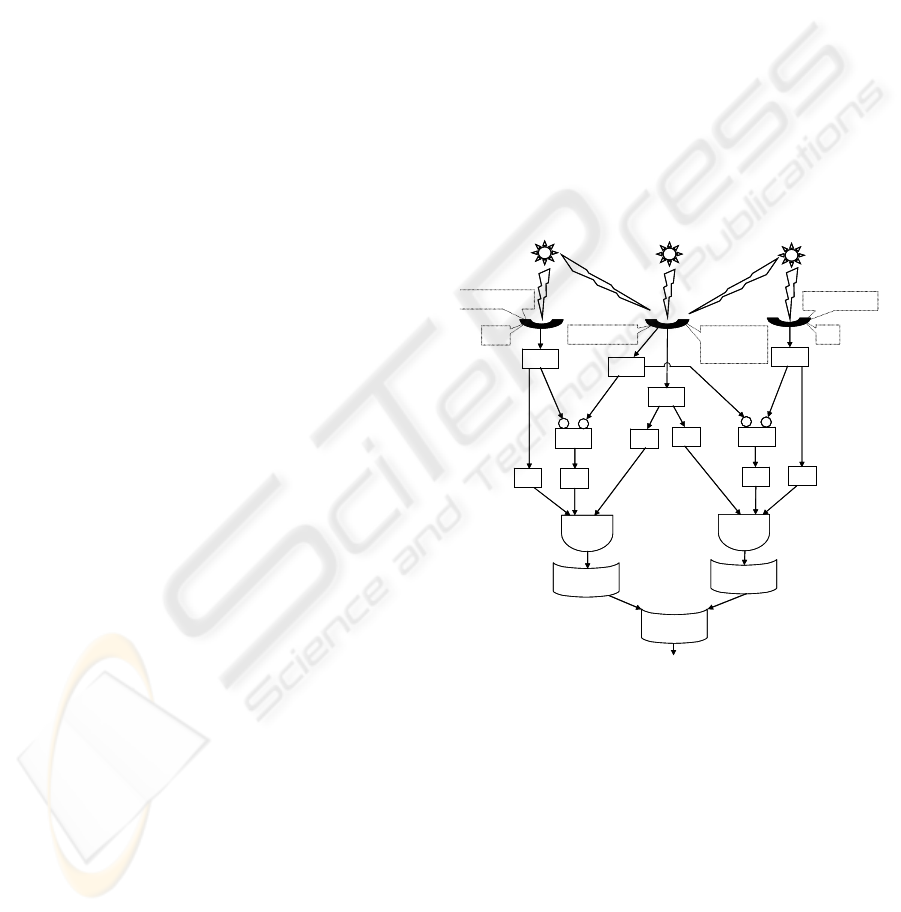
diagrammatically in Figure 1,
OR2 OR3DELAY AND3 H
1
MAX_SIG123 H
3
SUM_SIG2 H
2
DIFF SUM_SIG2 SUM_SIG123
OR3DELAY AND3 H
1
MAX_SIG123 H
3
SUM_SIG3 H
2
DIFF SUM_SIG3 SUM_SIG123.
(1)
The notation is described in (Smith 2005) and
summarized in this section. This DL is not known
to the GP. The GP only has access to a database of
input signals to the DL and measured output, as well
as, a database of rules provided by experts for
building the DL.
S
1
+S
2
+S
3
S
2
SUM
MAX
SUM
DIFF H
1
H
2
H
3
AND3
SUM
DIFFH
1
H
2
H
3
AND3
ORDELAY3
ORDELAY3
OR2
SOURCE 2
SOURCE 1
SOURCE 3
SENSOR 1
SENSOR 2 S
3
SENSOR 3
2
1
1
2
S
1
+S
2
+S
3
S
2
SUM
MAX
SUM
DIFF H
1
H
2
H
3
AND3
SUM
DIFFH
1
H
2
H
3
AND3
ORDELAY3
ORDELAY3
OR2
SOURCE 2
SOURCE 1
SOURCE 3
SENSOR 1
SENSOR 2 S
3
SENSOR 3
22
11
1
2
11
22
Figure 1: The first DL to be reverse engineered.
The DL consists of three input channels each
with a sensor attached. The sensors receive signals
from sources one, two and three. Only
measurements from the central source in Figure 1
are of interest. Due to the geometry of the sources
and properties of the sensors only sensor two can
receive emissions from the central source that are
significant. Unfortunately, sensor two’s
measurement may be corrupted by emissions from
the other two sources. The digital logic is
constructed so that if there were significant
corruption of sensor two’s measurements, then the
final OR-gate returns unity, so the measurements
ICINCO 2006 - SIGNAL PROCESSING, SYSTEMS MODELING AND CONTROL
108

can be ignored.
There are a number of DL elements that are used
repeatedly. The DL components and signals will
ultimately become elements of the GP’s terminal
and function sets. The sensors will receive an
analog signal and convert it to a digital form, i.e.,
they will map real-valued input to the set of integers.
A sampling window of size N is used, i.e., the signal
is sampled every Δt seconds for a total of N samples
in that window. The sample is indicated by the
vector
j
s
in (2) with sampling beginning at time t
o
.
The j-subscript implies the signal originated in the j
th
source, where j=1,2,3,
[
]
.)t)1N(t(s
,...),tt(s),t(ss
oj
ojojj
Δ
Δ
⋅−+
+=
(2)
The DL function, SUM, given explicitly in (3),
represents the logarithmic sum of the absolute value
of the time components of the digitized input that
has been received for a single window of length N,
⎥
⎦
⎤
⎢
⎣
⎡
∑
⋅−+=
=
N
1k
ojj
)t)1k(t(slog)s(SUM
Δ
.
(3)
The elements labeled H
i
, for i=1,2,3, are
Heaviside step functions as given in (4). If the input
is greater than or equal to a threshold,
τ
i
, for i=1,2,3;
then a value of unity is transmitted, otherwise a zero
is transmitted,
⎩
⎨
⎧
<
≥
=
i
i
i
sif
sif
sH
τ
τ
,0
,1
)(
.
(4)
The DL function, MAX, given in (5), returns the
common logarithm of the maximum absolute value
of the time components of the input signal for a
single window of length N. The element labeled
DIFF, takes the difference between input to its first
and second arguments as indicated in (5).
⎥
⎦
⎤
⎢
⎣
⎡
Δ⋅−+=
∨
=
))1((log)(
1
tktssMAX
oj
N
k
j
(5)
2121
),( IIIIDIFF −
=
(6)
The DL function, OR3DELAY, takes only
Boolean inputs, i.e., it expects zero or one as an
input. It waits until it has three consecutive inputs
from three consecutive time windows, hence the “3”
in its name. Once it receives three consecutive
inputs, it yields as an output the maximum of its
inputs. Also not depicted, but used in the GP’s
function set are AND3DELAY, which takes three
inputs of zero or one corresponding to three
consecutive time windows and yields as output the
minimum of its inputs. Finally, the symbols labeled
AND3, OR3, AND2, and OR2 are the conventional
logical connectives AND and OR, with the
numerical designation indicating the number of
inputs expected, e.g., AND3 expects three Boolean
inputs.
The signals are additive, at any given time sensor
two may record a superposition of the three sources’
transmissions, which is represented by s
1
(t)+ s
2
(t) +
s
3
(t). If the three sensors’ signals are of sufficient
magnitude then this is characteristic of corruption
and the final OR in Figure 1 returns unity.
4 GP TERMINAL SET,
FUNCTION SET AND FITNESS
This section describes the GPs terminal set, function
set, and the fitness functions. The description is
given in terms of DL elements and properties, but
the genetic program based reverse engineering
technique is very general and can be applied to any
system that can be described in a graph theoretic
language, e.g., decision processes described in terms
of decision trees (Smith 2003a, 2003b, 2004).
The terminal set consists of the following
elements:
T={SUM_SIG123, MAX_SIG123,
SUM_SIG2, MAX_SIG2, SUM_SIG3,
MAX_SIG3},
(7)
where
SUM_SIG123 = SUM(
321
sss
++ ),
(8)
MAX_SIG123 = MAX(
321
sss
++ ),
(9)
SUM_SIG2 = SUM(
2
s
),
(10)
MAX_SIG2 = MAX(
2
s
),
(11)
SUM_SIG3 = SUM(
3
s
),
(12)
MAX_SIG3 = MAX(
3
s
).
(13)
All sensor measurements begin at time, t
o
.
The function set consists of the following
EVOLUTIONARY DATA MINING APPROACH TO CREATING DIGITAL LOGIC
109

elements:
F={AND3, OR3, AND2, OR2,
AND3DELAY, OR3DELAY, H
1
, H
2
, H
3
,
DIFF}.
(14)
The function AND3DELAY is not used for the DL
under consideration. By including it, the GP’s
ability to discriminate against extraneous functions
is emphasized.
The DL design to be evolved by the GP is given
in (1). The GP’s ability to do this will be
determined largely by the fitness function and the
underlying databases to be discussed.
As with all GPs there must be a fitness function
for evaluation of the evolving population of
chromosomes. The fitness function, referred to as
the overall fitness (OF) denoted as
OF
f is actually
the sum of two other fitness functions. These
functions are the rule fitness (RF) and the input-
output fitness (IOF) denoted as
RF
f and
IOF
f ,
respectively. The rule fitness is given in (15) where
the indicator function,
i
I is unity if the i
th
rule is
satisfied and zero otherwise, and
i
v is the value of
the i
th
rule. Table 1 provides a small subset of the 12
rules used.
∑
=
⋅=
12
1
i
iiRF
vIf
(15)
Let
j
DL
denote the j
th
element of the evolving
population of chromosomes within the GP for
ps
m,,2,1j …=
where
ps
m
is the population size,
i.e., the number of chromosomes. Let each
j
DL
consists of an OR2 or AND2 that connects two
subgraphs, denoted as
leftDL
j
_ and rightDL
j
_ .
Let
(
)
ς
_
j
DLl
be the length, i.e., the number of
nodes in
ς
_
j
DL
, for
{}
rightleft,∈
ς
. If
(
)
ς
_
j
DLl is greater than or equal to 20 then the
parsimony pressure,
(
)
ςα
_
jp
DLl⋅
is subtracted
from the rule fitness followed by division by 100,
ultimately yielding the rule score, denoted as
RS
g .
This subtraction is done if either
(
)
leftDLl
j
_
or
(
)
rightDLl
j
_
exceeds 20. The quantity
p
α
is
referred to as the parsimony coefficient (Smith
2005). The rule score is expressed compactly as
(
)
(
)
{
()
[]
()}
(){
()
[]
()}
,right_DLl20right_DLl
right_DLf
100
1
left_DLl20left_DLl
left_DLf
100
1
DLg
jpj
jRF
jpj
jRFjRS
⋅⋅−
−+
⋅⋅−
−=
αχ
αχ
(16)
where the Heaviside step function
χ
takes the value
unity for non-negative arguments and is zero
otherwise. If the rule score exceeds the rule
threshold denoted as,
RT
κ
then and only then is the
input-output fitness evaluated. By forcing the rule
score to exceed a threshold before the input-output
fitness is evaluated a great deal of computational
complexity is avoided.
Let
T
DL denote the true digital logic diagram
that underlies the SD used to construct the input-
output database. For the examples considered in this
paper let there be three signals. The input-output
database is assumed to have the following structure
⎥
⎥
⎥
⎥
⎥
⎦
⎤
⎢
⎢
⎢
⎢
⎢
⎣
⎡
=
m
m
3
m
2
m
1
2
2
3
2
2
2
1
1
1
3
1
2
1
1
DB
BSSS
BSSS
BSSS
M
,
(17)
where
k
j
S is the three time window input from the j
th
source for the k
th
input;
{}
1,0B
k
∈ is the k
th
output
from
T
DL for k=1,2,…, m, i.e.,
.m,,2,1kfor
;S,S,SDLB
k
3
k
2
k
1
Tk
…=
⎟
⎠
⎞
⎜
⎝
⎛
=
(18)
Table 1: Subset of the rule set for computational GP
experiments.
R1: If either OR3DELAY or AND3DELAY are present
during rule fitness evaluation add
5
1
=
ν
.
R2: If AND3 or OR3 are present during fitness
evaluation add 5
2
=
ν
.
The input-output fitness for the j
th
chromosome,
j
DL
, is defined as
ICINCO 2006 - SIGNAL PROCESSING, SYSTEMS MODELING AND CONTROL
110

()
⎥
⎥
⎦
⎤
⎢
⎢
⎣
⎡
∑
−
⎟
⎠
⎞
⎜
⎝
⎛
+
=
=
2
m
1k
k
k
3
k
2
k
1
j
DBIOF
BS,S,SDL1
1
M,jf
(19)
The overall fitness,
OF
f , for the j
th
chromosome
can be written as
()
(
)
()()
()
.M,jfDLg
DLgM,jf
DBIOFRTjRS
jRSDBOF
⋅−
+=
κχ
(20)
It is important to recall that in actual
implementation, the input-output fitness is only
evaluated if the rule fitness is greater than or equal
to the rule threshold. Selectively evaluating the
input-output fitness greatly reduces the
computational complexity and hence the run-time of
the GP.
5 DATA MINING RESULTS
In this section two different DL schemes data mined
by the GP are considered. The two examples
presented here are representative of the many
experiments that have been conducted to show the
effectiveness of the GP based data mining procedure
presented in this paper. The first is the DL
represented in (1) and also in Figure 1. This DL will
assume the value of
T
DL for the discussion below.
Using various databases too large to reproduce here
and different random number generator seeds, the
GP was able to reverse engineer (1) in no more than
76 GP generations. The different number of
generations and amounts of CPU time required
reflects the effect of different input-output databases
and also the random number generator seeds. One
database may constrain the evolutionary process
more than another resulting in fitness values that
over time push the population more rapidly
toward
T
DL . Also, since the initial population is
generated randomly; and crossover, mutation,
architecture altering steps (Smith 2005) (AAS) and
symmetrical replication (Smith 2005) (SR) have
random aspects, a change in the seed of the random
number generator can also impact run-time.
To get a feel for the evolutionary process it is
useful to examine some intermediate generations
that lead to
T
DL . For the case in which (1) is
reverse engineered in 76 generations the elite
chromosomes found for different generations are
provided in Table 2 with the 76
th
generation
reproducing the correct chromosome given in (1).
The chromosomes entered into Table 2 reflect
some of the characteristics observed during the
evolutionary process. From the first generation
forward the GP is able to find best candidates that
have an OR2 at the end of the chromosome. The
presence of two DIFF operators in the first
generation is also promising. The best chromosome
for the first generation is much too short when
compared to the desired result.
New innovations are found in generation 25 in
that both arguments of both DIFFs use MAX
functions as well as the SIG123 structure. Even
though it is expected that both arguments will
ultimately use SUM functions, the use of a common
function for both arguments may show evolution in
the proper direction. Both DIFF operators are
preceded by H
2
which is what is found in (1). Even
with these innovations the best chromosome of
generation 25 is far from the correct result.
All generations after the 26
th
have elite
chromosomes that have underlying graphs
isomorphic to the final solution. The GP’s effort
from generation 27 through 76 involves finding a
solution with the proper node labels. Various rows
in the input-output (IO) database, i.e., (17)
contribute to proper labeling, e.g., if a certain row in
the database is deleted then it is likely the final GP
solution would not have proper threshold labeling.
An improper threshold value is undesirable from the
standpoint of trying to reproduce the exact digital
logic. If the goal is to produce an input signal that
yields unity as an output then even with the
threshold value wrong, as long as the input signal
has sufficient energy to take into account
uncertainty, then the desired output is obtained. In
conclusion, the ultimate cost of information
uncertainty in this case is a small amount of
additional power.
The best chromosome of the 50
th
generation is
far closer to (1). The MAX functions in the
arguments of the DIFF have been replaced by SUM
functions. The arguments of the DIFF operators are
the ones for the final result and the output of both
DIFFs is passed into H
2
as found in (1). In this
chromosome replacing H
1
MAX_SIG2 with H
3
SUM_SIG2 and H
1
MAX_SIG3 with H
3
SUM_SIG3
would yield the correct result. Finally, the desired
result is found in generation 76.
For a second example consider the DL given
below in (21) as
T
DL , i.e., truth,
EVOLUTIONARY DATA MINING APPROACH TO CREATING DIGITAL LOGIC
111

OR2 OR3DELAY AND3 H
1
SUM_SIG123
H
3
MAX_SIG2 H
2
DIFF MAX_SIG2
MAX_SIG123 OR3DELAY AND3 H
1
SUM_SIG123 H
3
MAX_SIG3 H
2
DIFF
MAX_SIG3 MAX_SIG123.
(21)
The GP’s evolutionary process for inverting (21) is
summarized in Table 3.
This example is similar to (1), in fact if in (1) the
MAX operations are replaced by the SUM operation
and SUM replaced by MAX, then (21) is obtained.
Given that (1) and (21) only differ in labeling of the
underlying graphs it is anticipated that the GP based
evolutionary processes that yield (1) and (21) would
be similar. This anticipation is born out, but there
are differences in the evolutionary processes. One
significant difference is that the chromosome in (21)
is evolved in a smaller number of generations than
the one found in (1). There is nothing that is
obvious about the rule set or input-output data based
used for both chromosomes that would favor one
over the other. Experimentation seems to indicate
the difference in the number of generations required
is related to the seed of the random number
generator.
Just as with the example in Table 2, the best
chromosome of the first generation has an OR2 at
the end, but is otherwise too short and far removed
from the correct answer. By the eighth generation
the “H
2
DIFF MAX_SIG2 MAX_SIG123” structure
has emerged. The best chromosome of the 16
th
generation preserves the best features of previous
generations and also makes use of an OR3DELAY,
but it still has many defects. For all generations
after the 26
th
generation the elite chromosome has
two subgraphs that take a form that can be derived
in closed form. The elite chromosome of the 30
th
generation has many correct labels and incorrect
ones. It illustrates how evolution can fluctuate from
generation to generation producing individuals of
higher fitness, but departing significantly from the
true DL in form. Finally in generation 46 the GP
converges having produced the correct DL design.
As referenced above it is possible to derive
closed form exact results for the set of digital logic
diagrams or set of DL maps referred to as DLS that
exactly maximize the rule score. The graph
underlying each DL diagram is isomorphic in the
graph-theoretic sense to the graph underlying
T
DL .
Furthermore, for certain signal types it is possible to
write down closed form exact results for the image
sets under these DL maps. From the image set
closed form exact entries for an input-output
database can be derived that maximize the overall
fitness.
It is found that by the 26
th
generation in the
computational studies of Tables 2 and 3 that the GP
finds a member of DLS. After the 26
th
generation
the GP’s elite solutions remain within DLS each
generation. The GP spends the rest of the
generations until it converges, re-labeling the
underlying elite graphs eventually evolving
T
DL .
By selectively eliminating rules from the rule set,
of which Table 1 is a subset or eliminating rows
from the derived IO database, the effect of
uncertainty can be studied. The elimination of rules
represents an approach to the determining the effect
of linguistic imprecision, i.e., the inability of experts
to provide crisp rules. The random loss of a row or
rows from the IO database provides a model of the
effect of uncertainty born of randomness during
measurement.
The implications for the two kinds of uncertainty
can be significantly different. Loss of a rule or rules
can greatly expand the set of DL maps that will
maximize the rule-score. If all the rules are
maintained, but rows are lost from the IO database,
then the ultimate solution can be quite different than
truth, but the underlying graph will still be
isomorphic to
T
DL . In many instances the real
effect of loss of rows from the IO database is to
interchange thresholds on the resulting DL map.
When this occurs input signals can still be designed
that will produce a desirable output. The resulting
signal will be mathematically similar to the true DL,
but more signal power will be required. So the
effect of certain kinds of uncertainty is the
requirement for more power. So the DL map has an
uncertainty insensitivity (UI) up to power.
6 SUMMARY AND
CONCLUSIONS
Genetic program (GP) based data mining has proven
effective for reverse engineering the complex digital
logic underlying sensor devices (SDs) when the
original design specifications for these devices are
unavailable and invasive study of the systems is
impossible.
The database that was subjected to data mining
consisted of known input to the digital logic (DL),
the associated measured output and a set of rules
provided by experts relating to their assumptions
about the digital logic. It is found that having a set
of expert rules in the database is essential; the
ICINCO 2006 - SIGNAL PROCESSING, SYSTEMS MODELING AND CONTROL
112

Table 2: Evolution of the DL depicted in Figure 1
Generation Best Chromosome found in the Population for the Indicated Generation
1 OR2 H
2
DIFF SUM_SIG123 MAX_SIG123 OR2 DIFF MAX_SIG2 H
1
MAX_SIG2 SUM_SIG3
25 OR2 AND3DELAY OR3 H
3
MAX_SIG2 H
2
SUM_SIG123 H
2
DIFF MAX_SIG2 MAX_SIG123
AND3DELAY OR3 H
2
SUM_SIG2 SUM_SIG3 H
2
DIFF MAX_SIG2 MAX_SIG123
40 OR2 OR3DELAY AND3 H
1
MAX_SIG2 H
1
MAX_SIG123 H
2
DIFF SUM_SIG2 SUM_SIG123
AND3DELAY AND3 H
3
SUM_SIG3 H
1
SUM_SIG2 H
2
DIFF SUM_SIG2 SUM_SIG3
50 OR2 OR3DELAY AND3 H
1
MAX_SIG2 H
1
MAX_SIG123 H
2
DIFF SUM_SIG2 SUM_SIG123
OR3DELAY AND3 H
1
MAX_SIG3 H
1
MAX_SIG123 H
2
DIFF SUM_SIG3 SUM_SIG123
76 OR2 OR3DELAY AND3 H
1
MAX_SIG123 H
3
SUM_SIG2 H
2
DIFF SUM_SIG2 SUM_SIG123
OR3DELAY AND3 H
1
MAX_SIG123 H
3
SUM_SIG3 H
2
DIFF SUM_SIG3 SUM_SIG123
Table 3: Evolution of the DL given in (21).
Generation Best Chromosome found in the Population for the Indicated Generation
1 OR2 SUM_SIG2 AND3DELAY DIFF SUM_SIG2 SUM_SIG123
8 OR2 AND3DELAY DIFF SUM_SIG3 SUM_SIG123 AND3DELAY H
2
DIFF MAX_SIG2 MAX_SIG123
16 OR2 AND3DELAY OR3 H
2
SUM_SIG2 SUM_SIG3 H
2
DIFF MAX_SIG2 MAX_SIG123 OR3DELAY H
2
OR3 H
2
SUM_SIG2 SUM_SIG3 H
2
DIFF MAX_SIG2 MAX_SIG123
30 OR2 OR3DELAY AND3 H
2
MAX_SIG123 H
3
MAX_SIG2 H
2
DIFF MAX_SIG2 MAX_SIG123
AND3DELAY AND3 H
3
SUM_SIG2 H
1
SUM_SIG123 H
2
DIFF SUM_SIG2 SUM_SIG3
46 OR2 OR3DELAY AND3 H
1
SUM_SIG123 H
3
MAX_SIG2 H
2
DIFF MAX_SIG2 MAX_SIG123
OR3DELAY AND3 H
1
SUM_SIG123 H
3
MAX_SIG3 H
2
DIFF MAX_SIG3 MAX_SIG123
measured output of the digital logic is rarely
sufficient to uniquely reverse engineer the design.
Experimental observation and theoretical
analysis of the effects of uncertainty show that even
when there is a significant reduction in the quality of
input-output measurement information: the DL map
evolved by the GP will still carry enough
information for the design of signals with specific
properties. The creation of these signals is
considered of greater importance than having the
exact DL design for the SD. The signals frequently
relate to the determination of control rules for
platform or multiplatform automation.
REFERENCES
Bigus, J.P., 1996. Data Mining with Neural Nets, New
York, Mc Graw-Hill, Chapter 1.
Koza J.R., Bennett F.H., Andre, D., and Keane, M.A.,
1999, Genetic Programming III: Darwinian Invention
and Problem Solving. San Francisco, Morgan
Kaufmann Publishers, Chapter 2.
Smith, J. F., 2003a. Fuzzy logic resource manager:
decision tree topology, combined admissible regions
and the self-morphing property, In: I. Kadar ed.,
Signal Processing, Sensor Fusion, and Target
Recognition XII, April, Orlando, SPIE Proceedings,
pp. 104-114.
Smith, J. F., 2003b. Fuzzy Logic Resource Manager:
Evolving Fuzzy Decision Tree Structure that Adapts
in Real-Time, In: X. Wang ed., Proceedings of the
International Society of Information Fusion 2003,
July, Cairns, Australia, International Society of
Information Fusion Press, pp. 838-845.
Smith, J. F., 2004. Fuzzy logic resource manager: real-
time adaptation and self-organization, In: I. Kadar ed.,
Signal Processing, Sensor Fusion, and Target
Recognition XIII, Vol. 5429, April, Orlando, SPIE
Proceedings, pp. 77-88.
Smith, J. F., and Nguyen; T. H., 2005. Data mining based
automated reverse engineering and defect discovery,
In: B. Dasarathy ed., Data Mining, Intrusion
Detection, Information Assurance, and Data Networks
Security Vol. 5812, April, Orlando, SPIE
Proceedings, pp. 232-242.
EVOLUTIONARY DATA MINING APPROACH TO CREATING DIGITAL LOGIC
113
