
GA-BASED APPROACH TO PITCH RECOGNITION OF MUSICAL
CONSONANCE
Masanori Natsui, Shunichi Kubo and Yoshiaki Tadokoro
Dept. of Information and Computer Sciences, Toyohashi University of Technology
1-1 Hibarigaoka, Tempaku-cho, Toyohashi-shi, Aichi 441-8580, Japan
Keywords:
Pitch recognition, Genetic algorithm, Musical consonance, Template matching.
Abstract:
This paper presents a novel method for the pitch recognition of the musical consonance (i.e., unison or octave)
using genetic algorithm (GA). GA is a kind of optimization techniques based on natural selection and genetics.
In our method, the pitch recognition is performed by the following two-step procedure: (i) search space
reduction using the comb filter estimation, and (ii) evolutionary parameter estimation of tone parameters such
as notes and volumes by minimizing error between a target waveform and a synthesized waveform using sound
templates with estimated parameters. The potential capability of the system is demonstrated through the pitch
estimation of randomly-generated consonances. Experimental results show that the system can successfully
estimate chords with more than 84% success rate for two-note consonances, and more than 71% success rate
for three-note consonances.
1 INTRODUCTION
Automatic music transcription is important for many
applications including music archival, music retrieval,
supports of music composition/arrangement, and also
significant problems in machine perception(Sterian
and Wakefield, 2000; Pollastri, 2002; Roads, 1985;
Roads, 1996; Piszczalski and Galler, 1977). The
study of automatic musical transcription can be clas-
sified into some categories, and that of the pitch detec-
tion is the most important task and many studies have
been done. Most of old studies are for monophony,
and based on the spectrum analysis using the fast
Fourier transform (FFT). On the other hand, the novel
technologies such as neural network, fuzzy logic, and
hidden Marcov model have also been proposed in the
recent studies(Klapuri, 2003).
For the pitch estimation of polyphonic sounds, we
have proposed a unique method based on comb filters
(H(z) = 1 − z
−N
)(Tadokoro and Yamaguchi, 2001;
Tadokoro et al., 2002; Tadokoro et al., 2003). The
comb filter can eliminate a fundamental frequency
and its harmonic components of a sound by simple
subtraction. So far, we have presented that cascade
or parallel connections of the comb filters enable the
polyphonic pitch estimation and can be effective for
the realization of the automatic music transcription
system.
A difficult problem in the polyphonic pitch estima-
tion is that some frequency components of one note
may be overlapped with harmonics of other notes.
In fact, composers often use chords containing notes
that have a simple ratio between their fundamental
frequencies, such as 1:1 (perfect unison), 2:1 (per-
fect octave), or 3:2 (perfect fifth), since these codes
called consonances typically produce sounds which
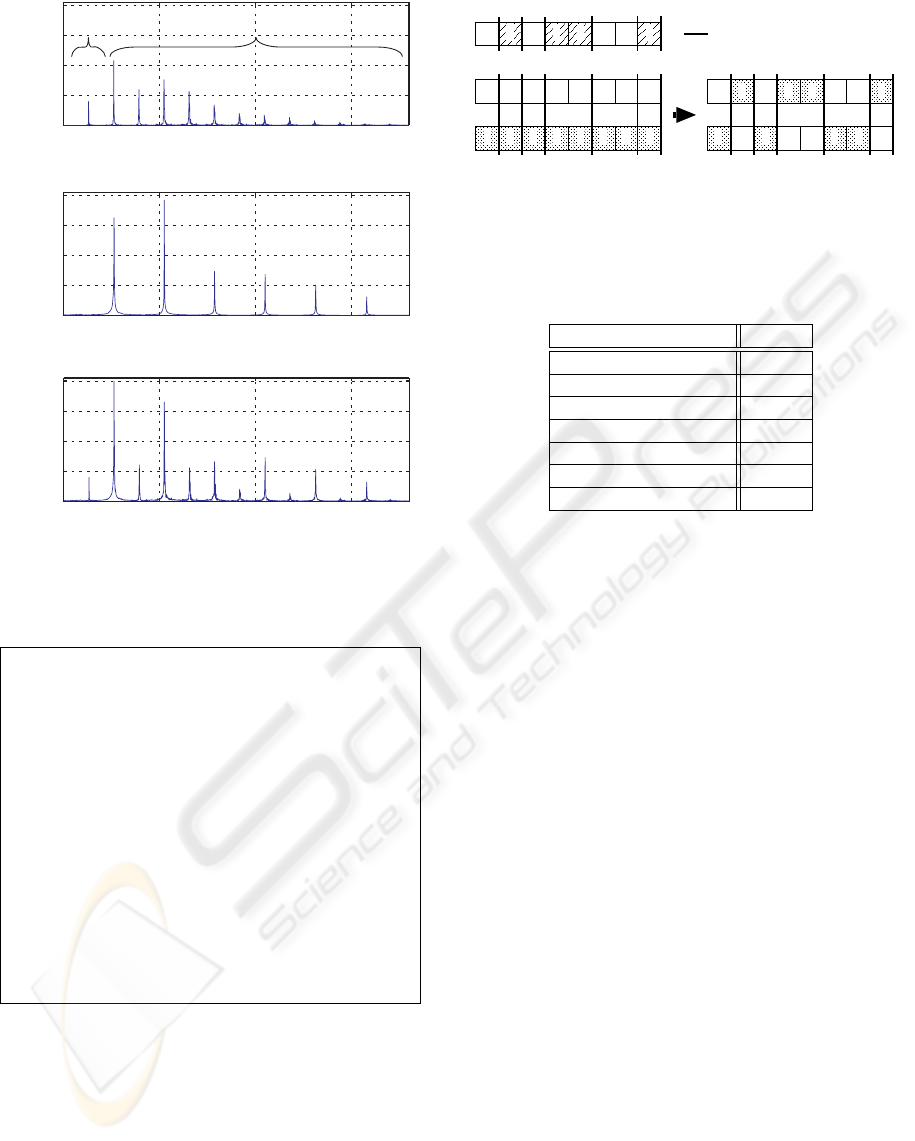
are pleasing to the human ear. If one note having a
fundamental frequency of f Hz and another note hav-
ing that of 2f Hz are produced at the same time, then
every harmonic of the upper note will be overlapped
to the even harmonics of the lower note (Fig. 1). To
infer the presence of the upper note, we have to use
some other information which is obtained by a tech-
nique except traditional methods such as spectrum
analysis.
From this viewpoint, we propose a unique method
of the pitch estimation based on genetic algorithm
(GA). GA is an optimization algorithm based on a
model of evolution in life. In this paper, we demon-
strate the possibility of the GA-based pitch estimation
method through the experimental pitch estimation of
musical consonance. The key ideas presented here
are: (i) time-domain template matching based on GA,
and (ii) search space reduction using the pitch estima-
47
Natsui M., Kubo S. and Tadokoro Y. (2006).
GA-BASED APPROACH TO PITCH RECOGNITION OF MUSICAL CONSONANCE.
In Proceedings of the Third International Conference on Informatics in Control, Automation and Robotics, pages 47-52
DOI: 10.5220/0001209400470052
Copyright
c
SciTePress
0 500 1000 1500
0
200
400
600
800
Amplitude
Frequency [Hz]
Fundamental frequency
Harmonic frequencies
(a) Horn C3
0 500 1000 1500
0
200
400
600
800
Amplitude
Frequency [Hz]
(b) Piano C4
0 500 1000 1500
0
200
400
600
800
Amplitude
Frequency [Hz]
(c) Polyphony of Horn C3 and Piano C4
Figure 1: Spectra of music instruments: (a) Horn C3, (b)
Piano C4, and (c) polyphony of the two tones.
program Genetic Algorithm;
begin
t := 0;
{t: Number of generations.}
initialize(P (t));
{P (t): Population.}
evaluate(P (t));
while t ≤ Max . num. of gen. do
begin
C(t) := crossover(P (t));
M(t) := mutation(P (t));
evaluate(C(t) ∪ M(t));
P (t + 1) := select(C(t) ∪ M(t) ∪ P (t));
t := t + 1;
end
end.
Figure 2: Typical flow of GA.
tion result based on the comb filetrs.
This paper is organized as follows: Section 2
presents the basic concept of the pitch estimation sys-
tem using GA. Section 3 shows an overview of the
proposed pitch estimation system. Section 4 demon-
strates the experimental result of the pitch estimation.
Section 5 is the conclusion and future prospects.
0 1 1 1 10 0 0
crossover point
mask pattern
1 0 0 1 01 1 0
1 1 0 0 10 1 1
1 1 1 0
1 0 1 1
1 0 0 1
0 0 1 0
chromosome
Figure 3: Uniform crossover.
Table 1: Instruments and pitches stored in the sound tem-
plate.
Instrument Pitch
Alt Saxophone (AS) D3A5
Clarinet (CL) D3B5
Horn (HR) C3F5
Trumpet (TR) E3B5
Viora (VL) C3B5
Violin (VN) G3B5
Piano (PF) C3B5
2 GENETIC ALGORITHM
Genetic algorithm (GA) can be regarded as a unique
variation of evolutionary computation techniques
(Back et al., 1997; Holland, 1975; Goldberg, 1989).
In general, evolutionary methods mimic the process
of natural evolution, the driving process for emer-
gence of complex structures well-adapted to the given
environment. The better an individual performs under
the conditions the greater is the chance for the individ-
ual to live for a longer while and generate offspring.
As a result, the individuals are transformed to the suit-
able forms on the designer’s defined constraint.
Figure 2 shows the overall procedure of GA. At
first, GA generates embryonic individuals randomly
to form the initial population P (0). In the traditional
GA, each individual is represented by a fixed-length
bit string. The next step is to evaluate a fitness func-
tion at all individuals in P (t). A value for fitness is
assigned to each individual depending on how close
it actually is to solving the problem. After the eval-
uation, the system selects a set of individuals having
higher fitness values to perform evolutionary opera-
tions: crossover and mutation. The crossover recom-
bines two individuals into two new bit strings. The
mutation operation, on the other hand, flips the val-
ues of chosen bits to their complements. There are
many ways how to do crossover and mutation. For
example, Figure 3 shows an example of crossover op-
eration called uniform crossover.
ICINCO 2006 - SIGNAL PROCESSING, SYSTEMS MODELING AND CONTROL
48
Estimation
result
Select tone
candiates
Set amplitude
phase &
synthesize
Synthesized signal
Target signal
Trumpet C4
Trumpet C5
Reduce
search space
GA
+
Comb filter estimation
Build sound
template
Calculate
distance
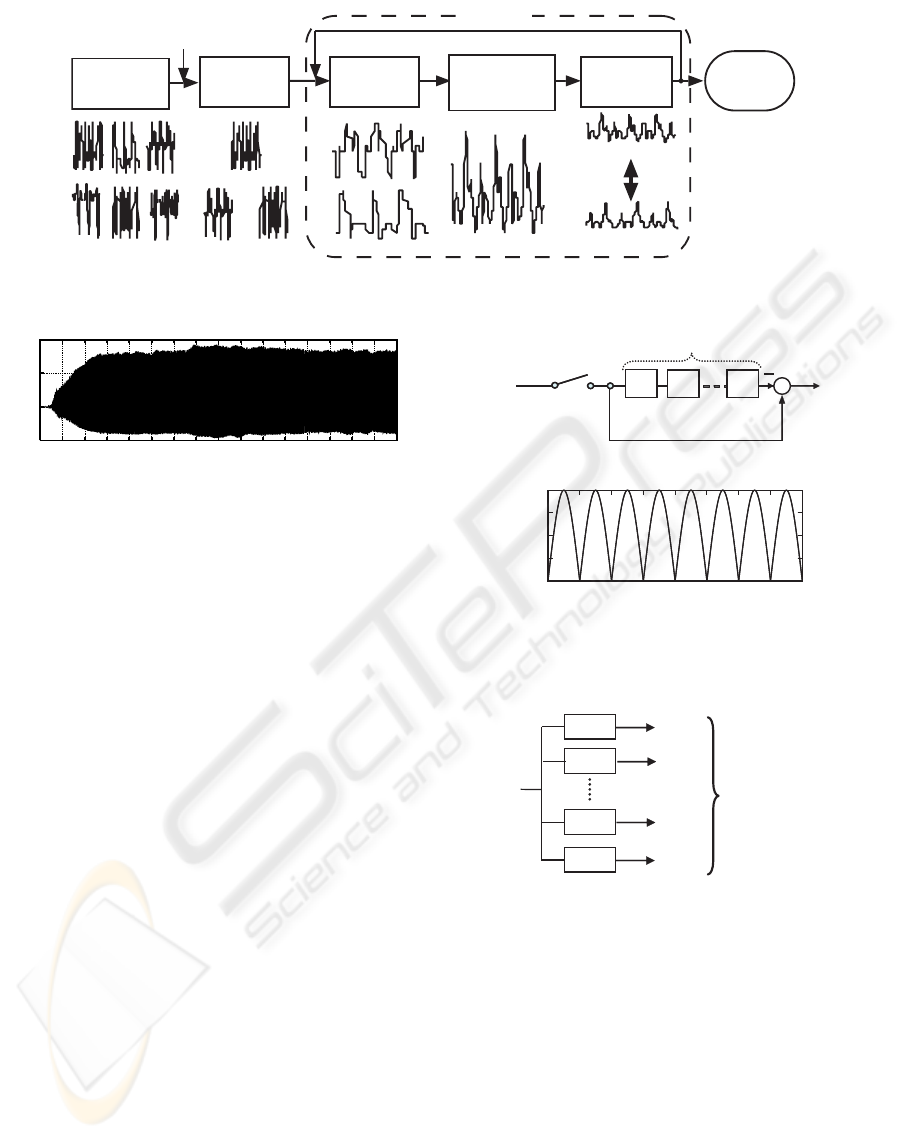
Figure 4: Overview of the proposed system.
2.01.751.51.251.0 0.75 0.5 0.25 0
Amplitude
Time [s]
0.8
0.4
0.0
-0.4
Figure 5: Sound waveform (Trumpet, C4).
3 PITCH ESTIMATION SYSTEM
USING GA
Figure 4 shows the overview of the proposed pitch es-
timation system. At first, we make a database which
contains waveforms of sound templates. Then the
system determines waveforms for the estimation by
using the result of comb-filter-based pitch estimation.
Finally, the system applies GA to search the opti-
mal parameters such as amplitudes and phases, which
minimize the squared error between a target wave-
form and a generated one. A more detailed descrip-
tion is provided in the following.
3.1 Sound Template
We make a database which contains a waveform of
each instrument and tone shown in Table 1. In this
experiment, the RWC music database(Goto, 2004) is
used as the original data. We use a waveform ap-
peared after 500ms from the beginning of a sound
data, which is considered to have the level of the
steady state amplitude (sustain), as a sound template.
The sampling rate is 44.1 kHz, and the length of each
template is 54ms (2385 points). Note that the maxi-
mum amplitude of each template is normalized to 1.0.
fs
x(t)
x(n)
y(n)
1−
1−
1−
−
N
+
z
z
z
1−
1−
1−
0
0.5
1
1.5
2
Amplitude
[Hz] fs
fp 3fp2fp
(a)
(b)
Frequency
Figure 6: Notch-type comb filter: (a) block diagram, and
(b) frequency characteristic.
max1
y
max2
y
max12
y
H
1
(z)
H
2
(z)
H
12
(z)
C
C#
B
)(nx
max11
y
H
11
(z)
A#
Detect
minimum output
Figure 7: Parallel-connected comb filters for pitch estima-
tion.
3.2 Search Space Reduction Using
Comb Filter Estimation
The transfer function of the notch-type comb filter for
a tone p is written by
H
p
(z) = 1 − z
−N
p
, N
p
= [f
s
/f
p
],
where f
s
is a sampling frequency, and f
p
is a funda-
mental frequency for the tone p. The block diagram
and its frequency characteristic are shown in Fig. 6
(a) and (b), respectively. The spectrum of a single
note from a musical instrument usually has a set of
GA-BASED APPROACH TO PITCH RECOGNITION OF MUSICAL CONSONANCE
49

Table 2: Target parameters.
Paramater Name Range Bit
Instrument
and note
note
k
1 ∼ T
∗
⌈T/2⌉
Amplitude amp
k
0 ∼ 1.0 8
Phase phase
k
0 ∼ 2π 6
(T: Number of templates after the search space reduction)
6bit8bit
[T/2] bit
Tone 2 Tone n
phasekampknotek
...
Tone 1
Tone bit Tone bit Tone bit
Tone * K bit
Figure 8: Individual representation.
peaks at harmonic ratios. That is, if the fundamental
frequency is f
p
, there are peaks at f
p
, and also at 2f
p
,
3f
p
, 4f
p
, etc. Consequently, the operation of H
p
(z)
eliminates all frequency components of the target tone
at once.
As in the case of usual methods based on spec-
trum analysis, the comb filtering cannot separate the
overlapped frequency components. For example, let a
polyphony be composed of C3, E3, G3, and C4. We
can estimate only the presence of C3, E3, and G3 by
using a parallel-connected comb filters (Fig. 7), while
the note C4 cannot be detected since every harmonic
of the note C4 is overlapped to the even harmonics of
the note C3. However, if we know the input sound is a
chord of four notes, we can also estimate that a funda-
mental frequency of another tone is equal to the one
of the known three tones. That is, the search space
of sound templates can be reduced to the one which
contains only the following tones:
Harmonics of C3: C4, G4, C5, E5,
Harmonics of E3: E4, B4, E5, G#5,
Harmonics of G3: G4, D4, G5, B5.
It achieves a reduction in the size of the search space
and an improvement in the search efficiency.
3.3 Parameter Optimization Using
GA
Figure 8 shows an individual representation in the
system, which corresponds to a unique polyphonic
sound. Here K is the number of tones included in a
target polyphony, and amp
k
, note
k
, and phase
k
are
parameters for kth notes, which have bit lengths and
ranges of values shown in Table 2.
Table 3: Main parameter values for GA.
Parameter Value
Maximum number of generations 250
Population size 750
Crossover method Uniform
Crossover rate 0.8
Mutation rate 0.05
Mutation method Uniform
At the beginning of a new evolutionary run, the sys-
tem creates a set of randomly generated bit strings
with above data format to form the initial population.
A generated bit string is interpreted as its correspond-
ing waveform defined as follows:
x
′
(n) =
K
X
k=1
N
X
n=1
amp
k
· x
note
k
(n + phase
k
f
s
f
k
· 2π
),
where x
note
k
(n) is a waveform of template note
k
,
N is a window size, f
s
is a sampling frequency, and
f
k
is a fundamental frequency of a template note
k
.
Through an evolutionary run, the system searches the
optimal waveform which minimizes the error as fol-
lows:
error =
N
X
n=1
{x(n) − x
′
(n)}
2
,
where x(n) is a target waveform.
4 EXPERIMENT
We demonstrate the potential capability of the GA-
based pitch estimation of musical consonance. Note
that the input sounds used in this experiment are
polyphony which contain at least one consonance
whose fundamental frequency ratio can be simply
represented by 1 : n (n: integer). Table 3 summa-
rizes the system parameters in this experiment. A set
of evolutionary runs were carried out on a Linux PC
(CPU: Intel Xeon 2.8GHz dual, RAM: 2GByte).
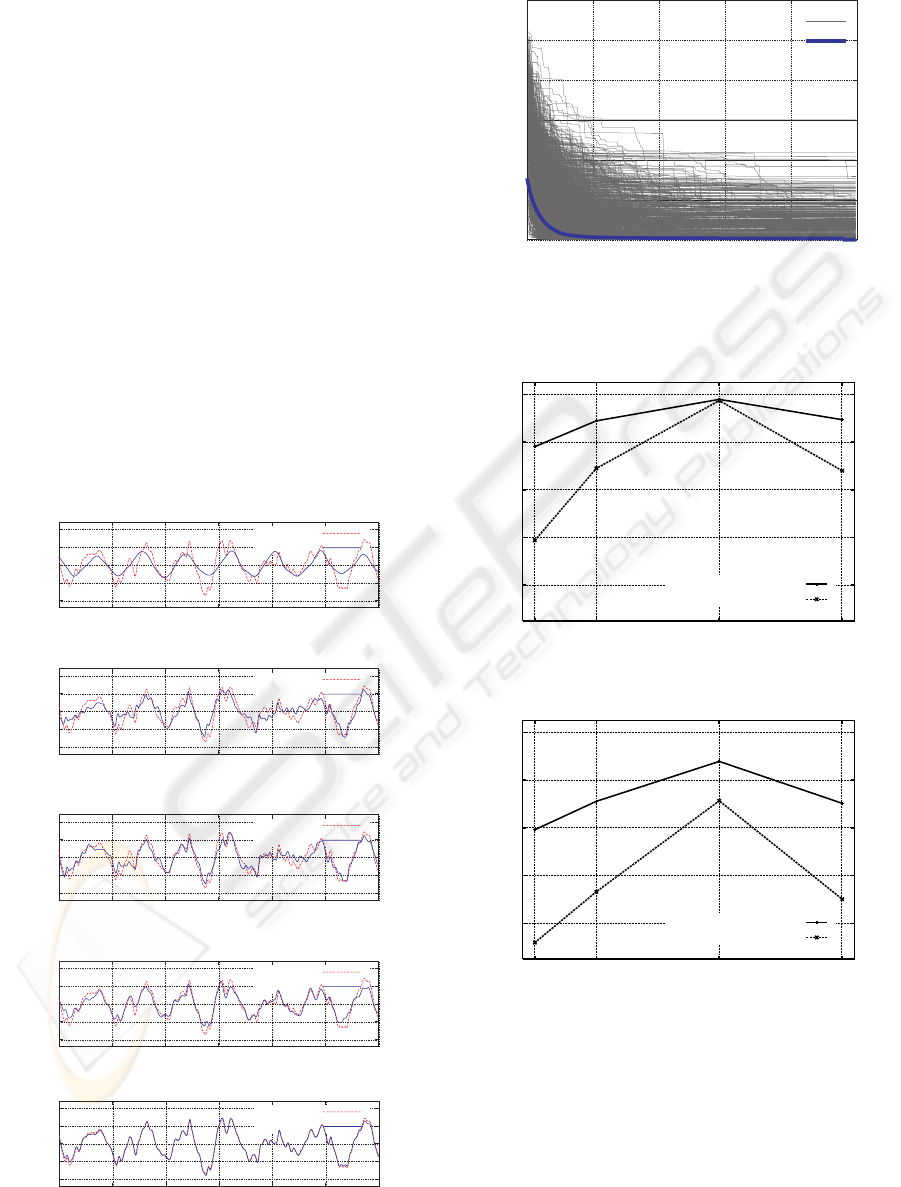
Figure 11 shows a fitness transition of the error be-
tween a generated waveform and a target one. Target
sounds considered here are polyphony of randomly-
selected three tones. We can see the staircase im-
provements of the best individual fitness on average.
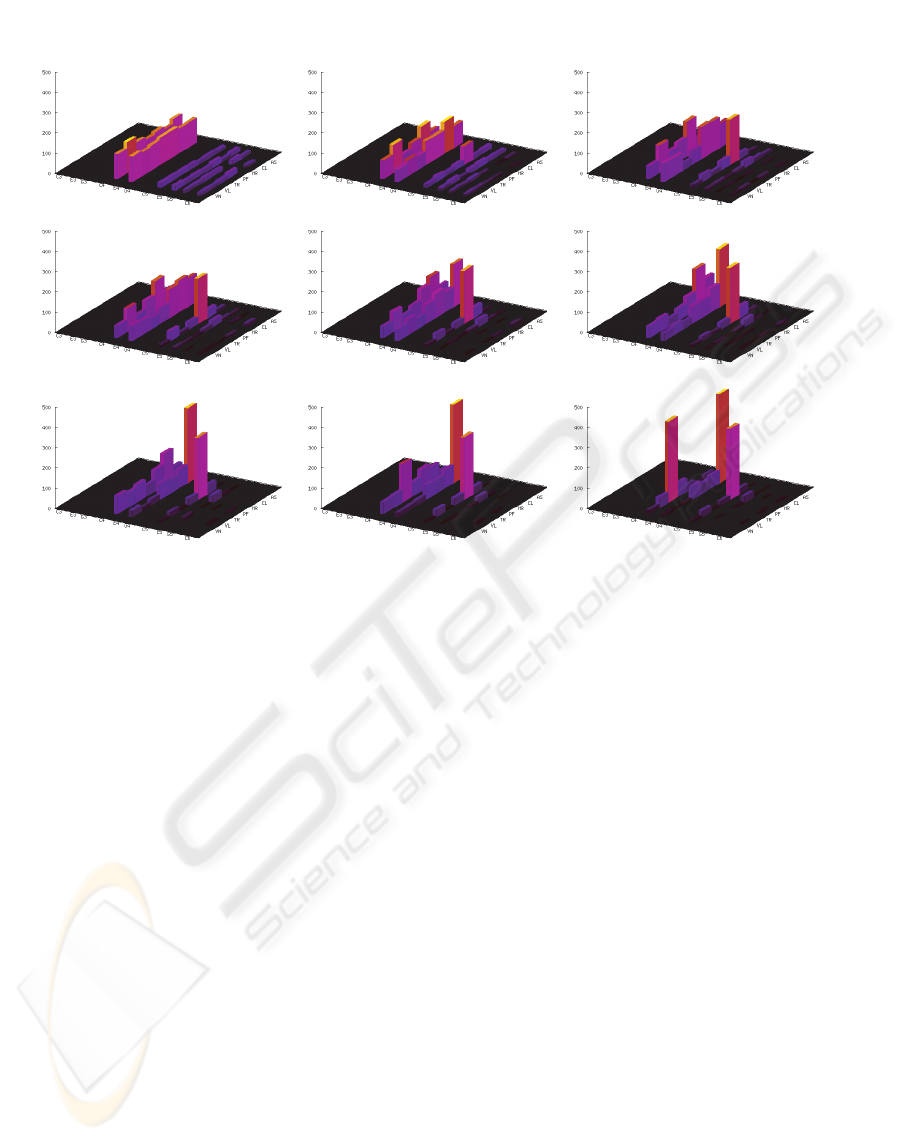
Figures 9 and 10 depict an example snapshot of the
population and a waveform of the best fitness indi-
vidual on each generation. In Fig. 9, the horizontal
axes indicate types of music instruments and pitches
of tones, and the vertical axis indicates the number of
individuals which contains a certain instrument and
pitch. The input sound considered here is a polyphony
of Trumpet C4, Alto Saxophone E4, and Horn C5.
Given the initial random generation, the evolution is
ICINCO 2006 - SIGNAL PROCESSING, SYSTEMS MODELING AND CONTROL
50
The 30th
generation
The 35th
generation
The 40th
generation
The 15th
generation
The 20th
generation
The 25th
generation
The 0th
generation
The 5th
generation
The 10th
generation
Instruments
Pitches
Instruments
Pitches
Instruments
Pitches
Instruments
Pitches
Instruments
Pitches
Instruments
Pitches
Instruments
Pitches
Instruments
Pitches
Instruments
Pitches
Num. of individuals
Num. of individuals
Num. of individuals
Num. of individuals
Num. of individuals
Num. of individuals
Num. of individuals
Num. of individuals
Num. of individuals
Figure 9: Population transition.
mainly driven towards finding one correct tone, then
the system eventually shifts to the search of another
tone. Finally, the system successfully finds a set of
tones and parameters which minimizes the squared
error between the target waveform and the generated
one.
Next, we evaluate the robustness of the system for
the increase of the number of tones and the instability
of the amplitude. Figures 12 and 13 show the accu-
racy of the pitch and instrument estimation on each
condition. We have performed 5000 evolutionary runs
for every condition. We can obtain the pitch estima-
tion accuracy of more than about 90% for two tones
and 70% for three tones when the time region of the
target sound begins from 250ms, 500ms, or 750ms.
On the other hand, the accuracy decreases when the
time region of the input sound is from 125ms. This is
because a waveform of the input sound is in the attack
or decay region, where the amplitude of the waveform
changes significantly. For the practical application to
the automatic pitch estimation, we should introduce
additional information which improves the robustness
of the system.
5 CONCLUSION
In this paper, we have presented a possibility of the
GA-based pitch estimation method through the exper-
imental pitch estimation of the musical consonance.
An experimental pitch estimation system has a capa-
bility of analyzing the pitches of consonances, which
have not been realized by the conventional methods.
REFERENCES
Back, T., Hammel, U., and Schwefel, P. H. (1997). Evo-
lutionary computation: Comments on the history and
current state. IEEE Trans. Evolutionary Computation,
1(1):3 – 13.
Goldberg, D. (1989). Genetic Algorithms in Search, Op-
timization and Machine Learning. Addison-Wasley
Publishing Company.
Goto, M. (2004). Development of the rwc music database.
Proceedings of the 18th International Congress on
Acoustics (ICA 2004), pages I–553–556.
Holland, J. H. (1975). Adaptation in Natural and Artificial
Systems. University of Michigan Press.
Klapuri, A. (2003). Multiple fundamental frequency es-
timation based on harmonicity and spectral smooth-
ness. IEEE Transactions on Speech and Audio Pro-
cessing, 11(6):804–816.
Piszczalski, M. and Galler, B. (1977). Automatic music
transcription. Computer music journal, 1(4):24–31.
Pollastri, E. (2002). A pitch tracking system dedicated to
process singing voice for musical retrieval. Proceed-
GA-BASED APPROACH TO PITCH RECOGNITION OF MUSICAL CONSONANCE
51
ings of 2002 IEEE International Conference on Mul-
timedia and Expo (ICME).
Roads, C. (1985). Research in music and artifical intelli-
gence. ACM Computing Surveys, 17(2):163–190.
Roads, C. (1996). The computer music tutorial. MIT Press.
Sterian, A. and Wakefield, G. (2000). Music transcription
systems: from sound to symbol. Proceedings of AAAI-
2000 workshop on artifical intelligence and music.
Tadokoro, Y., Matsumoto, W., and Yamaguchi, M. (2002).
Pitch detection musical sounds using adaptive comb
filters controlled by time delay. Proceedings of 2002
IEEE International Conference on Multimedia and
Expo (ICME), P03.
Tadokoro, Y., Morita, T., and Yamaguchi, M. (2003). Pitch
detection of musical sounds noticing minimum out-
put of parallel connected comb filters. Proceed-
ings of 2003 IEEE Region 10 Conference on Conver-
gent Technologies For The Asia-Pacific (TENCON),
tencon-072.
Tadokoro, Y. and Yamaguchi, M. (2001). Pitch detection
of duet song using double comb filters. Proceedings
of 2001 European Conference on Circuit Theory and
Design (ECCTD), I:57–60.
-1
-0.5
0
0.5
1
target
evolved
Amplitude
The 0th generation
-1
-0.5
0
0.5
1
target
evolved
Amplitude
The 10th generation
-1
-0.5
0
0.5
1
target
evolved
Amplitude
The 20th generation
-1
-0.5
0
0.5
1
target
evolved
Amplitude
The 30th generation
700 800 900 1000 1100 1200 1300
-1
-0.5
0
0.5
1
Sampling index
target
evolved
Amplitude
The 40th generation
Figure 10: Waveform transition.
0
20
40
60
80
100
120
0 50 100 150 200 250
error
Generations
Average for 5000 runs
Minimum error on each gen.
Figure 11: Transition of the sum of squared errors between
the target waveform and the synthesized one.
20
0
40
60
80
100
125 250 500 750
pitches
pitches and instruments
Pitch estimation accuracy [%]
Generations
Figure 12: Accuracy of pitch/instrument estimation for two
notes.
20
0
40
60
80
100
125 250 500 750
pitches
pitches and instruments
Pitch estimation accuracy [%]
Generations
Figure 13: Accuracy of pitch/instrument estimation for
three notes.
ICINCO 2006 - SIGNAL PROCESSING, SYSTEMS MODELING AND CONTROL
52
