
NEURAL NETWORK SYSTEM FOR WASTE-WATER
RECOGNITION
Radek Kuchta, Radimir Vrba
Department of Microelectronics, Brno University of Technology, Udolni 53, 602 00 Brno, Czech Republic
Keywords: Neural network, waste-water, DSP, PCA.
Abstract: This paper presents modern method of using neural network for waste-water recognition by using sensor
array. Each sensor in sensor array detects chemicals in waste-water with different sensitivity. Set of
measured data is digitized and recognized by a neural network. Measuring process doesn’t need any human
operator. The result gives the only information: contaminated or not contaminated.
1 INTRODUCTION
Many Internet service providers and online services
require you to manually enter information, such as
your user name and password, to establish a
connection. With Scripting support for Dial-Up
Networking, you can write a script to automate this
process.
Many manufacturing companies and manufacturing
plants produce a lot of impure waste-water. This
water is processed thru sewerage plant and after
cleaning it is delivered to the wide open space. It is
necessary to test quality regularly for quality
assurance. It is possible to use different methods of a
chemical analysis for these tests. The price and
necessity of human operators are the main
disadvantages.
The main motivation for sensor array based devices
developed is to design low cost, precise, mobile
devices for reproducibility of analyzing of impure
waste-water in real-time mode. These devices are
produced for classification and recognition of
liquids, gasses, foods and other substances.
2 SENSOR ARRAY APPLICATION
In many applications for chemical sensors,
information can be gathered not only from a steady-
state value of a sensor response, but also from the
kinetics of response. However, using steady-state
sensor value to classify different mixture liquid
chemicals results in losing of a great deal of
information in the sensor signal.
The main function of these devices is to identify and
quantify structure of chemicals. The system consists
of the array of electrochemical sensors. This array
contains sensors of various types. Each sensor
detects more than one chemical, some of them with
higher sensitivity, and some others with lower
sensitivity, depending on individual sensor
characteristics. Sensors are fixed in a temperature
stabilized vessel filled with measured liquid mixture.
Sensor response is digitized by an AD converter.
There are another temperature and humidity sensors
located in gas chamber, too. The set o digitized data
is forwarded to the bus-connected computer for final
recognition and analysis.
To recognize all chemicals of waste-water, it is
necessary to make analyses of all measured data. It
is possible to exploit several methods to reach
analyzed results. One of these methods is to extract
the main measured curve parameters by hand. Four
fundamental curve parameters (Vernat-Rossi, et al.,
1996) are depicted in Figure. 1: kmax for maximum
slope, max for maximum value, sr30 for the
response on time 30 s and mean for average value of
the whole set of points. This method is not much
competent, because the target is to design an
autonomous system, which works without operator’s
assistance.
199
Kuchta R. and Vrba R. (2006).
NEURAL NETWORK SYSTEM FOR WASTE-WATER RECOGNITION.
In Proceedings of the Third International Conference on Informatics in Control, Automation and Robotics, pages 199-202
DOI: 10.5220/0001208201990202
Copyright
c
SciTePress
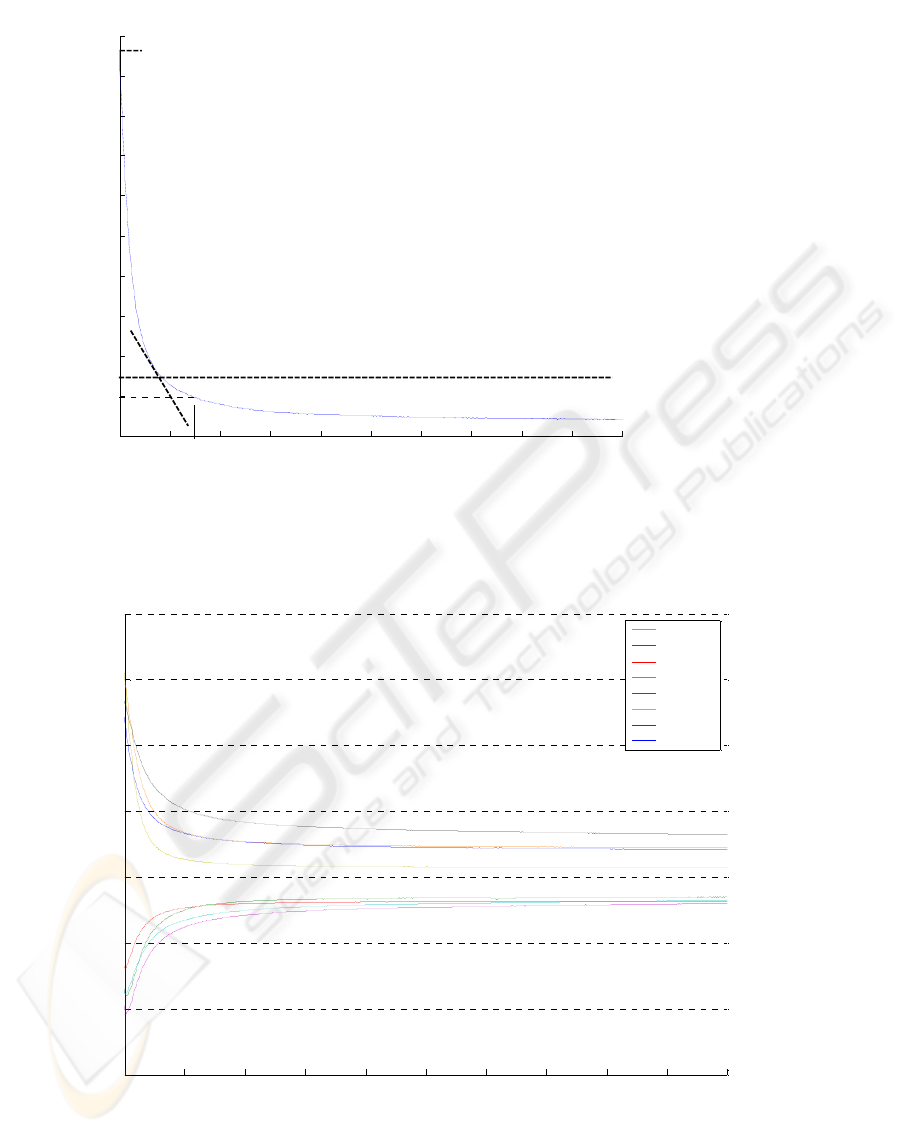
Figure 1: Sensor response curve with fundamental analyzing parameters.
Figure 2: Sensor array response curve.
0 20 40 60 80 100 120 140 160 180 200
-0.6
-0.4
-0.2
0
0.2
0.4
0.6
0.8
time [s]
sensor response [V]
sensor1
sensor2
sensor3
sensor4
sensor5
sensor6
sensor7
sensor8
0 20 40 60 80 100 120 140 160 180 200
0.05
0.1
0.15
0.2
0.25
0.3
0.35
0.4
0.45
0.5
0.55
time [s]
sensor response [V]
max
mean
kmax
t = 30 s
sr30
ICINCO 2006 - INTELLIGENT CONTROL SYSTEMS AND OPTIMIZATION
200
S
1
S
2
S
3
S
n
H
1
H
2
H
3
H
n
O
sensor array output layerhidden layer
sensor 1
sensor 2
sensor 3
sensor n
input layer
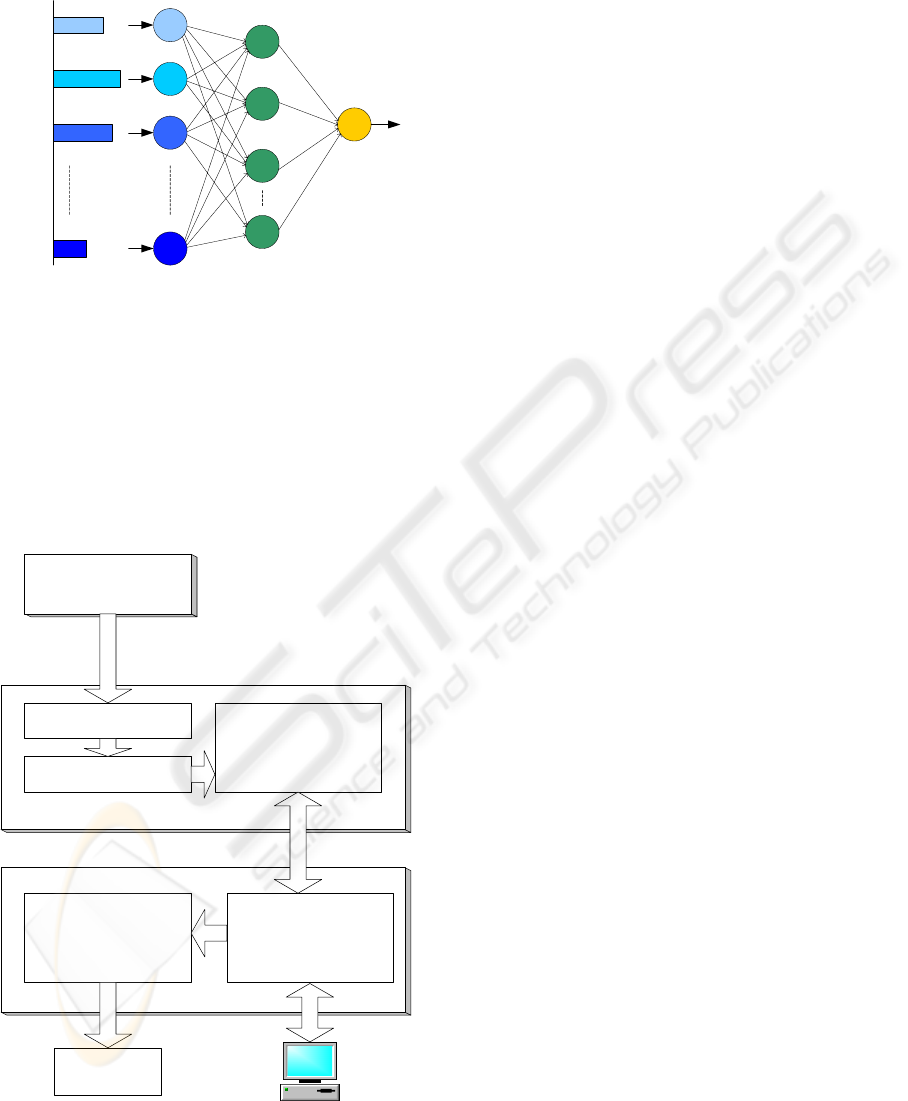
Figure 3: Block diagram of neural network processing
signals stimulated by n sensors.
Another method selects main typical points, then
tries to approximate measured values and finally
compares them with those derived from the
mathematical model. If too many features are used,
mathematical model will be huge and complex. For
this reason it is necessary to reduce number of points
which are used for recognition without losing
resolution.
processor part
sensor array
multiplexer
ADC
preprocessor unit
I/O portsneural network
LCD
display
PC
A
B
Figure 4: Block diagram of recognizing system.
If the sensor array contains eight different sensors
with various characteristics, their responses to
analyzed liquid mixture generate eight different
characteristics. The reason is that each sensor works
with different sensitivity to different chemical
components. Sensor array response curves are drawn
in Fig. 2. For description of these characteristics it is
possible to use e.g. four parameters, which describe
measured data with sufficient resolution. We know
the wage of measurement exactly in time which is
near stable-state. Therefore, from each curve, 4
fundamental parameters are extracted (Fig.1), and
for 8 sensors we collect totally 32 values.
These 32 parameters may form input values for
appropriate statistical method for data processing
and analysis.
3 NEURAL NETWORK
An artificial back-propagation neural network is
very often used for detailed recognition. There is a
block diagram of the neural network shown in Fig.
3. The input layer has the same number of neurons
like the number of input values. Number of neurons
in the output layer depends on the desired values. In
this application we usually want to know, if waste-
water is contaminated or not. It means that number
of the output neurons will by only one. The artificial
neural network will be realized by a microprocessor
or a DSP digital signal processor.
Block diagram of the system is shown in Fig. 4. The
system co-operates with external or internal sensor
array. Sensors´ responses are converted and digitized
in part A of the recognition system. Superimposed
signal noise is suppressed by a noise filter in part A,
too.
Recognition part and the neural network are situated
in part B of the system. The system is connected to a
personal computer via a standard (RS-232 or USB)
interface for measured data storing. Essential
information resulting the sensor signal processing is
displayed on embedded LCD display. In much more
details the results are available in a connected PC
frame.
4 CONCLUSION
For waste-water recognition several methods may be
exploiting. This paper presents the basic description
of a low cost method, which works in real-time
mode without device operator assistance. This
NEURAL NETWORK SYSTEM FOR WASTE-WATER RECOGNITION
201

method can be used to recognize liquid components
in a sewerage plant. It is based on sensor array, used
to measure concentration and composition of
chemicals. Neural network is used for final
recognition. The final result of recognition gives the
binary information: contaminated or not
contaminated, which is sufficient.
ACKNOWLEDGEMENTS
The research has been supported by the Czech
Ministry of Education in the frame of MSM
0021630503 MIKROSYN New Trends in
Microelectronic Systems and Nanotechnologies
Research Project, partly supported by Micro- and
nano-sensor structures and systems with embedded
intelligence (MINASES), GACR 102/06/1624
Project financed by the Czech Science Foundation
and under the contract GA102/03/H105
REFERENCES
Šnorek, M., Jiřina, M.: Neuronové sítě a neuropočítače.
Praha, Vydavatelství ČVUT 1996, ISBN 80-01-
01455-X
Bíla, J.: Umělá inteligence a neuronové sítě v aplikacích.
Praha, Vydavatelství ČVUT 1996, ISBN 80-01-
01275-1.
Sinčák, P., Andrejková, G.: Neurónové siete Inžiniersky
prístup (1. diel). Košice, ELFA Press 1996, (in
Slovak)
Sinčák, P., Andrejková, G.: Neurónové siete Inžiniersky
prístup (2. diel. Košice, ELFA Press 1996, (in Slovak)
Neruda, R.: Umělé neuronové sítě a jejich použití
v lékařských datech.
Xiaobo, Z., Jiewen, Z., Shouyi, W., Xingyi, H.: Vinegar
Classification Based on Feature Extraction and
Selection From Tin Oxide Gas Sensor Array Data.
International symposium on sensor science – I3S
2003, Paris (France), ISSN 1424-8220
Gardner, J.W.; Bartelet, P.N.: Electronic nose: Principles
and Applications. Oxford University Press 1999, 1-4,
pp. 185-207
Christophe, S. et al.: Potential of semiconductor sensor
arrays for the origin Authentication of pure valencia
orange Juices. Journal of Agricultural & Food
Chemistry 2001, 49, pp. 3151-3160,
Giuseppe, Z. et al.: Determination of organic acids, sugars,
diacetyl, and action in cheese by high performance
liquid chromatographic. Journal of Agricultural &
Food Chemistry 2001, 49, ISSN 2722-2726, Sensors
2003, 3 109
Vernat-Rossi, V., Garcia, C., Talon, R. et al.: Rapid
discrimination of meat products and bacterial strains
using semi-conductor gas sensors. Sensors and
Actuators B 1996, 37, pp. 43-48.
Vrba, R. et al.: ANTOPE Research of New Methods for
Instrumental Analysis of Toxicity for Integral
Measurement of Toxicity in Food Industry and Their
Confirmation by a Prototype of Analyzer of the
Toxicity of Pesticides. MPO FD 42K/253 R&D
Project, Research Report, FEEC BUT and MPO, 2002
ICINCO 2006 - INTELLIGENT CONTROL SYSTEMS AND OPTIMIZATION
202
