
DIFFERENT CLASSIFIERS FOR THE PROBLEM OF
EVALUATING CORK QUALITY IN AN INDUSTRIAL SYSTEM
Beatriz Paniagua-Paniagua, Miguel A. Vega-Rodríguez, Juan A. Gómez-Pulido,
Juan M. Sánchez-Pérez
Dept. Informática, Univ. Extremadura, Escuela Politécnica, Campus Universitario s/n, 10071, Cáceres, Spain
Keywords: Image processing, industrial application, cork quality, automated visual inspection system, classifiers.
Abstract: In this paper we study the use of different classifiers to solve a classification problem existing in the cork
industry: the cork stopper/disk classification according to their quality using a visual inspection system.
Cork is a natural and heterogeneous material, therefore, its automatic classification (usually, seven different
quality classes exist) is very difficult. The classifiers, which we present in this paper, work with several
quality discriminators (features), that we think could influence cork quality. These discriminators (features)
have been checked and evaluated before being used by the different classifiers that will be exposed here. In
this paper we attempt to evaluate the performance of a total of 4 different cork quality-based classifiers in
order to conclude which of them is the most appropriate for this industry, and therefore, obtains the best
cork classification results. In conclusion, our experiments show that the Euclidean classifier is the one
which obtains the best results in this application field.
1 INTRODUCTION
The most important industrial application of cork is
the production of stoppers and disks for sealing
champagnes, wines and liquors. In fact, according to
the experts, cork is the most effective product,
natural or artificial, for the sealed (Fortes, 1993). In
the cork industry, stoppers and disks are classified in
different quality classes based on a complex
combination of their defects and particular features.
Due to this, the classification process has been
carried out, traditionally, by human experts
manually.
At the moment, there are several models of
electronic m
achines for the classification of cork
stoppers and disks in the market. The performance
of these machines is acceptable for high quality
stoppers/disks, but for intermediate or low quality,
the number of samples classified erroneously is
large. In conclusion, the stoppers/disks should be re-
evaluated by human experts later. This slows down
and increases in price the process enormously. Think
that, on average, a human expert needs a minimum
training period of 6 months to attain a minimum
agility, although the learning process lasts years
(compare it with other experts: wine tasters, cured
ham tasters, etcetera). Another negative aspect is the
subjectivity degree added to the classification
process due to the necessary human re-evaluation.
We have to add to these antecedents the fact that
Sp
ain is the 2
nd
world producer of cork (CorkQC,
2006), only surpassed by Portugal, and that in
Extremadura (a south-western region of Spain), for
its geographical situation, the cork industry is one of
its more important industries: it produces 10% of the
world cork (ICMC, 2006).
All these motivations have lead us to the
d
evelopment of this research, whose main objective
is the construction of a computer vision system for
cork classification based on advanced methods of
image processing and feature extraction in order to
avoid the human evaluation in the quality
discrimination process.
For this purpose we have performed a study of
th
e features that could better inform us about the
cork quality. We have focused this study on an
analysis of thresholding techniques (segmenting the
different cork defects) and textural features, in
addition to other features (like holes and different-
area defects). From this study we conclude that the
features that better define the cork quality are: the
total cork area occupied by defects, the cork texture
104
Paniagua-Paniagua B., A. Vega-Rodr
´
ıguez M., A. G
´
omez-Pulido J. and M. S
´
anchez-P
´
erez J. (2006).
DIFFERENT CLASSIFIERS FOR THE PROBLEM OF EVALUATING CORK QUALITY IN AN INDUSTRIAL SYSTEM.
In Proceedings of the Third International Conference on Informatics in Control, Automation and Robotics, pages 104-111
Copyright
c
SciTePress
contrast, the cork texture entropy, and the biggest
size defect in the cork stopper/disk.
Later, and with these results, an analysis of
different possible classifiers has been made. The
studied classifiers have been a Back-Propagation
neural network, the K-means classification
algorithm, a K-nearest neighbours classifier and the
minimum Euclidean distances classification
algorithm. In this paper we evaluate all these
classification algorithms with the purpose of
knowing which of them is the most appropriate for
our application environment.
The rest of the paper is organized as follows:
section 2 describes briefly the tools and the data
used for the development of our experiments. In
section 3, we present the features used by the
classifiers. Then, section 4 shows the theoretical
bases for the analysis we have made and other
important details. Finally, section 5 presents the final
results statistical evaluation for each classifier, while
section 6 exposes the conclusions and future work.
2 TOOLS AND DATA
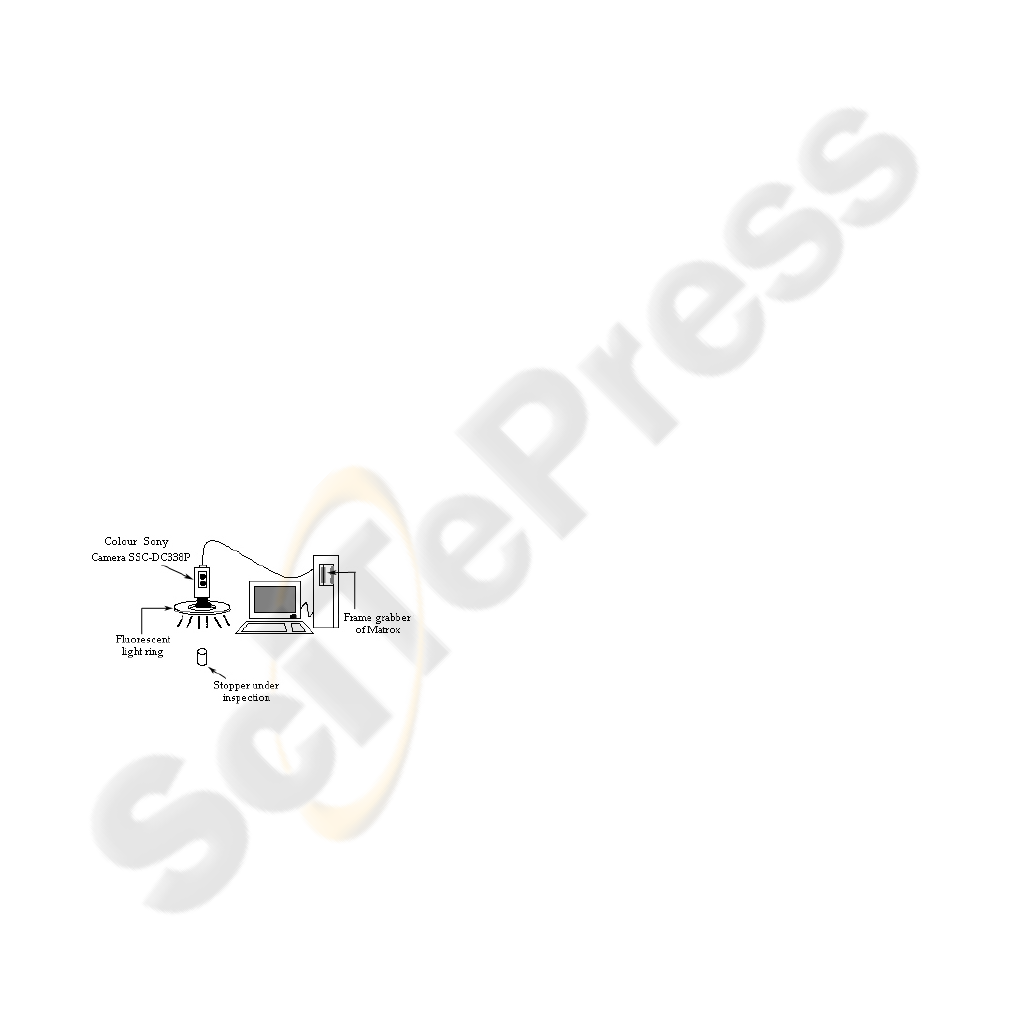
At present, the computer vision system we use to
acquire the cork stopper/disk images is formed by
the elements shown in figure 1: the host (a Pentium
processor), a colour Sony camera (SSC-DC338P
model), the illumination source (fluorescent-light
ring of high frequency -25 KHz- of StockerYale),
and a METEOR 2/4 frame-grabber of Matrox, with
the software required for the image acquisition
(MIL-Lite libraries of Matrox).
Figure 1: Computer vision system.
On the other hand, the database used in our
experiments consists in 700 images taken from 350
cork disks (we have taken two images of each disk,
for both heads). There are seven different quality
classes, 50 disks in each class. The initial
classification, in which this study is based on, has
been made by a human expert from ASECOR (in
Spanish: “Agrupación Sanvicenteña de Empresarios
del CORcho”, in English: “Cork Company Group
from San Vicente-Extremadura”). We suppose this
classification is optimal/perfect and we want to
know which classifier obtains the most similar
classification results.
3 USED FEATURES
In order to develop our classifiers study, different
feature extraction methods were analysed:
thresholding techniques, statistical texture analysis,
etcetera.
Regarding automatic thresholding, we carried
out a study of global and local thresholding
techniques (Sonka, 1998) (Sahoo, 1988). The
objective was to extract the defect area from the cork
area, thus being able to extract the percentage of the
cork area occupied by defects (an important feature
in cork quality discrimination). 11 global
thresholding methods were studied: static
thresholding, min-max method, maximum average
method, Otsu method, slope method, histogram
concavity analysis method, first Pun method, second
Pun method, Kapur-Sahoo-Wong method,
Johannsen-Bille method and moment-preserving
method. In general, global thresholding methods are
very limited in our problem. For a good global
thresholding we need bimodal histograms, and the
results obtained with unimodal histograms have
been quite bad. These methods are suitable for the
cork stopper/disk area extraction from the image
background. In this situation we can find that all
conditions for a good operation are fulfilled, but they
are not suitable for the defect area extraction from
the cork area. As for local thresholding, two
methods have been studied: statistical thresholding
method and Chow-Kaneko method. The local
thresholding methods have been more suitable than
the global methods for the solution of our problem.
This has been due to they are able to find better
thresholds in unimodal histograms. Nevertheless, the
increase of the computational cost can make them
unsuitable for our problem. Taking into account all
these considerations, the best of all these methods
applied to our problem was static thresholding
method with a heuristically fixed threshold in the
gray level 69.
With regard to texture analysis (Haralick, 1973)
(Shah, 2004), two main methods have been studied,
both based on statistical texture analysis. The first
was a method based on simple co-occurrence
matrices and another was a method based on
rotation-robust normalized co-occurrence matrices.
Furthermore, we have studied nine quality
discriminators (textural features) for each method:
energy, contrast, homogeneity, entropy, inverse
difference moment, correlation, cluster shade,
cluster prominence and maximum probability. The
DIFFERENT CLASSIFIERS FOR THE PROBLEM OF EVALUATING CORK QUALITY IN AN INDUSTRIAL
SYSTEM
105

best obtained results were with the contrast and the
entropy, both calculated by using rotation-robust
normalized co-occurrence matrices.
In addition to the total area occupied by defects
(obtained after doing an image thresholding with the
previous methods) and the texture analysis of the
cork area, other features were analysed too.
Concretely, additional studies were made on: holes
(perforations) in the cork area and size of the
biggest defect in the cork. In the case of cork holes, a
quantitative comparison is done between the
theoretical area of cork (computed using the cork
stopper/disk perimeter) and the real area of cork. If
the real area is smaller than the theoretical one
(surpassing certain threshold) we consider that the
cork has holes. In order to calculate the biggest
defect in the cork stopper/disk, the followed
methodology is to perform successive morphological
erosions on the thresholded image (defects area). In
each iteration, we control the remaining defect
percentage. In this way, we can quickly observe the
size that could have the biggest defect of the cork,
analysing the number of required iterations for
eliminating almost all the defect pixels (or required
iterations for reaching certain threshold of defect
pixels). The best results obtained in this case (the
evaluation of these two additional features) were for
the size of the biggest defect in the cork.
In conclusion, after an exhaustive feature study,
the features chosen to be used in our classifier study
were: the total cork area occupied by defects
(thresholding with heuristic fixed value 69), the
textural contrast, the textural entropy and the size of
the biggest defect in the cork.
4 METHODS
In this paper, in order to classify a cork disk in a
specific class, we will use the corresponding
classification algorithm base on the four features
selected: defects area, contrast, entropy, biggest
defect size. The four classifiers chosen for this study
are the following (Shapiro, 2001) (Sonka, 1998): a
Back-Propagation neural network, a K-means
classifier, the K-nearest neighbours classification
algorithm, and a minimum Euclidean distance
classifier.
4.1 Neural Classifier
Concretely, we have developed a Back-Propagation
neural network. An artificial neural network
represents a learning and automatic processing
paradigm inspired in the form in which the nervous
system of the animals works. It consists in a
simulation of the properties observed in the
biological neural systems through mathematical
models developed with artificial mechanisms (like a
computer). In the case of this problem, a Back-
Propagation network architecture has been chosen,
very suitable for pattern recognition and class
detection. The network designed for this study has
the following architecture:
• One input layer that is the one that receives
external signals, which will be the four features
selected during the course of this work.
Therefore, the input layer has 4 neurons.
• One hidden layer, whose number of neurons is
based on the proportion given by the following
equation:
Therefore, and knowing that the output layer
has 3 neurons, the number of hidden neurons
should be 6. But, at the end, we decided to
increase the number of neurons in the hidden
layer and increase the complexity of the weight
matrix. In this way, we make easier the learning
for the network. Due to this fact, our hidden
layer has 7 neurons.
• One output layer that gives back the results
obtained by the neural network in binary format.
As the classes to classify are seven, only 3
neurons will be necessary to codify the results
correctly.
The weights associated to the network
interconnections are initialized randomly and are
adjusted during the learning. The type of learning
used by this neural network is supervised. That is,
we present to the network pairs of patterns (an
entrance and its corresponding wished exit). While
we are showing patterns to the network, the weights
are adjusted so that the error between the real results
and the desired ones is diminished. This process is
repeated until the network is stable. After this phase,
we can run the neural network.
4.2 K-Means Classifier
As always, we have studied this classifier for the
four selected features. We have decided to study the
reliability of this classifier because of its consecrated
fame in specialized literature. This classification
algorithm makes reference to the existence of a
number of K classes or patterns, and therefore, it is
necessary to know the number of classes. We know,
a priori, that we have 7 classes, reason why the
algorithm is suitable for our necessities. K-means
ICINCO 2006 - ROBOTICS AND AUTOMATION
106
classification algorithm is a simple algorithm, but
very efficient, and due to this fact it has been so
used.
Beginning from a set of p objects to classify X
1
,
X
2
, …, X
p
, the K-means classification algorithm
makes the following steps:
Step 1
Knowing previously the number of classes, we
say K, K samples are randomly chosen and clustered
into arrays (see the following equation), and these
arrays will be the centroids (due to the fact of being
the only elements) for each class.
Step 2
Being this algorithm a recursive process with a
counter n, we can say that in the generic iteration n
we allocate all the samples {X}
1≤j≤p
among the K-
classes, as we can observe in the following equation:
In the previous equation we have indexed the
classes (that are dynamic classes) and their
centroids.
Step 3
In the moment we have allocated all the samples
among the different classes, it is necessary to update
the class centroids. With this calculation, we are
looking for to minimize the profit index that is
shown in the following equation:
This index can be minimized using the sample
average of α
i
(n) (see the following equation):
Being N
i
(n) the number of samples in class α
i,
after the iteration n.
Step 4
We check if the classification algorithm has
reached the stability, as it is shown in the following
equation:
If it does, the algorithm finishes. If not, we
return to step 2 for repeating all the process again.
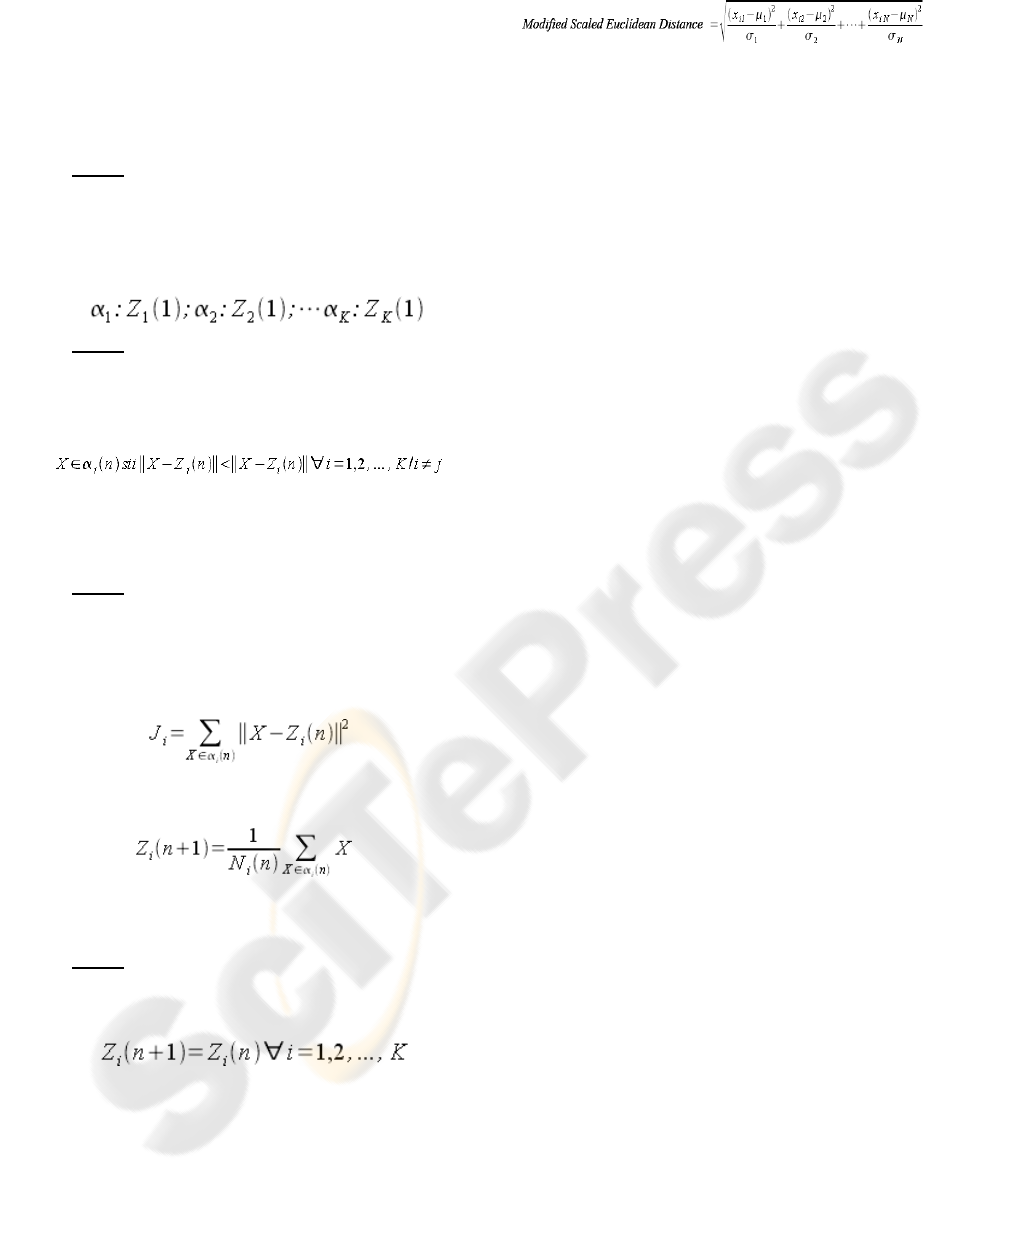
Finally, we have to say that, for the centroids
allocation, the distance shown in the following
equation was used. This is the Euclidean distance
scaled with the standard deviation instead of with
the variance, which gave better results in a previous
study.
4.3 K-Nearest Neighbours Classifier
As for the classification algorithm based on the K-
nearest neighbours, we can say that also works with
the four best features obtained in the study about
cork quality, above-mentioned. The distance
selected for this experimentation was the Euclidean
distance scaled with the standard deviation (showed
before). We have decided this according to the
results obtained for the Euclidean classifier.
This algorithm is part of the methods group
known as correlations analysis methods. It consists
in classifying an unknown feature vector, depending
on the sample or K samples of the training set that
is/are more similar to it, or what is the same, which
is/are nearer to this vector in terms of minimum
distance. The used distance more suitable for this
method is the Euclidean distance. This is what we
know as rule of the nearest neighbours. The
classification algorithm of the K-nearest neighbours
even can be very efficient when the classes have
overlapping, and this is very interesting for our
problem (cork quality classes).
A first brute-force approach for this algorithm
computes the distance between the unknown feature
vector and all the samples in the database (training
set), it stores all these distances, and then it classifies
the unknown vector in the class whose samples gave
more minimum distances (in this case, many
distances have to be examined). One of the
advantages of this approach is that new samples can
be added to the database at any time, but it also has a
higher calculation time.
A better approach is to examine only the K
nearest neighbours (samples) to the unknown vector,
and to classify it based on those K-neighbours. The
class of the unknown feature vector will be the one
that have most of the K-neighbours. This has been
the approach implemented in our classification
algorithm.
4.4 Euclidean Classifier
This classifier is one of the simplest and most
efficient classifiers. This classifier has also been
used to observe the tendency (goodness) of all the
features previously studied, analysing which of all
the studied features were more suitable for cork
quality discrimination.
The classification algorithm supposes several
classes with their respective prototypes (centroids).
Given an unknown feature vector to classify, the
Euclidean classifier will associate this vector to the
DIFFERENT CLASSIFIERS FOR THE PROBLEM OF EVALUATING CORK QUALITY IN AN INDUSTRIAL
SYSTEM
107
class whose prototype is closest to it, that is, the
prototype whose Euclidean distance is smallest.
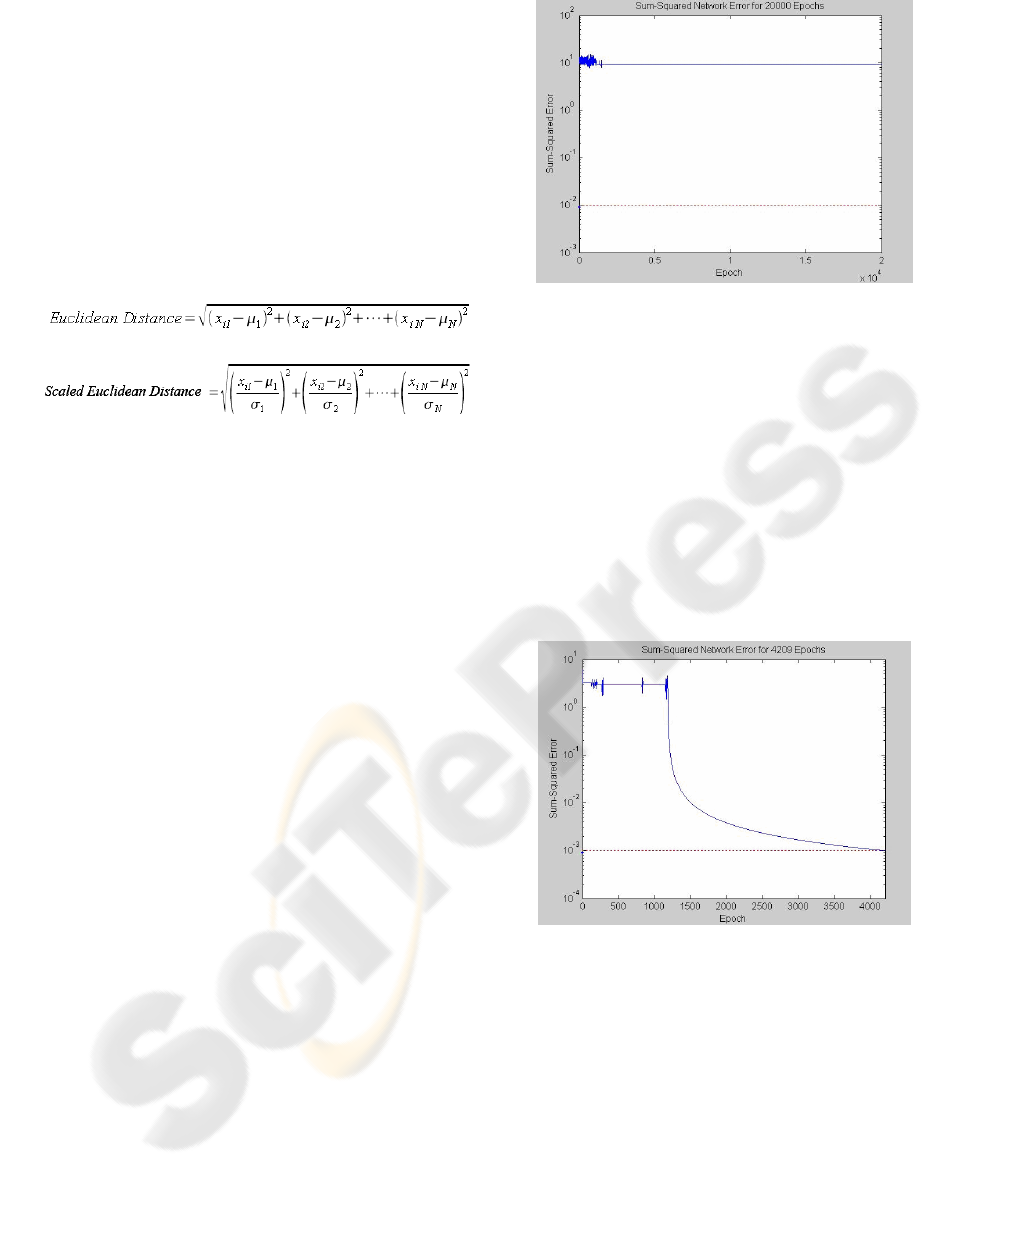
Our study have been made for four versions of
the Euclidean distance: simple Euclidean distance
(see equation below), Euclidean distance with
prefiltrate (certain corks were classified directly,
without passing the Euclidean classifier, to low-
quality classes if a hole in them was detected, that is,
we used a set of decision rules in addition to the
Euclidean classifier), scaled Euclidean distance (see
equation below) and modified scaled Euclidean
distance, according to the standard deviation (see
equation in section 4.2).
The best results were obtained by the two last
distances, but the modified scaled Euclidean
distance was chosen for being more balanced in the
results.
5 RESULTS
The results of this section have been obtained using
the 4 classification algorithms previously explained.
We present these results by means of confusion
matrices (Shapiro, 2001), due to their capability to
show the conflicts among the different quality
categories. Therefore, not only the definition of each
class will be displayed, but also the main confusions
among them.
5.1 Neural Classifier
The experimental results that are shown in this
section correspond to a simplified version of the
neural network. This decision was taken due to the
non convergence of the network, when it was tried
to learn the seven cork quality classes. Although we
normalized the input data in a range from 0 to 24,
and made a preselection of the cork disks that were
more adapted to be training patterns, the
convergence was impossible.
Figure 2: Graph showing the non convergence.
As it can be observed in figure 2, with the first
version of the neural network, it was impossible to
reach the convergence of the network, and the error
introduced in the classification was too high. The
dotted line shows the level of ideal error established
(0.01), and the solid line shows the real error in the
classification (around 10 points). The shown result
was obtained after 20000 iterations of the network.
After multiple tests with the neural network, it
was verified that, probably due to the overlapping
between contiguous classes, the network was only
able to learn two classes, for example, class 0 and
class 3.
Figure 3: Graph showing the convergence of the network.
As it is shown in figure 3, with this second
version (and even after having lowered the
maximum level of error to 0.001), the neural
network reaches the convergence quickly, in only
4209 iterations.
After this explanation, we can present the results
of the confusion matrix. Table 1 shows the
confusion matrix for the neural classifier. As it was
expected, we have obtained quite bad results due to
the class overlapping. Since the neural network only
recognizes two classes, all the corks are classified in
class 0 or class 3. Anyway, the results are coherent,
ICINCO 2006 - ROBOTICS AND AUTOMATION
108

it can be observed as classes 0 and 3 are classified
mainly in themselves. Classes 4, 5 and 6, which are
more distant from class 0, are classified mainly in
class 3. And classes 1 and 2 are those that present
more confusion between class 0 and 3 for being
between them.
Table 1: Confusion matrix for the neural classifier.
C0 C1 C2 C3 C4 C5 C6
C0 36 0 0 14 0 0 0
C1 28 0 0 22 0 0 0
C2 15 0 0 35 0 0 0
C3 12 0 0 38 0 0 0
C4 8 0 0 42 0 0 0
C5 3 0 0 47 0 0 0
C6 2 0 0 48 0 0 0
In conclusion, table 2 presents the final results,
with a wrong classification percentage of 78.85%.
Table 2: Total results for the neural classifier.
C0 C1 C2 C3 C4 C5 C6 TOT.
Wrong 14 50 50 12 50 50 50 276
Right 36 0 0 38 0 0 0 74
5.2 K-Means Classifier
Table 3 displays the confusion matrix for the K-
means classifier.
Table 3: Confusion matrix for the K-means classifier.
C0 C1 C2 C3 C4 C5 C6
C0 39 0 8 3 0 0 0
C1 25 0 15 9 0 0 1
C2 5 0 20 23 0 1 1
C3 1 0 7 24 4 3 11
C4 0 0 3 9 12 19 7
C5 0 0 0 7 17 24 2
C6 0 0 1 6 17 22 4
The confusion matrix we have obtained offers
good results, although we can observe that there is a
class that almost disappears, class 1. Nevertheless,
the other classes have many right classifications,
except class 6. In this sense, a great absorption
power of class 5 over classes 4 and 6 is observed.
The matrix presents only a little dispersion, which is
very positive for the classification.
In conclusion, the final wrong classification
percentage is 64.85% (table 4).
Table 4: Total results for the K-means classifier.
C0 C1 C2 C3 C4 C5 C6 TOT.
Wrong 11 50 30 26 38 26 46 227
Right 39 0 20 24 12 24 4 123
5.3 K-Nearest Neighbours Classifier
For the calculation of the best size of K, three
possible values have been checked. The chosen
values were the following:
- A little value, K=10.
- A big value, K=49, the number of cork
disks in a class (50) minus the disk under
study.
- A medium value, K=20.
After a preliminary test, we finally concluded
that the best size of K is K=20. Once we have
chosen the value of K, we have done our
experiments using the Euclidean distance that has
generated the best results, the scaled Euclidean
distance according to the standard deviation (see
equation in section 4.2).
Table 5 presents the confusion matrix for the K-
nearest neighbours classifier. As we can observe in
the matrix, we have obtained good results. The
matrix has a strong classification tendency around
the main diagonal for all the classes, although it
would be possible to say that still there are many
erroneous classifications in some classes.
Table 5: Confusion matrix for the K-nearest neighbours
classifier.
C0 C1 C2 C3 C4 C5 C6
C0 38 9 3 0 0 0 0
C1 24 15 11 0 0 0 0
C2 8 12 20 9 1 0 0
C3 1 8 10 16 10 2 3
C4 1 0 4 13 15 7 10
C5 0 0 2 7 12 10 19
C6 0 0 4 4 11 16 15
In conclusion, the final error rate (table 6) is
63.14%.
Table 6: Total results for K-nearest neighbours classifier.
C0 C1 C2 C3 C4 C5 C6 TOT.
Wrong 12 35 30 34 35 40 35 221
Right 38 15 20 16 15 10 15 129
DIFFERENT CLASSIFIERS FOR THE PROBLEM OF EVALUATING CORK QUALITY IN AN INDUSTRIAL
SYSTEM
109
5.4 Euclidean Classifier
The obtained confusion matrix (table 7) presents
quite positive results. Using a classifier based on
scaled Euclidean distances with the standard
deviation, we can observe that class 6 acquires a
great power of absorption, that even affects class 4.
On the other hand, we can see a strong
discrimination of classes 0, 6 and 3, with a great
number of corks classified rightly in these classes.
Table 7: Confusion matrix for the Euclidean classifier.
C0 C1 C2 C3 C4 C5 C6
C0 33 12 4 1 0 0 0
C1 19 14 13 3 1 0 0
C2 6 9 15 18 2 0 0
C3 1 4 7 23 11 0 4
C4 2 0 1 10 13 3 21
C5 0 0 1 12 7 6 24
C6 1 0 1 7 7 3 31
The total results are shown in table 8, with a
final wrong classification percentage of 61.42%.
Table 8: Total results for the Euclidean classifier.
C0 C1 C2 C3 C4 C5 C6 TOT.
Wrong 17 36 35 27 37 44 19 215
Right 33 14 15 23 13 6 31 135
6 CONCLUSIONS AND FUTURE
WORK
The automatic visual inspection of cork is a problem
of great complexity, in what refers to its quality-
based classification, because cork is a natural
material, and therefore, highly heterogeneous. This
heterogeneity causes that cork quality depends on
many combined factors, and among them, cork
texture, defect area, size of the biggest defect,...
In this paper we have performed a deep survey
about several classifiers that includes each of these
features (the best features we have found in a
previous research). Concretely, we have focused on
four important classifiers in the image processing
field.
According to the experimental results we can say
that, in case of cork, there are more suitable
classifiers than others, although some of the studied
classifiers have been very near in their final results.
As final conclusion, we can say that the Euclidean
classifier has been the more reliable in our
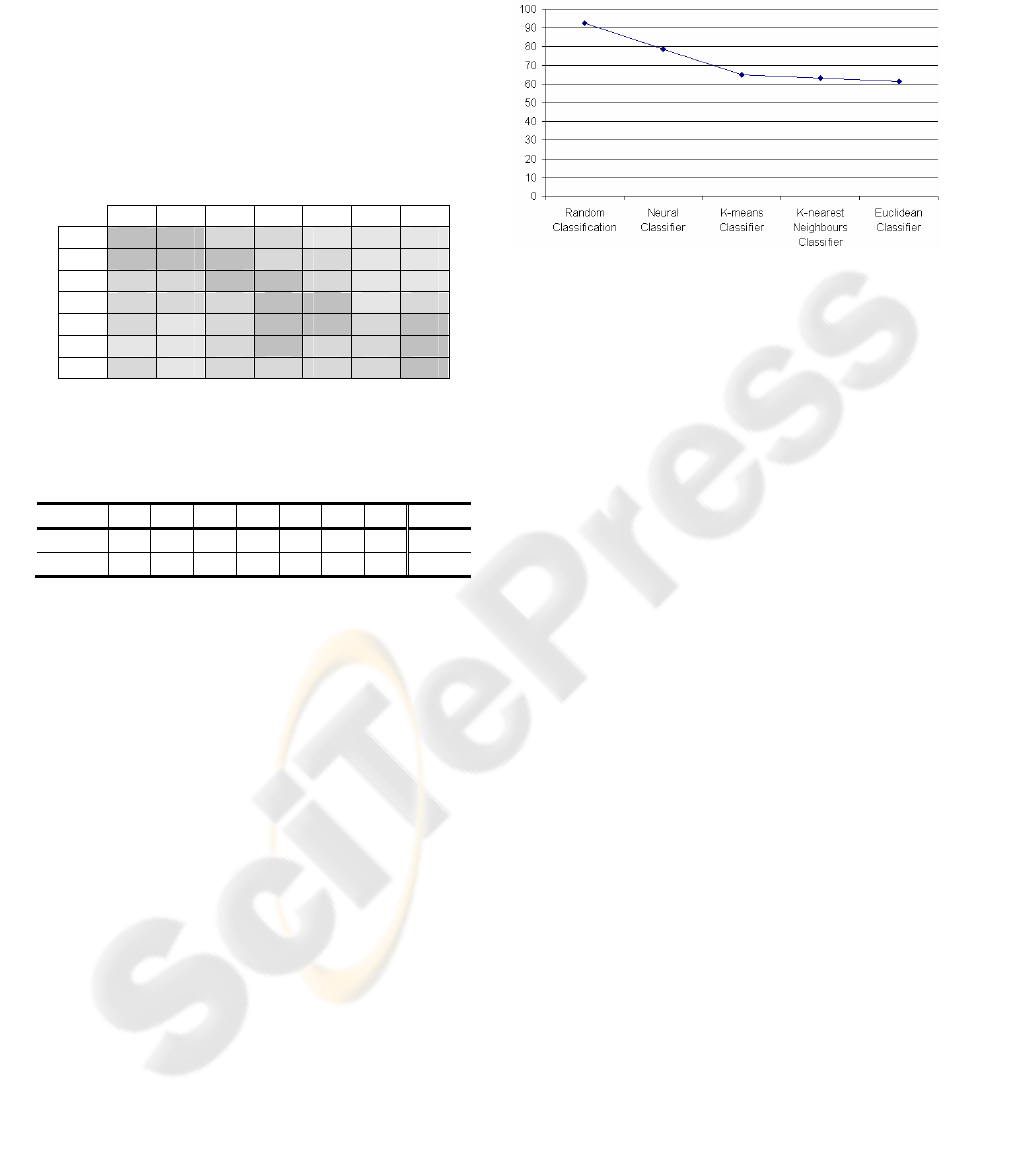
application field. Figure 4 presents the wrong
classification percentage obtained by the different
classifiers. This graph also includes the wrong
classification percentage that a random classification
would have obtained if it was used.
Figure 4: Final results for the studied classifiers.
As we can observe in the previous graph, the
Euclidean classifier has produced the best results,
but it is worthy to say that all the studied
classification algorithms improve the results
obtained by a random classification, although the
goodness of the obtained results widely varies
between some classifiers and others.
Furthermore, we think the results and
conclusions obtained in this study can be useful to
other visual inspection researches focused on other
natural materials (wood, slate, etcetera), because
they have common characteristics with the cork
(heterogeneity, defects, changing texture according
to their quality,...).
As future work we have planned to study other
classifiers like, for example, fuzzy-neural networks.
Also, we do not discard the inclusion and analysis of
other features that could improve the classification
results.
ACKNOWLEDGEMENTS
This work has been supported in part by the Spanish
Government under Grant TIN2005-08818-C04-03.
REFERENCES
CorkQC, The Natural Cork Quality Council, 2006.
Industry Statistics. At
http://www.corkqc.com.
Fortes, M.A., 1993. Cork and Corks. In European Rev.,
vol. 1, pp 189-195.
Haralick, R.M., Shanmugam, K., Dinstein, I., 1973.
Textural Features for Image Classification. In IEEE
Transactions on Man and Cybernetics, vol. 3, pp 610-
621.
ICINCO 2006 - ROBOTICS AND AUTOMATION
110

ICMC, Instituto del Corcho, Madera y Carbón Vegetal,
2006. Instituto de Promoción del Corcho (ICMC-
IPROCOR). At http://www.iprocor.org, Spain.
Sahoo, P.K., Soltani, S., Wong, A.K.C., 1988. A Survey of
Thresholding Techniques. In Computer Vision,
Graphics, and Image Processing, vol. 41, pp 233-260.
Shah, S.K., Gandhi, V., 2004. Image Classification Based
on Textural Features Using Artificial Neural Network
(ANN). In IE(I) Journal-ET, vol. 84, pp 72-77.
Shapiro, L.G., Stockman, G.C., 2001. Computer Vision,
Ed. Prentice Hall, New Jersey.
Sonka, M., Hlavac, V., Boyle, R., 1998. Image
Processing, Analysis and Machine Vision, Ed. PWS
Publishing, USA, 2
nd
edition.
DIFFERENT CLASSIFIERS FOR THE PROBLEM OF EVALUATING CORK QUALITY IN AN INDUSTRIAL
SYSTEM
111
