
SONAR BUOYS: AN IMPROVED DESIGN APPROACH
K. Balasubramanian
Department of Computer Engineering,Faculty of Architecture and Engineering
European University of Lefke, Turkish Republic of Northern Cyprus
Mersin 10, Turkey
Keywords: Buoy, marine exploration, replica correlation, underwater surveillance, microprocessor control.
Abstract: Design approach for improved system performance of a microprocessor controlled sonar buoy performing
surveillance of underwater objects is proposed. When launched into sea or ocean the microprocessor
controlled buoy sets into action for automatic scanning of the underwater as to extract the object
information and transmit the same by wireless to a remote ground station for further processing and taking
final control action. System design outline for sonar buoy incorporating 11-cell replica correlation resulting
in improved system performance is presented in this paper. Although the complexity of the hardware
replica correlator is minimized using the recent digital delay lines the proposed microprocessor controlled
buoy performs replica correlation through software and extracts object information conceding improved
system performance.
1 INTRODUCTION
In several underwater exploring systems sonor
buoys are kept on the surface of the ocean on
permanent basis as to detect the underwater objects
and present the information continuously for longer
time. Major types of noise affecting the performance
of such sonar systems, under these environment
conditions, are the impulse noise and colored noise
which could affect detection process and create false
alarms. Attempts have been made by the researchers
to get rid of the effect of impulse noises as to reduce
the false alarm probability and to enhance the
probability of detection. A signal processing
technique dominant in this area is replica correlation
(N.Sarkar, 1999, Elements of Digital signal
processing, Khanna Publishers, New Delhi. Taub
and Schilling, 1990, Balasubramanian et
al,1993,1999 and 2000) which would boost the SNR
to a high level for enabling easy detection. Replica
correlation technique involves in using binary phase
shift keyed signal (BPSK) commanded by a packet
of ‘n’ cells incorporated in the duration of the
ongoing pulse. The received signal is appropriately
delayed and summed up in an array of adders with
weighted signs assigned in the reverse pattern as to
achieve signal boosting. In the past, in certain mini
type sonar systems a 7-cell hardware replica
correlator having analog delay lines were employed
to have a reasonable system performance. The use of
acoustic delay lines in any system makes it bulky
and heavy. (M.I.Skolnik,2000). The performance
was enhanced further by using 9-cell corrlators with
the installation of digital delay lines. The recent
digital delay lines are promising to be useful for
such purposes( Balasubramanian et al 1994 and
1999). As the cell word size for replica correlation
increases, it increases the SNR but also increases the
complexity of the delay line structure contributing to
its physical size. Alternatively, the replica
correlation could be performed by software
techniques where the usage of delay lines is avoided.
In such cases, the increase in the word size for cell
pattern calls for the use of high speed processor and
large memory. The portable type of sonar used in
mini-vessels and buoys demand the system hardware
to be minimized as to achieve compactness and low
weight for the unit.
2 SONAR BUOY SYSTEM
OUTLINE
The essential constituents of the proposed sonar
buoy are, 1. Acoustic transmitters and receivers with
piezo electric transducers (PZTs), 2. Stepper motor
and its drive circuit, 3. Continuous Wave (CW) AM
modulator and transmitter and 4. Microprocessor
161
Balasubramanian K. (2006).
SONAR BUOYS: AN IMPROVED DESIGN APPROACH.
In Proceedings of the Third International Conference on Informatics in Control, Automation and Robotics, pages 161-167
DOI: 10.5220/0001201201610167
Copyright
c
SciTePress
based control unit which governs all units of the
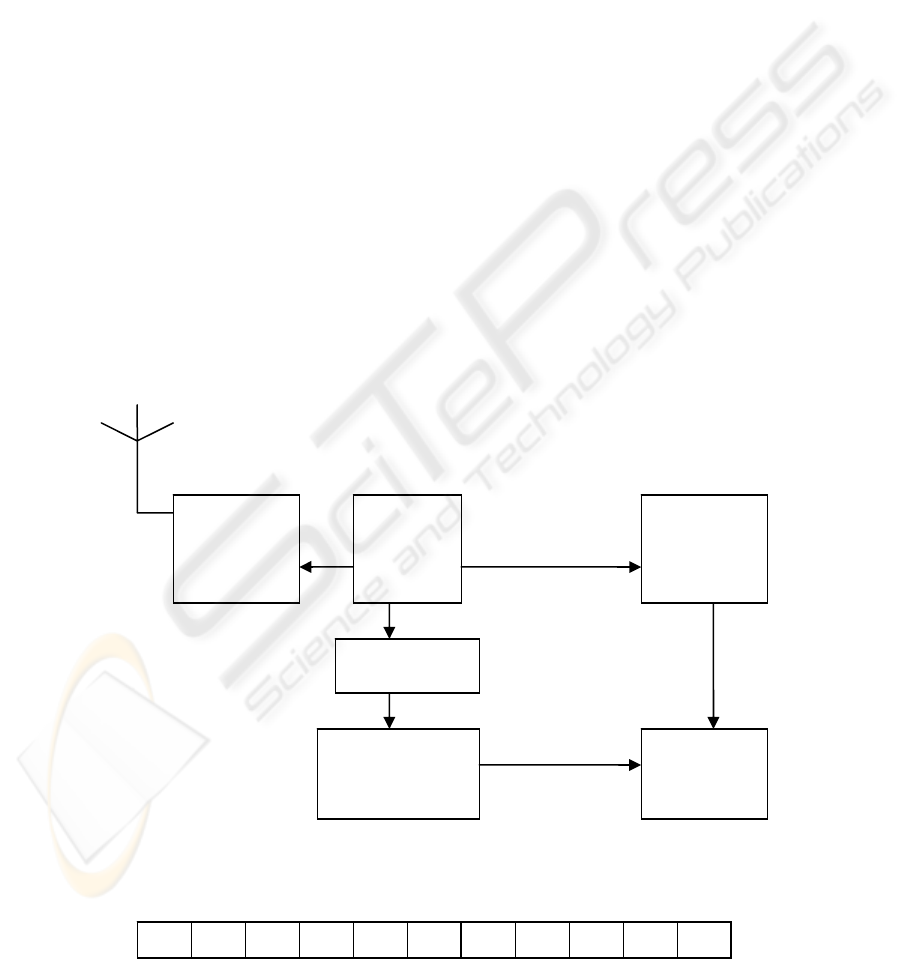
buoy. Fig.1 shows the simplified block schematic.
When the buoy is thrown into the sea for marine
exploration certain parts of the buoy such as the
antenna of the mini AM transmitter are staying
above the water surface so as to keep it ready for
transmission. The acoustic PZT crystals with
holders are set inside the water ready for performing
the propagation of the acoustic waves. When
launched into the sea, after the predetermined time
set in the buoy with a monostable multivibrator the
microprocessor sets the stepper to rotate
continuously. At the same time in each step of its
rotation acoustic packet of pulses are transmitted and
reflected echo is received in conventional manner.
As the time elapsed between the transmitted pulse
and the received echo concedes the range
information relating to the current azimuth angle this
is accumulated in memory of the microprocessor
unit. After storage this information is converted into
analog form and driven to the AM transmitter for
broadcasting to the ground station. The remote
ground station at the seashore in turn receives the
information and performs further processing as to
extract useful information needed for subsequent
decision making purposes.
3 REPLICA CORRELATION
DETECTION
Replica correlation technique improves the
probability of detection and the false alarm
probability. As explained before, each acoustic
pulse being transmitted is contributed by a packet of
‘n’ cells. In the proposed project ‘n’ is optimally
chosen as 11. The pattern of cells is evaluated as a
bit stream shown in Fig. 2 where + indicates in-
phase and – indicates the out-phase of the CW sine
wave.
The Continuous Wave signal being transmitted is
binary phase shift keyed according to the cell pattern
and acoustically transmitted in the under water for
regional. The acoustic echo returned from the
objects also posses the same phase reversals and by
replica correlation operation we identify and boost
these echo in presence of noise. Noise being random
in nature it does not undergo these pattern of phase
reversals and does not get boosted up. The nature of
the CW signal which is BPSK keyed and transmitted
according to cell pattern is shown in Fig.3
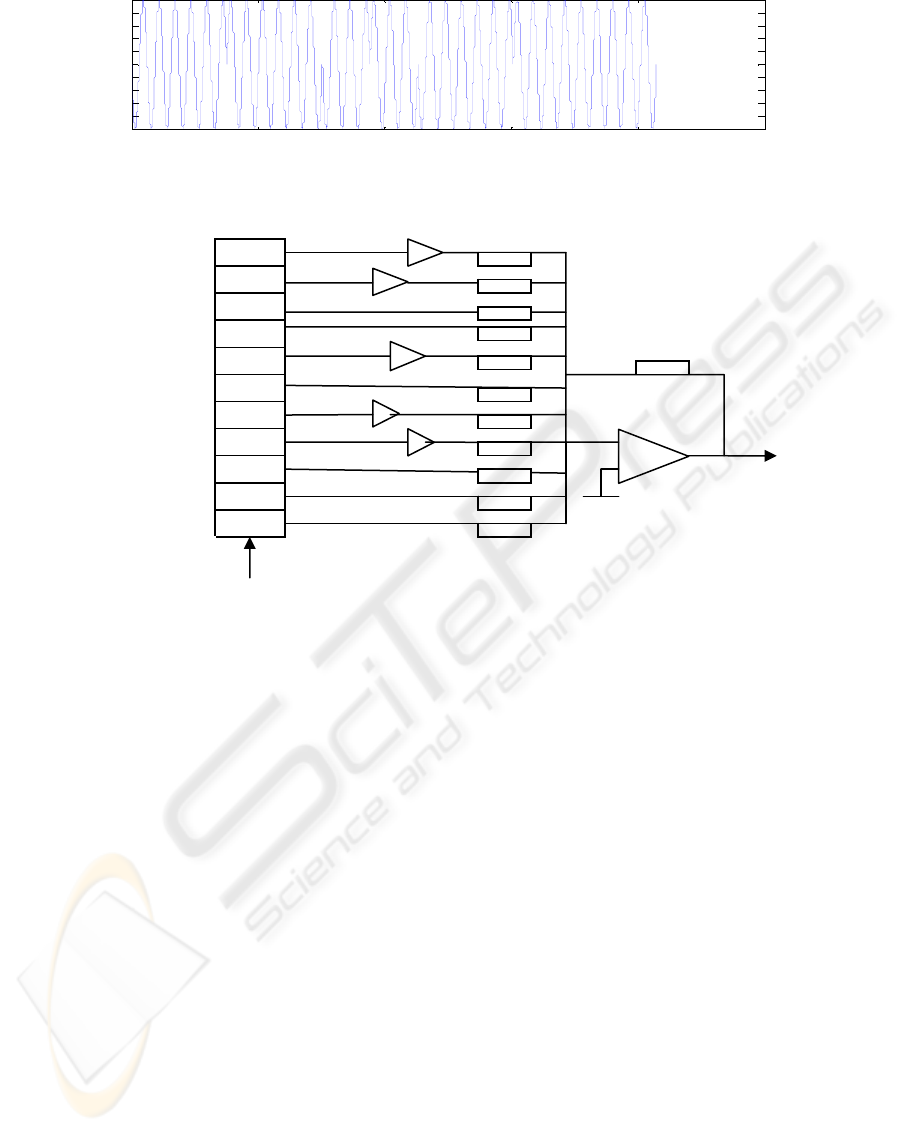
Replica correlation could be performed by hardware
and also by software. The schematic of the hardware
replica correlator is shown in Fig.4.
Figure 1: Simplified Block Schematic of the Buoy.
Figure 2: 11-Cell pattern.
MPU
CW AM
Modulator
&
Transmitter
Drive
Acoustic
Transmitter &
Receiver
Stepper
Drive
&
Motor
PZT
- - + + - + - - + + +
ICINCO 2006 - SIGNAL PROCESSING, SYSTEMS MODELING AND CONTROL
162
0 50 100 150 200 250
-1
-0.8
-0.6
-0.4
-0.2
0
0.2
0.4
0.6
0.8
1
Figure 3: CW signal in one packet of acoustic pulse.
Figure 4: Replica Correlator Circuit.
The echo BPSK signal enters into the digital
delay line and propagates up to the end. The recent
digital delay line [8,9] comprises pipe lined 8-bit
shift registers terminated with its front end by an
ADC (Analog to Digital Converter) which converts
the incoming BPSK into a stream of digital bytes.
The ADC used is 8-bit flash ADC constructed using
advanced architecture (Balasubramanian, 2003). The
bytes entering at the front end shift register
progresses to the end with the clock applied to delay
line. In order to get the delayed analog output at
different taps, DACs (Digital to Analog Converters)
are fixed at the Shift registers at regular intervals. At
some taps of the delay line analog inverters are
connected depending upon the inverse sequence of
the cell pattern. The delayed signals after due
inversion are summed up to obtain the replica
correlated output. The received BPSK echo
propagates through the delay line, and when its first
cell reaches the last tap there occurs a significant
boost in the signal level making an amplification to a
factor of 11 corresponding to the cell number.
The signal boosting process is evaluated as
follows. If x
i
denotes the bi-phase value of the
received signal falling in i
th
cell and pj
denotes the
polarity of the amplifier attached to the j
th
tap of the
delay line the output realized at the summing
amplifier at various cells during the propagation of
the signal in the delay line is expressed in (1)
wherein K
i
denotes the amplitude of the summing
amplifier at the i
th
cell of the arriving incoming
signal. For the 11-cell replica correlator K
11
would
have a magnitude 11 and all other K
i
would be
limited to a maximum of 3.
i
K
i
= Σ p
q
x
(i+1-q)
(1)
q=1
When the BPSK has propagated to 11
th
cell the
signal amplitudes in all cells in the order is given in
(2)
K
i
= { -1 -2 -1 +2 +3 0 -3 0 -3 0 +11} (2)
When only noise is entering the delay line there
would be additions and cancellations randomly
causing low output at the summing amplifier. At the
output of the replica correlator there is a threshold
voltage comparator which detects easily the
presence of the echo. Fig.5 shows the replica
correlated output for an echo BPSK signal.
Inverting amplifier
S
t
ack of
tapped
I
digital
delay line
Summing
Amplifier
Resistors - all are of same value
Incoming
BPSK echo
si
g
nal
SONAR BUOYS: AN IMPROVED DESIGN APPROACH
163
0 50 100 150 200 250
-15
-10
-5
0
5
10
15
Figure 5: Replica correlated output.
Table 1: Best designed cell pattern.
No.of
cells
Pattern Unwanted
Max
signal
Cell signal output
7 - + - - + + + 1u -1 0 -1 0 -1 0 +7
9 - + - + - - + + + 2u -1 0 -1 +2 -1 -2 +1 -2 +9
11 - - + + - + - - + + + 3u -1 -2 -1 +2 +3 0 -3 0 -3 0
+11
13 - - - + + + - + - - + + + 4u -1 -2 -3 0 +3 +4 +1 -2 -3 -4 -1 +2
+13
15 - - - + + + + - - + - - + + + 5u -1 -2 -3 0 +3 +4 +3 -1 -1 -4 -5 -2 -3 +4
+15
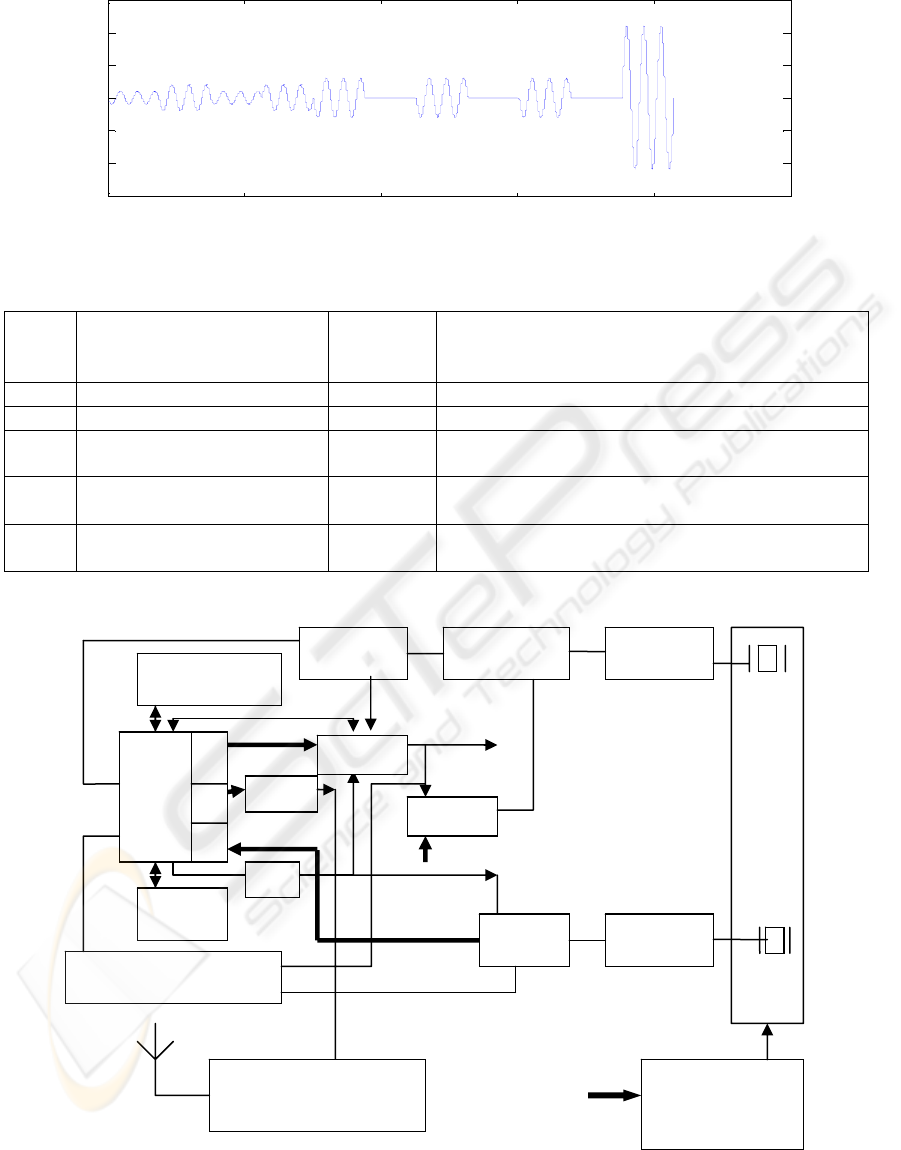
Figure 6: Schematic of the sonar with microprocessor implementation.
MPU
Keyboard
Dis
p
la
y
RAM
PROM
Interrupt Interface
Oscillator
PISO
Controlled
Inverte
r
Transmitter
Amp ADC
EOC
SC
IO ports
%
DAC
AM Modulator &
Transmitter
Stepper Drive
&
Motor
From
MPU
Output
Port
Timer
ICINCO 2006 - SIGNAL PROCESSING, SYSTEMS MODELING AND CONTROL
164
3.1 Algorithm for Cell Pattern
Design
The SNR materialized in a sonar system improves
with the number of cells used in the packet of bit
stream. Therefore, alternative to 11 cell pattern one
would attempt to include 13 cells or 15 cells as to
improve the SNR. For this consideration optimum
cell pattern has to be chosen for best performance
conceding lowest correlated output during all cell
periods except the last one which gives n-times the
amplitude in voltage level. The optimum cell
patterns evaluated for various cell word lengths are
given in Table 1. The best 7 cell pattern being
conventionally used - + - - + + + would occur as
last 7 cells of any higher order word length. The
algorithm determines the first few ‘m’ cells as
follows. The number ‘m’ is divided by 2 and
actions are taken according to the value. If it is
unity it assigns the first two cells to be – and + such
that the 9-cell word length would be - + - + - - + + +.
It always starts with the ‘ –‘ whatever may be
preceding cells ‘m’. If m/2 is 2, two cells are
given for – and another two for + to have preceding
cell pattern as (--++). This trend continues with
m/2 equal to 3 where first three cells are fixed with –
and the next three with +. When m/2 is more than 3,
we limit the successive identical cells to 3. For
example if m is 8, first three are -, next three are +
and the final two cells would be + -. Therefore, by
applying this program one could find the optimum
cell pattern for any number of cell word length.
4 SONAR BUOY SYSTEM
IMPLEMENTATION
The block schematic of the sonar with
microprocessor implementation is shown in Fig.6.
As outlined in Fig.1 the microprocessor controls all
operations such as controlling the PZTs for rotating,
performing replica correlation by software, detecting
the targets and arranging a coordinate system taken
to memory and driving the AM wireless unit for
radio transmission. A sine wave oscillator is
responsible to produce the acoustic CW wave. This
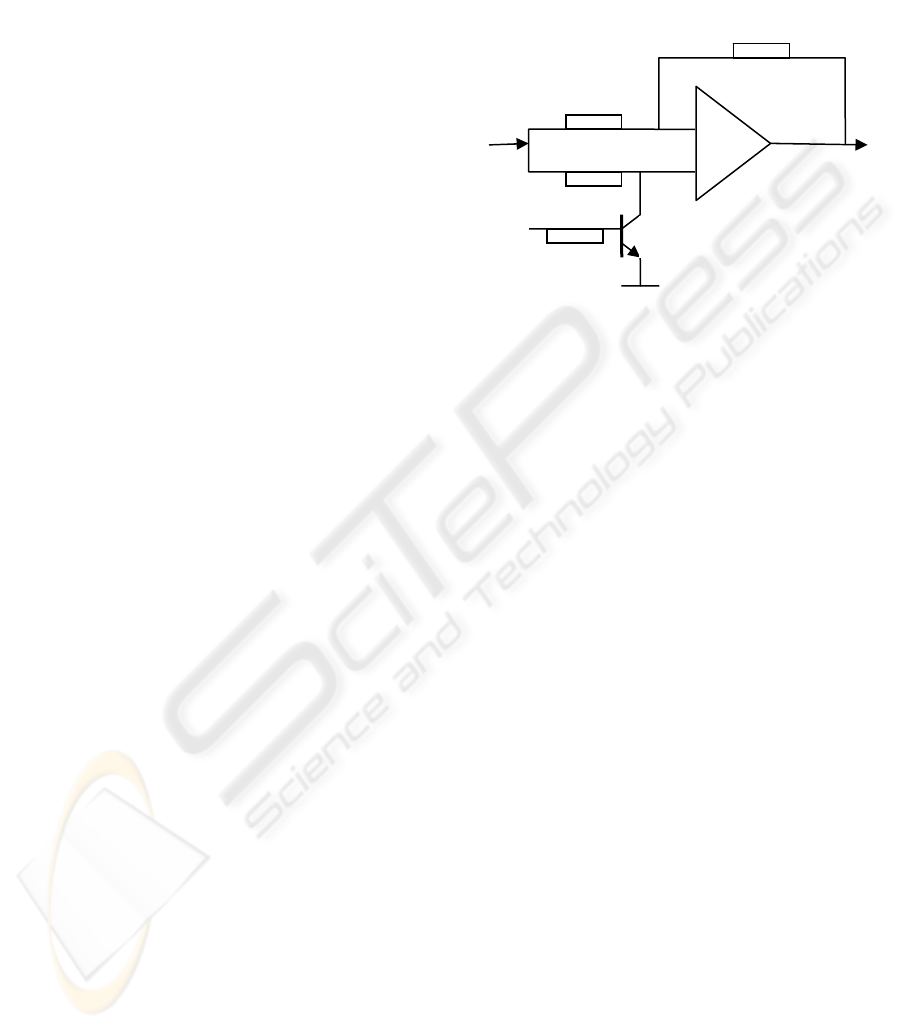
signal is BPSK keyed by a controlled inverter
(shown in Fig.7)working in accordance with the
polarity of the bit stream stored in PISO (parallel In
Serial Out) register. The sine wave input ‘vi’ is
inverted at the output ‘vo’ depending upon the
polarity of the control bit vc. When vc is ‘high’ the
transistor comes into saturation causing virtual earth
to exist at the non inverting input terminal of the op-
amp resulting in analog inversion. On the other hand
when vc is ‘low’ the transistor would be in cut off
working as a buffer for vi to reach vo.
Figure 7: Controlled inverter circuit.
A Timer is initiated by the microprocessor to
generate periodic input to load the bits stream of cell
pattern to PISO at the rate PRF (Pulse repetition
Frequency) of the acoustic wave. As known, PRT
the Pulse Repetition Time of the periodic pulses
used for the acoustic transmission depends on the
maximum desirable range Rmax set for marine
exploration.
PRT = 1/ PRF = ( 2* Rmax/c ) (3)
where c is the velocity of propagation of the
acoustic waves in underwater.
The timer generates this periodic waveform as a
function of timer-in derived from the source of sine
wave form the oscillator. The received echo signal
from the target is amplified and digitized with 8-bit
ADC and read to the microprocessor. The clock
from the microprocessor is suitably divided in
frequency and given as the timer-input and this also
serves as the Start Conversion (SC) input for the
ADC. The ADC when it completes its conversion
interrupts (Interrupt-1) the microprocessor to read
the sample to it and put it into the RAM memory
organized as FIFO. This FIFO memory substitutes
the use of delay line. At each time of inputting a
byte to the FIFO, it is first updated and then
computation for the replica correlated output is
made. This process takes the data from the definite
memory locations at equal address spacing that
represents the taps in the delay line, assigns polarity
weights and sums them up. The first data is taken at
vi
47K
47K
100
K
47K
vc
T1
vo
Q1
SONAR BUOYS: AN IMPROVED DESIGN APPROACH
165
the location 30 of FIFO and the last tap is at 330.
The replica correlated output is represented by
11
Eo = ∑ pi *M
30*i
(4)
i= 1
where pi is the polarity assigned to various taps.
Fig.8 shows its simple schematic.
The current data is compared with a threshold to
know whether target is present or not. The timer
which initiates the PISO also interrupts (Interrupt-2)
the microprocessor to initialize a range counter
organized in a register. The range counter is
incremented each time by the software by the
incoming sample with Interrupt-1 and it will
terminate at the instant the replica correlated output
crosses the threshold. The range data is loaded in the
vectored array memory for creating coordinate
display further. At each angular position of the PZT
a vector is initialized to record target in that
direction. While the regional coordinate information
being gathered and dumped in memory it is also sent
to the output port where it is converted into analog
form and driven the AM modulator and transmitter.
Figure 8: Flow of data stream for replica correlation.
As continuous scanning is required for
surveillance, the stepper drive data is derived from a
ring counter activated by the MPU and provided to
the stepper motor for performing the scanning
process without any interruption.
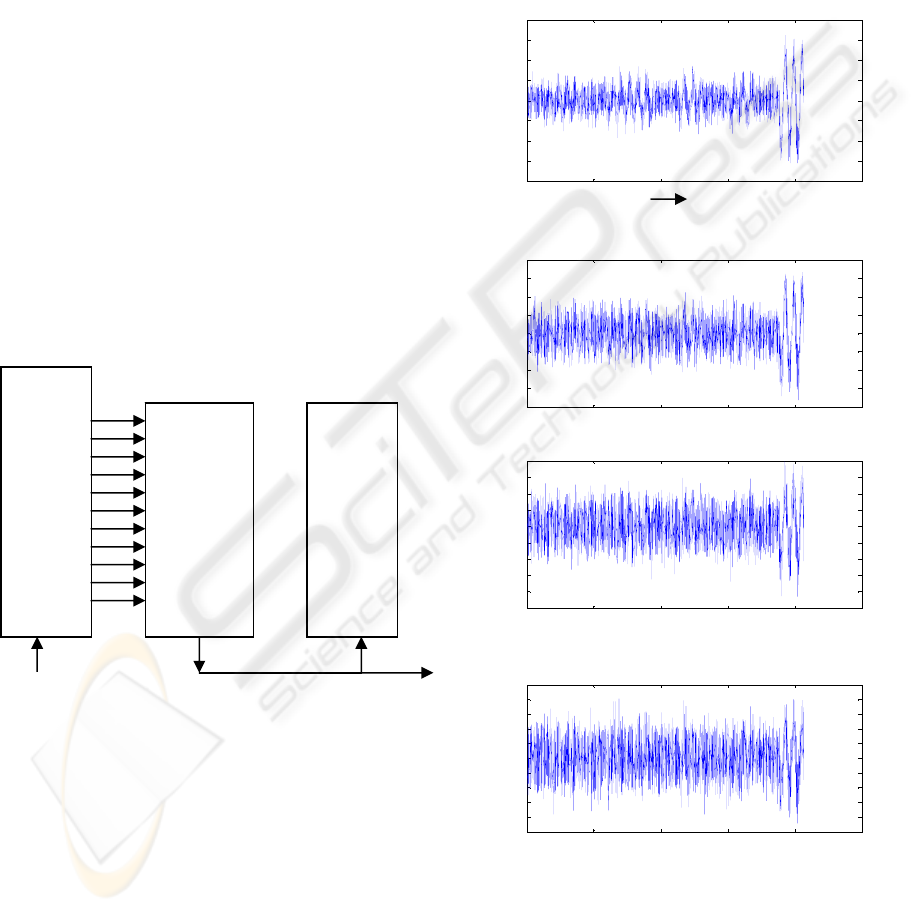
4.1 Simulated Experiment for Noise
Study
The replica correlated output is generated by
simulated 11-cell signal with noises added at
different amplitudes. Fig.9 shows the output with
random noises added in voltage level by 200% to
500%. This shows that even if noise is around 400%
amplitude of the signal the target could be detected
without any difficulty.
0 50 100 150 200 250
-20
-15
-10
-5
0
5
10
15
20
(a)
0 50 100 150 200 250
-20
-15
-10
-5
0
5
10
15
20
(b)
0 50 100 150 200 250
-25
-20
-15
-10
-5
0
5
10
15
20
(c)
0 50 100 150 200 250
-25
-20
-15
-10
-5
0
5
10
15
20
25
(d)
Figure 9: Replica correlated output ; Amplitude vs time
for one packet duration. a. 200% noise b.300% c.400%
d.500%.
FIFO
Mem
M(330)
M(300)
M(270)
M(240)
M(210)
M(180)
M(150)
M(120)
M(90)
M(60)
M(30)
Replica
Correlation
Software
FIFO
Replica correlated
output
Sam
p
le strea
m
Time
ICINCO 2006 - SIGNAL PROCESSING, SYSTEMS MODELING AND CONTROL
166

5 CONCLUSION
The proposed project envisages in exploring the
marine region to identify the objects and
communicate to the coastal station. This is normally
meant for the temporal investigation requirements
such as to identify the infiltration of foreign
elements in the regional territory or the bulk
availability of sea animals like sharks and whales.
Based on this information decision could be made
by the ground station to proceed further with the
objects determined. Replica correlation activity is
reinforced with the optimal 11-cell pattern so as to
improve the probability of detection and reduce the
false alarm probability. It is to be noted that when
the number of cells in a packet is increased more
than 11, it improves the SNR and also increases the
complexity. For enhanced number of cells the
proposed algorithm determines the optimal cell
pattern for reaching maximised SNR. One could
effectively use this algorithm for larger number of
cells used in the packet. When replica correlation is
performed by hardware the complexity increase is a
dominant factor and it is minimized by using recent
digital delay lines. It is further minimized in the
proposed sonar buoy where the microprocessor
performs the replica correlation by software.
ACKNOWLEDGEMENTS
The author acknowledges with thanks all necessary
support extended by the Department of Computer
Science and Engineering for carrying out this
project. He also thanks the Faculty of Architecture
and Engineering and the Rector of European
University of Lefke for providing the funding
support for the project without which it would not
have come to its completion.
REFERENCES
N.Sarkar, 1999, Elements of Digital signal processing,
Khanna Publishers, New Delhi.
Taub and Schilling, 1990, Principles of Communication
systems, Tata McGraw Hill, New Delhi.
K.Balasubramanian and S.Arica, 1993, "On the synthesis
of a nine-point replica correlator for a sonar",
Proceedings of the International Symposium on
Signals Circuits and Systems, Iasi, Romania, pp 148-
151.
K.Balasubramanian, H.Camur and Rajaravivarma, 1999,
“Replica Correlation Technique for Improving the
SNR of Digitally Transmitted signals”, Abstracts of
the 1999 IEEE SoutheastCON Conference, Lexinton,
Kentucky, USA.
K.Balasubramanian, 2000, “Replica correlation detection”,
Electronics World, Vol 106, No 1767, March2000,
pp 238-240.
M.I.Skolnik, 2000, Introduction to Radar Systems,
McGraw Hill, New York.
K.Balasubramanian and C.Cihan, 1994, "An intelligent
digital delay line for replica correlation",
Proceedings of the International Conference on
Robotics, Vision and Parallel Processing for Industrial
Automation, IPOH, Malaysia, pp 191-197.
K.Balasubramanian, K.B.Gayathri and H.Camur,1999,
“Voltage Control for a Digital Delay Line”,
Electronics World, Vol 105, No 1762, pp 826.
K.Balasubramanian, K.B.Gayathri and H.Camur ,
1999,“Delay-length-locked loop”, Electronics World,
Vol 105, No 1763, pp 910-911.
K.Balasubramanian, 2003, “On the design and
development of high performance ADCs”, Journal of
AMSE-Modelling Measurement and Control, A-
series, France, Vol 76, No. 3, pp 35-48.
SONAR BUOYS: AN IMPROVED DESIGN APPROACH
167
