
A Honeypot Implementation as Part of the Brazilian
Distributed Honeypots Project and Statistical Analysis of
Attacks Against a University’s Network
Claudia J. Barenco Abbas, Alessandra Lafetá, Giuliano Arruda
Universidade de Brasília – UnB – Laboratório de Redes de Comunicação – Campus
Universitário Darcy Ribeiro – FT CEP 70910-900 – Brasília/DF – Brazil
Luis Javier Garcia Villalba
Universidad Complutense de Madrid – Departamento de sistemas informáticos y programacíon
– Faculdad de informática
Facultad de Informática, Despacho 431 –
C/ Profesor José García Santesmases s/n
Ciudad Universitária – 28040 - Madrid – Spain
Abstract. This paper intends to describe the deployment of a honeypot at
University of Brasília (UnB), by configuring an unique machine as part of the
Distributed Honeypots Project from the Brazilian Honeypots Alliance. This
work initially presents all the tools needed to implement the honeypot
environment, as well as the implementation itself. Afterwards, the collected
data about the attacks and their analysis are presented. Finally, final statements
are made and future works are suggested.
1 Introduction
Security is becoming an essential part of Information Technology, due to the
increasing number of attacks, which threatens institutions and their assets.
Consequently, these organizations invest in new tools developed by universities and
research centers, especially directed to defend their interests by defeating hackers.
Among the resulting technologies, we can find the honeypots, main subject of this
work.
Basically, honeypots are lures, security reso
urces, vulnerable by nature, designed
to track the steps taken by hackers when they intend to attack a system. In a higher
level, they can be connected to create a whole network, as has been made by the
leaders in network security development, who founded the Honeynet Project [1]. In
order to coordinate the researches around the world, theyhave set up the Honeynet
Research Alliance, which takes in projects from many countries as part of the group,
including Brazil.
With the objective of increasing the capacity of incident detection, event
correlation and trend analysis in the Brazilian Internet space [2], the Honeynet.BR
J. Barenco Abbas C., Lafet
´
a A., Arruda G. and Javier Garcia Villalba L. (2005).
A Honeypot Implementation as Part of the Brazilian Distributed Honeypots Project and Statistical Analysis of Attacks Against a University’s Network.
In Proceedings of the 3rd International Workshop on Security in Information Systems, pages 84-93
Copyright
c
SciTePress

Project [3] (Brazilian member of Honeynet Research Alliance) team has created the
Brazilian Honeypots Alliance, which deploys a network of distributed honeypots,
with the intention of analysing the traffic in Brazil, considered to be the biggest
source of attacks. The Distributed Honeypots Project is coordinated by NIC BR
Security Office (NBSO), the Brazilian CERT, and by a research center called
CenPRA (Renato Archer Research Center).
To achieve its goals, the Project’s coordination is working to cover most of the
Brazilian IP address space by setting up honeypots in a great number of Brazilian
institutions, which contributes to the honeypots’ maintenance with the allocation of
resources and staff [4]. In order to make the deployment easier and to help with the
procedures of updating, data collecting and management of several honeypots, these
institutions must follow a configuration standard.
The collected data, besides being used locally for analysis of attacks against each
institution, are also unloaded for a central server, where they are sanitized and stored
in a database. A summary of the data of each institution is published daily, allowing
all to follow the current activities in the honeypots of the distributed network. The
Distributed Honeypots Project also works to build a central data analysis’ system to
facilitate the study of attack trends and correlations, and to operate jointly with
Computer Security Incident Response Teams (CSIRTs) with the purpose of
disseminating the information acquired [3].
In this paper, we initially intend to show how we have implemented a honeypot at
UnB following the procedures to become a member of the Brazilian Honeypots
Alliance. Then, we present a statistical analysis of the activities observed in our
honeypot during a one-week period. This analysis has allowed us to identify some of
the risks the university’s network may be undergoing.
2 The Honeypot Environment
For the future members, the Distributed Honeypots Project’s coordination offers a
personalized version of HOACD, which contains all the tools needed to implement
the honeypot, as well as all the needed configuration files, already in accordance with
the Project’s standard. HOACD was developed by the Honeynet.BR Project team as a
basic tool for implementing a low-interaction honeypot that runs directly from a CD,
and stores its logs and configuration files on the machine’s hard disk. A public
version is available at their site [3].
HOACD uses the OpenBSD operating system, the low-interaction honeypot
Honeyd and the user-space ARP daemon Arpd – HOACD means Honeyd, OpenBSD
and Arpd in a CD.
2.1 Configuration of the Environment
UnB was invited by the Distributed Honeypots Project to join the Brazilian
Honeypots Alliance. Therefore, a contact was established with CenPRA and NBSO in
order to point the requisites needed to join the association. The requirements are:
− A machine with at least a 150 MHz processor, 64 MB RAM memory, IDE or SCSI
hard disk with 512 MB capacity, NIC and CD-ROM drive;
85

− A CIDR IP range with at least 16 addresses with unrestricted access at the
institution firewall.
− Definition of the participants of the Project’s discussion list. All must have a PGP
key to read summaries.
The next step was to set aside a machine with the following configuration:
− AMD Athlon XP 1900+ 1.6 GHz;
− 256 MB RAM memory;
− IDE hard disk with 40 GB;
− VIA VT86c100A Rhine-II PCI NIC;
− LG 52x CD-ROM drive.
Considering the access control to the hardware, it was defined that the machine
would be installed in a UnB laboratory so that it would be under vigilance most of the
time. The IP range was reserved, separated in a VLAN to avoid the excessive
broadcast packages. One of the IP addresses would be used as the machine’s real IP
and the others would be configured as virtual honeypots. It was observed that the IP
range wasn’t being filtered by the laboratory’s firewall.
For the institution to become part of the Alliance, it was necessary to define a
designation to the honeypot, identifying it at the summaries sent to the discussion list.
As the possibility of another honeypots to be installed in the same institution exists,
this identification couldn’t be too much generic.
With all the data and requisites in hand, a hyperlink to an ISO image from
HOACD was given by the Distributed Honeypots Project’s coordination. This file is
personalized to each organization, differently from the one on the Internet [3], which
is a public version for tests. Later, the installation of HOACD was done. All the steps
described in the installation instructions were followed, including the suggested sizes
for the hard disk partitions.
As the installation was concluded, the Honeyd configuration file was changed in
order to have a more personalized and diversified environment. This configuration
will be presented in the next section.
After the honeypot configuration was finished, tests and remote checks (from
NBSO) could be done. The daily rotation of logs could be checked after some days –
HOACD is configured to rotate the system’s logs every day, generating new log files
and compressing the old ones, so as to facilitate the process of collecting and to save
space in the hard disk. Thereafter, the honeypot was subscribed at the central server
and the remote monitoring and periodic remote status check were started.
We observed that there was another filter at the university network, which wasn’t
letting packages destined to some ports to pass. Hence, the total deliverance from
external traffic was made available. Even with these changes, there was still a filter
located at the National Research Network (RNP) backbone, of which UnB is part.
While the RNP’s filter wasn’t released, it was decided to collect and analyse the
data available, even if it did not represent the whole universe of attack sources. From
the data we had, the majority of the source addresses were from UnB and just a little
bit from the rest of Brazil, what is explained by the existence of the RNP’s filter. For
that reason, it was decided that only logs from foreign activities would be used as the
database for analysis.
When the filters were all set, the daily data collecting service and summary
generation were set up within the Alliance, as well as the subscription of a responsible
person for this honeypot in the discussion list. From this moment, the institution was
86

definitely considered as an Alliance’s member and started to receive the several
honeypots summaries.
2.2 Honeyd Configuration File
Because of the low risk offered to the institutions’ networks, less surveilance needs,
and higher maintenance and configuration facilities, the coordination of the
Distributed Honeypots Project decided to use only low-interaction honeypots [5]. The
solution chosen was Honeyd, an open source tool, which offers the highest number of
functions. Some of them are unique, such as operating systems emulation at TCP/IP
stack level and the ability of detecting any activity at any TCP and UDP port without
the need of any special configuration.
Although the installation and configuration of the tools involved have to follow
the standard established by the Project, the institutions are free to set up the Honeyd
configuration file by their own way, defining which OS should be simulated and
which service should be offered. Thus, we have configured the honeypot with:
− A Linux mail server, with scripts simulating POP3 (port 110/TCP) and SMTP (port
25/TCP) services. These scripts, which offer an interaction with the attacker and
log their activity, were downloaded from the Honeyd site [6]. At first, the intruder
faces a login prompt and, if his guess for the default password is successful, he
believes to be connected to a true service and can try to run some commands. This
will be mentioned in the analysis as honeypot 9.
− A FreeBSD ® file sharing server with a script simulating a FTP service (port
21/TCP). Additionally, the DNS (port 53/UDP) and HTTP (port 80/TCP) ports
were left open. Honeypot 13.
− A Macintosh ® vulnerable workstation. There are no services being simulated but
all TCP and UDP ports are open. Honeypot 14.
− A Microsoft Windows ® XP Home station (honeypot 15) and two Microsoft
Windows ® 98 SE stations (honeypots 5 and 12) with a script simulating a
command prompt with backdoors in six ports. This script was created by the
Honeynet.BR Project [3] team and acts as a machine infected by many well-known
worms such as: Blaster, Sasser, Dabber and Lovgate. It logs the commands typed
by the intruder, as well as the non-printable characters in hexadecimal format.
− Three Microsoft Windows ® XP Professional stations with a script simulating a
backdoor installed by the MyDoom virus in four ports. This script was also
designed by the Honeynet.BR Project [3] team. It saves the files downloaded to the
honeypot and logs all attempts of using the backdoor’s proxy functions. Honeypots
2, 6 and 10.
− A CheckPoint Firewall-1 ® with all ports closed, except ports 23/TCP and 80/TCP,
which were blocked. Honeypot 4.
The other hosts (honeypots 1, 3, 7, 8 and 11) were left with the default
configuration from HOACD, which simulates a Microsoft Windows ® XP
Professional station with some open ports. All these ports are greatly known as
constant targets of attacks against Windows machines.
87
3 Results
The tool used to generate summaries and graphics from the Honeyd logs was
Honeydsum v. 0.3, a script, written in Perl, developed by the Honeynet.BR Project
team. It is a free software and it is available for download at the Project’s site [3].
Honeydsum organizes the data from the logs, sorting them by virtual honeypot
(each honeypot corresponds to an IP address from the block of addresses monitored
by Honeyd). For each honeypot, Honeydsum informs the number of connections per
source IP and destination port. A connection is considered to be any access attempt to
the port. Honeydsum also shows the top source and port access and the total number
of connections (to all honeypots) per protocol (Connection Counter) and per hour.
Different parameters can be used as filters to produce the summaries, such as
ports, protocols, IP addresses or networks. If no filter is specified, all possible
information is generated. It is also possible to sanitize the IP addresses so as not to
disclose the honeypots addressing. For this, Honeydsum allows to specify the private
addresses that will have to substitute the public addresses.
The tool supports input from multiple Honeyd log files. If the Honeyd
configuration file is also given as input, it displays the configuration of each honeypot
in the summary. Honeydsum is able to generate summaries in simple text files or in
valid HTML, for which it has the option to create graphics illustrating the information
showed by the summary.
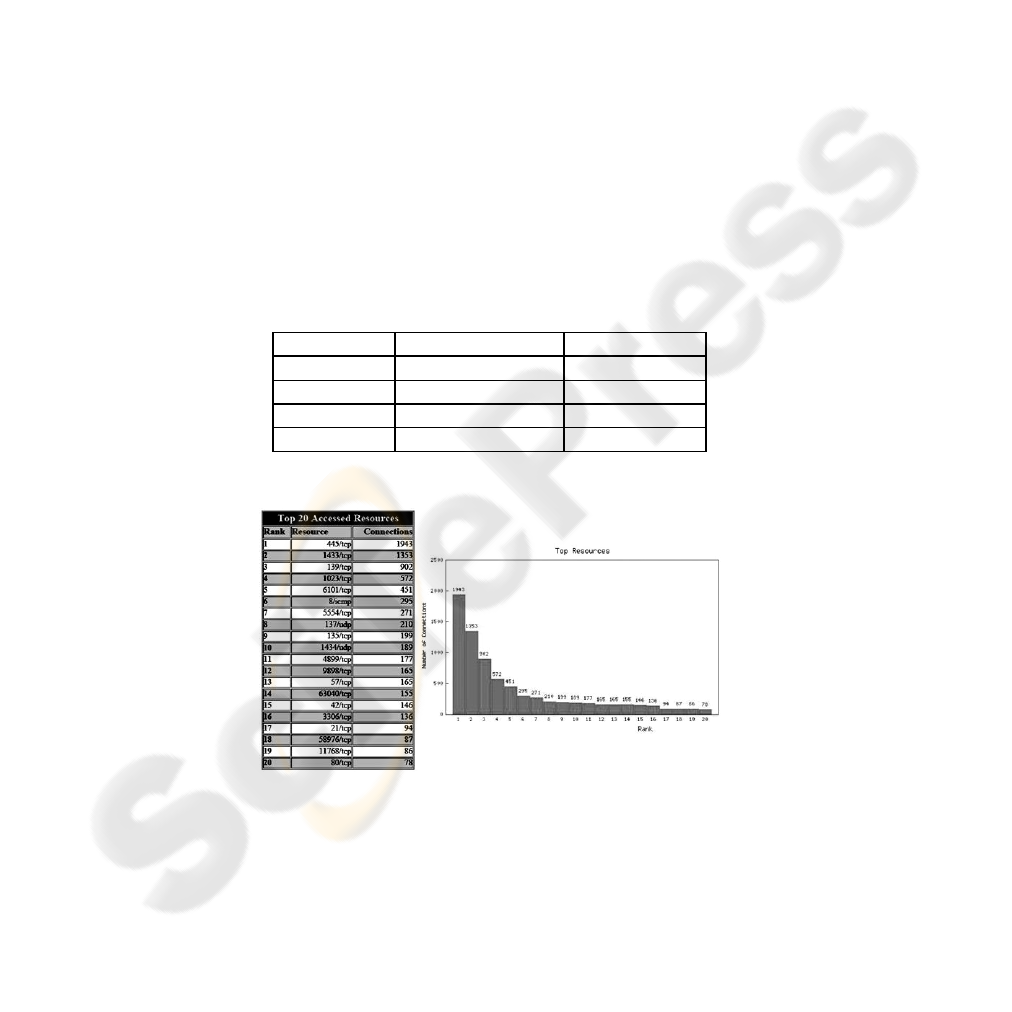
Table 1. Connection counter
Protocol Connections Percentage
TCP 7938
91,7%
UDP 418 4,85%
ICMP 297 3,45%
Total 8653 100%
Fig. 1. Top resources
The first piece of information given in the summaries generated from the logs of
the observation period was the number of access attempts logged by the honeypots in
88
one week: 8653, which represents an approximate average of 575 attacks suffered per
honeypot. This is a considerable number, regarding that the access to the university’s
network was not completely released, since the filters from RNP were still blocking
traffic from some sources.
By looking at Table 1, we observe that TCP was the protocol most used by the
hackers. This can be explained by the fact that there are much more services that use
TCP than other protocols. Although the total amount of ports is the same for TCP and
UDP, for example, only two UDP ports appear among the 20 most accessed resources
(considering all honeypots) in the period, as shown in Figure 1.
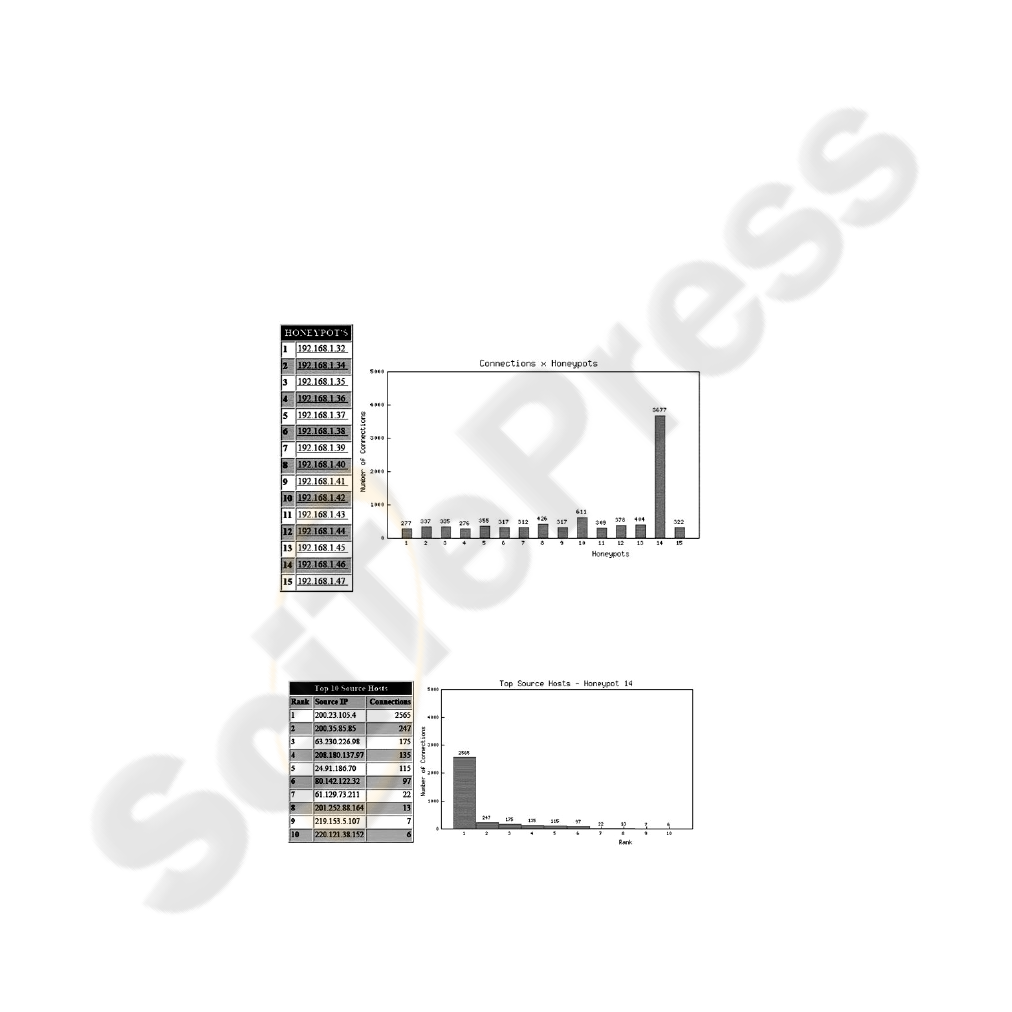
The next graphic (Figure 2) shows the number of connection attempts in each
honeypot during the week. The eccentricity observed in honeypot 14 is due to the fact
that all its ports were open. Most of the IP addresses that attacked it (Figure 3) have
made much more access attempts than the average observed on the other honeypots.
This indicates that possibly DoS attacks or vulnerability scans were launched against
the ports that received more connection attempts in the supposed machine (Figure 4):
- Ports 445 and 139: Microsoft-ds and netbios-ns services, respectively, with
vulnerabilities explored by Nimda and Blaster.
- Port 1433: MS-SQL service with vulnerability explored by SQL worms.
Another fact to point out is that all these ports are used by Microsoft ® services..
According to [7], the systems of this company are the major targets of attacks,
because they can resist for about 20 minutes when attacked, while Linux systems can
resist up to three months. This does not prove that Windows ® is more vulnerable
than Linux; it only shows that it is the favorite target of the hackers.
Fig, 2. Total number of connections per honeypot
Fig. 3. Top source hosts at honeypot 14
89
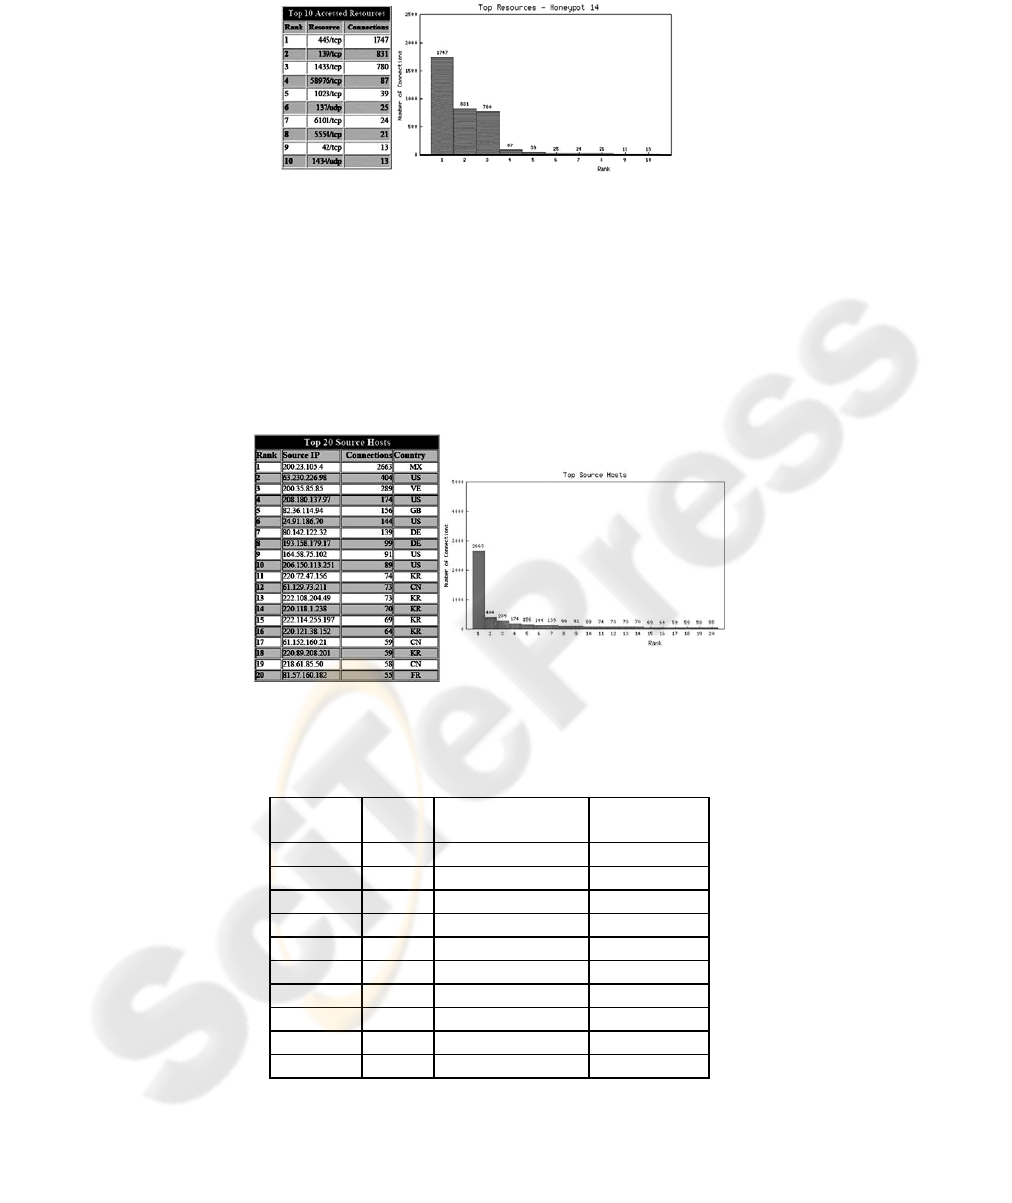
Fig. 4. Top resources at honeypot 14
The next graphic deals with the sources of the attacks. Only the 20 IP addresses
that more attacked our honeypot were listed in a Top 20 graphic (Figure 5), together
with the country they belong to, but the total number of sources logged during the
observation period was 652 IP addresses, which gives an average of about 13 access
attempts for hacker. The first source of the list is also the one that more attacked
honeypot 14 (Figure 3). Probably, the difference between the number of total
connections from this source and those recorded only in honeypot 14 represents the
connections related to IP scans made by this source on the other honeypots. The two
following sources of the list also had a number of connections above the average.
Fig. 5. Top source hosts
Table 2. Top source countries
Rank Acro
nym
Country Source IP
addresses
1 CN China 163
2 US United States 114
3 KR South Korea 67
4 NL Netherlands 36
5 DE Germany 31
6 JP Japan 26
7 GB Great Britain 23
8 TW Taiwan 21
9 RU Russia 17
10 IT Italy 13
90

The acronyms of the countries corresponding to each IP address informed in
Figure 5 were obtained by means of a query to WHOIS services. Table 2 shows a list
of the countries that had the major number of distinct IP addresses which attacked the
honeypot’s environment. 51 countries were detected, but we decided to include only
the top ten, because, after that, the difference between them starts to be very small.
As we can observe, the country that had more distinct sources of attacks was
China, followed closely by the United States. The site [7] presents daily statistics of
attacks against a honeynet that is part of the Honeynet Research Alliance. In each
report, there is a ranking of the countries that had more sources of attacks on that day.
China and the United States mostly appear in the first positions of the list. The site of
NBSO [8] also presents statistical data that confirm that this analysis does not differ
very much from reality, since the three countries subsequent to Brazil, which appear
in the graphic of countries sources of attacks, are the same ones found in this analysis.
Figure 6 illustrates the number of attacks suffered on each day of the week. We
could observe that the biggest amount of attacks happened in the middle of the week.
The weekend seems to have had high traffic because of the data collected on Sunday;
however, a detailed analysis of the logs of that day discloses that most of that high
amount of attacks (66%) was launched by a single source. That source is the same one
that appears on the top of the list of IP addresses that originated the greatest number
of attacks.
According to [7], the amount of attacks tends to be lesser at the weekend.
Considering the fact that at the weekend the offices are closed and, therefore, a great
number of machines are off, we conclude that most of the attacks come from
organizations that do not have good security mechanisms.
This analysis also showed that the top source concentrated its attacks on honeypot
14, more specifically on ports 139 and 445. Moreover, observing previous logs, it is
verified the presence of IP scans carried out by this same source, initially with ICMP
packages and later in TCP ports 1433 and 57. Superficially, we might conclude that
the attacks to honeypot 14 were originated from the previous scans, because this
honeypot was the only machine to which the source could establish a connection.
Although normally the attacks are carried out in ports that have been scanned for
vulnerabilities, there is also the practice of attacks that vary the ports during the
footprint. Thus, there may be a link between the scans and the attacks.
Fig. 6. Connections per day – Monday does not appear because the observation period covered
only parts of that day
91

4 Final Statements
With the inclusion of UnB as a member of the Brazilian Honeypots Alliance, it will
be possible to follow new research and technology development lines at the
information security area. Thus, it can be said that this project is only the beginning of
a great venture from UnB. From now on, since the university network administration
has a closer contact with the presented technologies, new policies could be taken on to
strengthen the security.
The installed tool will be of great value both nationally and locally. To the
Alliance, it will be important for being another source of data. The more distributed
the network is, i.e., the more members around the country it has, the more
representative will be its results. The Alliance will also count on with another
research team working together on the determination of new trends in intrusions.
For the university, it will be possible to identify problems such as the most
searched vulnerabilities, from internal and external networks. The existent filter on
the institution router revealed itself efficient for preventing the attacks to the most
accessed resources, but a honeypot could help to verify if the organization security
policies could be reinforced. With the honeypot, it is possible to identify new threats
and rearrange the filtering rules in good time to avoid worse consequences. It will
contribute also to detection of internal attack sources and infected workstations,
because, during the collected data analysis, it was verified that there is a great volume
of internal attacks, which shows that the biggest risk can be internal.
With the implementation of a honeypot, there is a huge volume of data to be
analysed. In one week it was verified an enormous quantity of attacks even with some
filtering on the source IP addresses in order to delimit the database to only foreign
addresses. The time period of a week may seem short but this interval was chosen
because of the amount of information acquired in a data analysis task.
The standardization of the ingress process, from the honeypot implementation
until the effective entrance, when the official Alliance summaries start to be disposed,
is decisive to the good flow of the project accomplishment. The determination of the
procedures to be followed helps on the inclusion of new members, as was seen during
the installation and configuration of the machine. Even though, a documentation of
the problems found by other members and their solutions, after which a candidate
could seek, would help the project integration even more.
The complete solution for the honeypot, with Honeyd running over OpenBSD, is
adequate because the first is a strong and efficient tool from its category, whereas the
latter is considered the most secure OS [9]. The configuration given by HOACD
looks trustful too, so that it assures the protection of the machine in that it is installed,
avoiding its compromising and its utilization as a starting place for new attacks.
Finally, it was observed that the analysis tools could get better in a way of
interacting more with the user. The used programs do not have user friendly interface,
probably for being open source. Furthermore, its configuration is too limited and the
personalization of the results requires advanced knowledge of the technology.
92

4.1 Future Works
At this project, data from Brazil were not taken into consideration, being analysed
only foreign attacks. A new deeper and more comprehensive analysis must be done in
order to examine the network activities at all.
Another job is the study of the internal attacks. This examination ought to show
the most important security problems which the university has and to propose
solutions, so that it contributes to a greater protection of the internal assets. In
addition, other filtering can be done, e.g., to choose some kind of attack and to select
only the data logged by some related ports.
Some used tools are to a certain extent limited so that they need improvements or
new ones to be developed, like the simulation scripts. A good firewall log analysis
tool is also needed. With more tools and kinds of log to analyse, the data collected by
this project, as the ones that need more intense work, could be studied further.
In relation to safeguarding, another measure to be taken is to improve the physical
access control to the machine because of the risk of a reboot or even a shutdown by
others. In the circumstances of other honeypots being installed at UnB as part of the
Distributed Honeypots Project, it would be interesting to deploy a log host to
concentrate all the information.
As a final point, it is necessary to write a documentation of the project with regard
to maintenance: everything executed should be recorded to facilitate the future works
and to function as a guide to upcoming members.
References
1. The Honeynet Project. Retrieved July, 2004, from http://www.honeynet.org
2. Brazilian Honeypots Alliance. Distributed Honeypots Project. Retrieved July, 2004, from
http://www.honeypots-alliance.org.br
3. The Honeynet.BR Project. Retrieved July, 2004, from http://www.honeynet.org.br
4. Rocha, L.F.: Especialistas brasileiros lançam Consórcio Brasileiro de Honeypots. Módulo
Security Magazine, São Paulo, n. 335, 05 abr. 2004. Retrieved November, 2004, from
http://www.modulo.com.br/index.jsp?page=3&catid=7&objid=2831&pagecounter=0
5. Franco, L.H., Barbato, L.G.C., Montes, A.: Instalação e uso de honeypot de baixa
interatividade: Tutorial. São Paulo, 18 abr. 2004. Retrieved October, 2004, from
http://www.honeynet.org.br/presentations/hnbr-gts2004-01-tutorial.pdf
6. The Honeyd Project. Developments of the Honeyd Virtual Honeypot. Developed by Niels
Provos, 1999-2004. Retrieved August, 2004, from http://www.honeyd.org
7. Security and Information Integrity: SIG^2 G-TEC Honeynet Project. Retrieved January,
2005, from http://iwfc.security.org.sg
8. NIC BR Security Office: Estatísticas dos Incidentes Reportados ao NBSO. Retrieved
November, 2004, from http://www.nbso.nic.br/stats/incidentes
9. The OpenBSD Project. Developed by Theo de Raadt, 1996-2004. Retrieved August, 2004,
from
http://www.openbsd.org
93
