
Automated Annotation of Multimedia Audio Data with
Affective Labels for Information Management
Ching Hau Chan and Gareth J. F. Jones
Centre for Digital Video Processing & School of Computing
Dublin City University, Dublin 9, Ireland
Abstract. The emergence of digital multimedia systems is creating many new
opportunities for rapid access to huge content archives. In order to fully exploit
these information sources, the content must be annotated with significant features.
An important aspect of human interpretation of multimedia data, which is often
overlooked, is the affective dimension. Such information is a potentially useful
component for content-based classification and retrieval. Much of the affective in-
formation of multimedia content is contained within the audio data stream. Emo-
tional features can be defined in terms of arousal and valence levels. In this study
low-level audio features are extracted to calculate arousal and valence levels of
multimedia audio streams. These are then mapped onto a set of keywords with
predetermined emotional interpretations. Experimental results illustrate the use
of this system to assign affective annotation to multimedia data.
1 Introduction
Computer systems now enable enormous volumes of high quality multimedia content
to be distributed across the Internet. In order to most effectively exploit this data, con-
tent providers require effective tools for efficient selection and classification of relevant
content. A core technology for such information management tools is the automated
analysis of the content to index significant features. The content of multimedia data
relates both to clearly defined semantic units such as words and visual objects, and to
more subjective interpretation, such as the emotions it elicits in those viewing it. Ex-
isting work on multimedia content analysis has largely concentrated on recognition of
the objective features. A number of current large-scale prototype multimedia digital li-
brary systems based on using these features have been developed, for example [1][2].
The feature indexing tools within these systems rely on extraction of low-level feature
analysis such as the pitch or frequency spectrum of the audio or the colour distribution
and texture in the video. These low-level features can also be used to recognize non-
verbal features in multimedia audio such as special effects [3], and can be interpreted
in terms of their contribution to the affective labelling of multimedia data [4]. In this
paper we describe our system for analysis and interpretation of audio data streams to
provide verbal annotation of affect within multimedia documents.
Interpretation of the affective dimension is an important natural component of hu-
man classification and retrieval of information. Affective Intelligence is defined in [5]
as the communication and management of affective information in human-computer
Hau Chan C. and J. F. Jones G. (2005).
Automated Annotation of Multimedia Audio Data with Affective Labels for Information Management.
In Proceedings of the 5th International Workshop on Pattern Recognition in Information Systems, pages 94-103
DOI: 10.5220/0002576800940103
Copyright
c
SciTePress

interaction. Audio data streams contain significant affective information, recognizing
this dimension of multimedia data enables us to label it with emotional metadata tags
for use in information management applications. As more and more human tasks are
automated by computers, people will have to spend more time interacting with com-
puters. Making sure that their senses are stimulated appropriately is a key element in
delivering a more natural communications environment. A good example is how mu-
sic and sound effects are often used to great effect to convey emotional information in
movies and commercials. A current example of the augmentation of verbal labelling to
take account of affective interpretation is the Emotive Alert system [6] from the MIT
Media Lab. Emotive Alert filters voicemail messages according to various affective
axes, including urgency, formality, and happy or sad. Such labels may be used on their
own or to complement existing techniques. For example, Emotive Alert and word-level
recognition could be combined to realize new ways of browsing for relevant messages.
Automatically labelling the significant affective features of multimedia content poten-
tially allows a new dimension for user interaction with multimedia content. For exam-
ple, you could search for sad or happy sections of a movie, or compare the structure of
movies in terms of emotional development. Such methods could also be used to label
emotional expressions in discussions or debates, e.g. anger or sadness, alongside the
verbal transcriptions currently used to manage this content. Thus a different response
may be produced for the same transcribed content depending on their affective context.
The system presented in this paper is a step toward labelling the emotional dimen-
sion of audio streams using low-level analysis of audio features and their associations
with emotional labels. A similar idea is explored for manually assigned metadata in
[7], which examines the structure of movies based on the emotional priming of words
appearing in “audio descriptions” provided for sight impaired viewers.
This paper is organized as follows: Section 2 introduces affect representation in the
context of describing our affect annotation system, and reviews existing work in audio
analysis for affect extraction and labelling, Section 3 gives examples of our current
experimental investigations, and Section 4 summarizes our conclusions and outlines
our ongoing work.
2 Representation, Extraction and Labelling of Affective States
Our affect annotation system combines work from fundamental representation of emo-
tional states, with methods to recognize these states in audio content.
2.1 Dimensional Representation of Affective States
It is demonstrated in [8][9] that human affective states can be adequately described in
terms of three basic underlying dimensions: arousal, valence and control (dominance).
Arousal is a continuous response ranging from one extreme of sleep through interme-
diate states of drowsiness and then alertness through to frenzied excitement. Valence
describes the degree of pleasantness-unpleasantness ranging from a “positive” response
associated with extreme happiness or ecstasy through to a “negative” response result-
ing from extreme pain or unhappiness. Control is useful to distinguish between affective
95

states with similar arousal and valence, with differing feelings of control or influence
over events ranging from total control to no control. From this definition “emotion” not
only describes occasional passionate incidents, but rather a person is viewed as being
in an emotional state within this three dimensional space at all times.
It has been observed that the control dimension plays only a limited role in extract-
ing affective content from multimedia data [10]. In our work we thus follow the strat-
egy adopted in [4] of measuring only arousal and valence values. Measuring arousal
and valence levels across a multimedia document enables us to extract information of
its affective content. For example, regions with high arousal are likely to correspond to
the “most exciting” segments, and areas of low valence to regions which may provoke a
negative response in the viewer. A classic way to combine measurements of arousal and
valence is the affect curve. This plots arousal on the y-axis against valence on the x-axis.
Each point of this curve corresponds to an affective state. Plotted across a multimedia
document, regions of the curve where temporally close points are located in clusters
correspond to affective states prevailing in these regions. Figure 3 shows one of our
experimental affect curves. Details of the derivation and further interpretation of these
affect curves to annotate audio soundtracks are described in the following sections.
2.2 Extraction of Arousal and Valence from Audio Data
In order to be able to represent the affective dimension of multimedia audio data, we
need to extract arousal and valence information. Methods for doing this for voiced
speech in the context of audio-visual recordings are introduced in [4], where the extrac-
tion methods are based on a combination of analysis of both audio and visual features.
In our current study, we adopt similar extraction methods to those used in [4], but focus
only on the audio information stream and analyze all the audio data, including voiced
and unvoiced speech, music, special effects and silence. The following subsections out-
line our methods to extract arousal and valence information.
Arousal Modelling The arousal level is modelled based on the energy of the audio
signal. The sampled audio data is first divided into overlapping frames. The short-time
energy of an audio signal is defined as,
E
n
=
1
N
X
m
[x(m)w(n − m)]
2
where x(m) is the sampled audio signal, n is the time index of the short-time energy,
and w(m) a rectangular window. If it is assumed that the audio signal changes rela-
tively slowly within a short interval and taking a suitably small frame, E
n
is calculated
for each frame [3]. In our experiments using a frame size of 20ms and a sampling fre-
quency of 44.1kHz with a 2/3 overlap of frames was found to be effective. The energy
level can vary significantly between adjacent frames. However, variations in emotion
do not occur abruptly in this manner. For example, excitement may increase as the ac-
tion develops, for instance during the build up to an attack on goal in a soccer match,
and then decrease gradually afterwards. In order to more appropriately model overall
changes in arousal levels as affective state of the content changes, the measured short-
time energy is convoluted with a long Kaiser window as suggested in [4].
96

Valence Modelling It is noted in [12] that extraction of features to determine valence
values is much more difficult than arousal. In our system we currently use pitch to mea-
sure the magnitude and sign of valence, as suggested in [4]. We do this by calculating
the short-time fundamental frequency based on peak detection from the spectrum of
the sound. This is done using an autoregressive model of order 40 as described in [3].
The spectrum calculated using the autoregressive model makes it much easier to extract
harmonic peaks in the spectrum, including the fundamental frequency, than one com-
puted directly using a fast Fourier transform. Short-time fundamental frequency values
are calculated for the same 20ms frames as used to calculate the arousal values. Using
this model is important for our system where the data is very varied, and thus a robust
method of frequency analysis is required.
Valence varies from a “neutral feeling” towards varying levels of either negative or
positive response. The system needs to identify a frequency corresponding to this neu-
tral feeling; points whose pitch value varies from this can then be labelled with a degree
of positive or negative valence. The neutral pitch will vary with the audio source type
and even between different speakers. There are two issues to be addressed here: iden-
tifying the source, and computing a neutral pitch for each source. The measured pitch
of each point should then be normalized relative to the appropriate neutral state. This
problem is recognized in [4] which is only concerned with the measurement of valence
for voiced speak. The approach taken in this method was to assume a fixed neutral pitch
for all sources and subtract this from measured values. Due to the greater variation in
the sound sources passed to our system and the consequential variation in neutral pitch,
we currently take the approach of assuming that the mean pitch value of the signal cor-
responds to the neutral state and subtract this from all the points in the data stream.
We realize that this method assumes that sources will have similar amounts of positive
and negative response, which may not be the case for some multimedia sources. We are
exploring methods to compute a more accurate source dependent neutral frequency.
The normalized measured pitch values are subject to large changes between adjacent
frames, similar to the variation in the short-time power used to measure the arousal, and
for the same reason as before, we again smooth the valence function using a long Kaiser
window.
2.3 Verbal Labelling of Affective States
The interpretation of the arousal and valence values extracted using the audio analy-
sis methods described in the previous section, is much easier if they can be identified
with verbal labels corresponding to associated affective states. In order to do this we
have developed a method based on results of experiments described in [7][8]. In the
study described in [8] a group of subjects were asked to define 151 emotion-denoting
keywords in terms of the dimensions of arousal, valence and dominance. Each subject
labelled a subset of the keyword set, with each keyword being assessed by an average
of 30 subjects. Mean values of the dimension values were then computed across all sub-
jects rating each keyword. The mean values were then transformed linearly to a scale
ranging from −1 to +1 with a neutral value of 0. For example, the keyword “bold” has
arousal 0.61, valence 0.44 and dominance 0.66, and “nonchalant” has arousal −0.25,
valence 0.07 and dominance 0.11. These values are of the order that we would expect
97

to see based on the definitions of arousal, valence and dominance in Section 2.1. Using
the results from [8], we can associate each measured point on an affect curve with the
nearest keyword. In order to fit our arousal and valence results onto the same scale as
the emotion-denoting keyword the values are scaled across the document into the range
−1 to +1. This once again assumes that the full range of states is suitable for all multi-
media data sources, exploring methods of determining affective range within individual
documents is the subject of ongoing work.
The final stage of the labelling method is to associate each keyword with an affective
state. We do this by utilizing part of the approach to affective labelling based on audio
descriptions of movies in [7]. Audio descriptions are carefully scripted spoken annota-
tions added to movies for the visually-impaired. In the gaps between existing dialogue a
narrator gives important information regarding on-screen scenes and events, and about
characters’ actions and appearances. The method described in [7] scans these audio de-
scriptions for words corresponding to visibly manifested emotions. This approach is
based on a cognitive theory of emotion proposed in [11]. This theory treats emotions
as agents’ appraisals of actions, events and objects in their environments, where these
are made with respect to their important goals. In terms of this theory, if a character is
in an affective state of “delight” it is because something unexpected has happened that
assists them in achieving one of their goals. Our system follows the approach of [7]
in mapping the recognized affect states to one of the 22 emotion classes proposed in
[11]. In [7] the 22 emotions are expanded to a set of 627 emotion keywords using the
WordNet ontology. For example, the emotion class “fear” is associated with the key-
word “alarmed”. When “alarmed” is observed in the audio description, this position in
the data is annotated with the emotion “fear”.
Our system annotates multimedia audio data with occurrences of the 22 emotion
classes by mapping the set of 151 emotion-denoting keywords from [8] to the 22 emo-
tions classes. We found that 50 of the 627 keywords from [7] were present in the list
of 151 words; we then manually mapped the remaining 101 words onto the emotion
classes using a dictionary to identify the nearest emotion for each word. In operation
each point on our automatically extracted audio affect curve is labelled with the nearest
of the 151 emotion-denoting keywords and then mapped to the corresponding emotion
class.
3 Experimental Investigation
In this section we present some examples of content annotation with out affect labelling
system. The system has so far been tested with a range of video types, including televi-
sion entertainment shows and movies. The results shown are an excerpt from a televi-
sion entertainment show and sections from the movie Enigma.
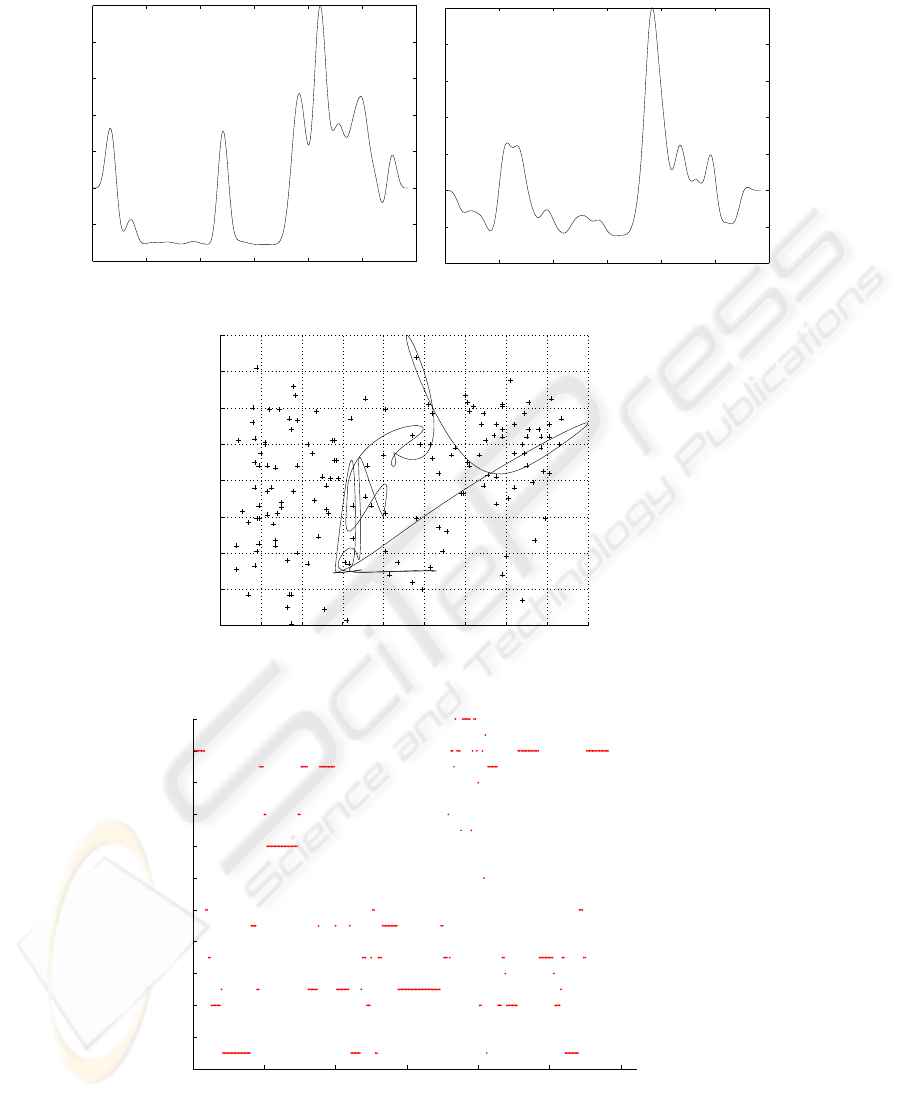
Excerpt from the show Magic. Figures 1 and 2 show arousal and valence plotted
against time for a section from a television show called Magic. The excerpt here is for
the magician’s bullet trick. The magician fires a bullet which his colleague (apparently!)
catches in his mouth. In this scene the magician first describes what will happen during
which there is some solitary applause, the bullet is fired and then the watching audience
98

applauds. The arousal and valence are low in the first sections and then increase after the
firing of the bullet. This is easily explained in terms of increased energy for the arousal
graph and higher frequencies for the valence graph when the audience applauds.
The corresponding affect curve plotting the arousal and valence from Figures 1 and
2 is shown in Figure 3. The early sections of this are concentrated around the centre of
the plot before moving to the upper right section at the end. Figure 4 shows the verbal
affect labels against time assigned based on the path of the affect curve. From this we
can see generally negative affect in the early part and more positive emotions, including
joy and pride, in the latter section.
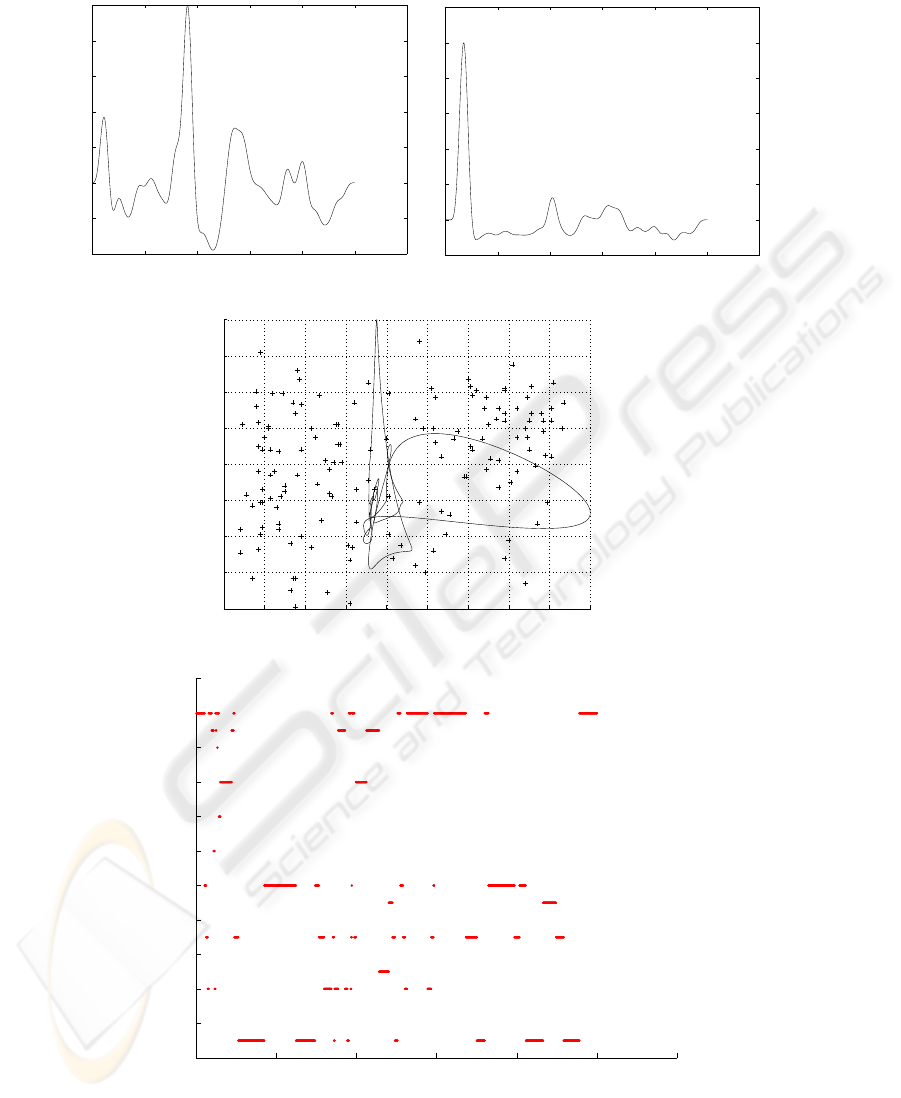
Sections from the movie Enigma. The next results are based on the analysis of two 10
minute sections from the movie Enigma. Figures 5 and 6 show the arousal and valence
graphs for the first 10 minutes of the movie, with Figures 7 and 8 showing the corre-
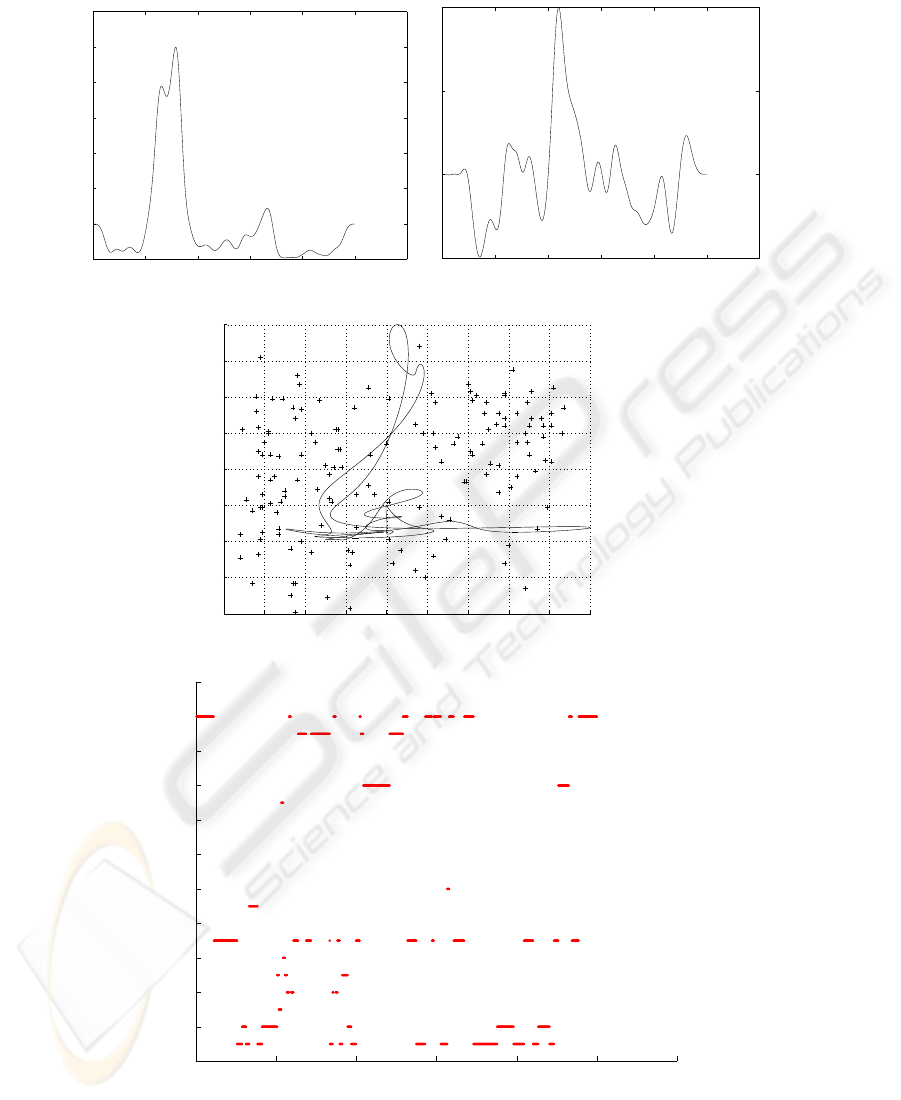
sponding affect curve and affect label plots. Figures 9, 10, 11 and 12 show similar plots
for a further 10 minute section of the movie beginning at the end of the first hour.
The first 10 minute section opens with orchestral music after which a military officer
briefs a meeting of colleagues, after this a discussion takes place including vigorous
questioning of one of the officers. From the affect label plot in Figure 8, we can see that
the whole section is dominated by negative emotions, the opening sections showing war
scenes exhibit fear, distress and remorse, in the middle of the address these disappear
and the scene is dominated by pride during the officer’s address, finally the scene ends
with the fear and shame during the questioning of the officer.
The second 10 minute section shows a scene which opens with a car chase with
sound effects of car engines and a siren. The chase ends when the pursing car crashes,
and the other car escapes and then hides in a barn. The occupants of the car then set
to work with an Enigma machine, but soon become aware that their pursuers are close
by. At the end of the scene they are discovered and a conversation begins. The arousal
graph in Figure 9 begins with high energy during the car chase which then reduces
dramatically once the chase is over. The valence is negative during the car chase and
the discovery in the barn, with higher values when it appears that the car has escaped.
These results are reflected in the affect curve in Figure 11 which shows large variations
in both arousal and valence at different times. The affect label plot in Figure 12 shows
early sections of fear, hate and distress, these largely disappear after the car chase when
we see a section of relief and admiration, during the search there is tension and suspense
before the discovery near the end of scene, during this we see the reemergence of fear
and hate, and finally relief when the pursers engage in conversation rather violence.
We notice in all the affect label plots that some emotions, such as reproach and
pride, appear regularly and apparently randomly without clear evidence from the audio
that these are appropriate labels. We hypothesize that this may be due to an interaction
between the kaiser smoothing and position of these labels of the affect curve. We are
currently investigating this behaviour.
4 Conclusions and Further Work
This paper has demonstrated that we are able to assign reasonable affective labels to
multimedia content based on the audio data stream. While the results from this initial
99

study are encouraging, we need to develop a larger and independently labelled test
corpus to provide clearer quantitative analysis of system performance. We will use this
to develop and explore the effectiveness of extended schemes to measure arousal and
valence, such as those introduced in [4] which incorporate visual motion activity and
density of shot cuts from the video stream as components in the arousal measure, and
to explore methods for identifying dominant emotions.
In our ongoing work we are extending our study to compare our automatic audio
annotation with the affect labels generated in [7] using the manual audio descriptions.
Results of this comparison may lead to methods of effectively combining the alternative
annotation schemes to provide richer or more reliable affective labelling. We also plan
to explore the use of affect annotation in the automatic comparison of multimedia docu-
ments for both retrieval and classification applications. This information might be used
to recommend items that a user might like, for example movies with similar structure
to those that they have viewed previously.
References
1. Smeaton, A.F., Lee, H. and McDonald, K.: Experiences of Creating Four Video Library
Collections with the Fischlar System, International Journal on Digital Libraries, 4(10) (2004)
42-44
2. Hauptmann, A.G., Christel, M.G.: Successful Approaches in the TREC Video Retrieval
Evaluations, Proceedings of ACM Multimedia 2004, New York City, ACM (2004) 668-675
3. Zhang, T., Kuo, C. C. J.: Content-Based Audio Classification and Retrieval for Audiovisual
Data Parsing, Kluwer Academic Publishers, (2001)
4. Hanjalic, A., Xu, L.-Q.: User-Oriented Affective Video Content Analysis, Proceedings of
the IEEE Workshop on Content-based Access of Image and Video Libraries (CBAIVL’01),
IEEE (2001) 50-57.
5. Picard, R.W., Cosier, G.: Affective Intelligence - the Missing Link?, BT Technology Journal
Vol 14 No 4, (1997)
6. Inanoglu, Z., Caneel, R.: Emotive Alert: HMM-Based Emotion Detection In Voicemail Mes-
sages, Proceedings of the 10th International Conference on Intelligent User Interfaces (IUI
’05), San Diego, ACM (2005) 251-253
7. Salway, A. and Graham, M.: Extracting Information about Emotions in Films, Proceedings
of ACM Multimedia, Berkeley, ACM (2003) 299-302
8. Russell, J., Mehrabian, A.: Evidence for a Three-Factor Theory of Emotions, Journal of
Research in Personality, 11 (1977) 273-294
9. Bradley, M. M.: Emotional Memory: A Dimensional Analysis. In: van Groot, S., van de Poll,
N.E., Sargeant, J. (eds.) The Emotions: Essays on Emotion Theory, Hillsdale, NJ: Erlbaum
(1994) 97-134
10. Dietz, R., Lang, A.: Affective Agents: Effects of Agent Affect on Arousal, Attention, Liking
and Learning, Proceedings of the Third International Cognitive Technology Conference, San
Francisco (1999)
11. Ortony, A, Clore, G.L., Coolins, A.: The Cognitive Structure of Emotions, Cambridge
University Press (1988)
12. Picard, R: Affective Computing, MIT Press (1997)
100
0 500 1000 1500 2000 2500 3000
−0.4
−0.2
0
0.2
0.4
0.6
0.8
1
Frame Index
Arousal
Sequence: Magic (Bullet Trick clip)
Length: 35 seconds
Fig.1. Magic Bullet Trick: Arousal Graph.
0 500 1000 1500 2000 2500 3000
−0.4
−0.2
0
0.2
0.4
0.6
0.8
1
Sequence: Magic (Bullet Trick clip)
Length: 35 seconds
Frame Index
Valence
Fig.2. Magic Bullet Trick: Valence Graph.
−0.8 −0.6 −0.4 −0.2 0 0.2 0.4 0.6 0.8 1
−0.6
−0.4
−0.2
0
0.2
0.4
0.6
0.8
1
Valence
Arousal
Sequence: Magic (Bullet Trick clip)
Length: 35 seconds
Fig.3. Magic Bullet Trick: Affect Curve.
0 50 100 150 200 250 300
0
2
4
6
8
10
12
14
16
18
20
22
Love
Joy
Pride
Admiration
Hope
Happy For
Relief
Satisfaction
Gratitude
Gratification
Gloat
Pity
Remorse
Shame
Self−Reproach
Reproach
Resentment
Disappointment
Distress
Anger
Hate
Fear
Frame Index
Sequence: Magic (Bullet Trick clip)
Length: 35 seconds
Fig.4. Magic Bullet Trick: Affect Label Plot.
101
0 1 2 3 4 5 6
x 10
4
−0.4
−0.2
0
0.2
0.4
0.6
0.8
1
Sequence: Enigma Movie Clip
Length: 10 minutes (0−10)
Frame Index
Arousal
Fig.5. Enigma 0: Arousal Graph.
0 1 2 3 4 5 6
x 10
4
−0.2
0
0.2
0.4
0.6
0.8
1
1.2
Sequence: Enigma Movie Clip
Length: 10 minutes (0−10)
Frame Index
Valence
Fig.6. Enigma 0: Valence Graph.
−0.8 −0.6 −0.4 −0.2 0 0.2 0.4 0.6 0.8 1
−0.6
−0.4
−0.2
0
0.2
0.4
0.6
0.8
1
Sequence: Enigma Movie Clip
Length: 10 minutes (0−10)
Valence
Arousal
Fig.7. Enigma 0: Affect Curve.
0 1 2 3 4 5 6
x 10
4
0
2
4
6
8
10
12
14
16
18
20
22
Love
Joy
Pride
Admiration
Hope
Happy For
Relief
Satisfaction
Gratitude
Gratification
Gloat
Pity
Remorse
Shame
Self−Reproach
Reproach
Resentment
Disappointment
Distress
Anger
Hate
Fear
Frame Index
Sequence: Enigma Movie Clip
Length: 10 minutes (0−10)
Fig.8. Enigma 0: Affect Label Plot.
102
0 1 2 3 4 5 6
x 10
4
−0.2
0
0.2
0.4
0.6
0.8
1
1.2
Sequence: Enigma Movie Clip
Length: 10 minutes (60−70)
Frame Index
Arousal
Fig.9. Enigma 60: Arousal Graph.
0 1 2 3 4 5 6
x 10
4
−0.5
0
0.5
1
Sequence: Enigma Movie Clip
Length: 10 minutes (60−70)
Frame Index
Valence
Fig.10. Enigma 60: Valence Graph.
−0.8 −0.6 −0.4 −0.2 0 0.2 0.4 0.6 0.8 1
−0.6
−0.4
−0.2
0
0.2
0.4
0.6
0.8
1
Sequence: Enigma Movie Clip
Length: 10 minutes (60−70)
Valence
Arousal
Fig.11. Enigma 60: Affect Curve.
0 1 2 3 4 5 6
x 10
4
0
2
4
6
8
10
12
14
16
18
20
22
Love
Joy
Pride
Admiration
Hope
Happy For
Relief
Satisfaction
Gratitude
Gratification
Gloat
Pity
Remorse
Shame
Self−Reproach
Reproach
Resentment
Disappointment
Distress
Anger
Hate
Fear
Frame Index
Sequence: Enigma Movie Clip
Length: 10 minutes(60−70)
Fig.12. Enigma 60: Affect Label Plot.
103
