
Indexation of Document Images Using Frequent Items
Eugen Barbu, Pierre Heroux, Sebastien Adam and Eric Trupin
Laboratoire Perception Systemes Information CNRS FRE 2645, University Of Rouen, Place
E. Blondel, 76 821 Mont Saint Aignan cedex, France
Abstract. Documents exist in
different formats. When we have document
images, in order to access some part, preferably all, of the information
contained in that images, we have to deploy a document image analysis
application. Document images can be mostly textual or mostly graphical. If,
for a user, a task is to retrieve document images, relevant to a query from a set,
we must use indexing techniques. The documents and the query are translated
in a common representation. Using a dissimilarity measure (between the query
and the document representations) and a method to speed-up the search process
we may find documents that are from the user point of view relevant to his
query. The semantic gap between a document representation and the user
implicit representation can lead to unsatisfactory results. If we want to access
objects from document images that are relevant to the document semantic we
must enter in a document understanding cycle. Understanding document
images is made in systems that are (usually) domain dependent, and that are not
applicable in general cases (textual and graphical document classes). In this
paper we present a method to describe and then to index document images
using frequently occurences of items. The intuition is that frequent items
represents symbols in a certain domain and this document description can be
related to the domain knowledge (in an unsupervised manner). The novelty of
our method consists in using graph summaries as a description for document
images. In our approach we use a bag (multiset) of graphs as description for
document images. From the document images we extract a graph based
representation. In these graphs, we apply graph mining techniques in order to
find frequent and maximally subgraphs. For each document image we construct
a bag with all frequent subgraphs found in the graph-based representation. This
bag of “symbols” represents the description of the document.
1 Introduction
A document image analysis (DIA) system transforms a document image into a
description of the set of objects that constitute the information on the document and
which are in a format that can be further processed and interpreted by a computer [1].
Documents can be classified in mostly graphical or mostly textual documents [2]. The
mostly textual documents also known as structured documents respect a certain layout
and powerful relations exist between components. Examples of such documents are
technical papers, simple text, newspapers, program, listing, forms,… Mostly graphical
documents do not have strong layout restrictions but usually relations exist between
Barbu E., Heroux P., Adam S. and Trupin E. (2005).
Indexation of Document Images Using Frequent Items.
In Proceedings of the 5th International Workshop on Pattern Recognition in Information Systems, pages 164-174
DOI: 10.5220/0002576001640174
Copyright
c
SciTePress
different document parts. Examples of this type of documents are maps, electronic
schemas, architectural plans …
For this two categories of documents graph based representations can be used to
describe the image content (e.g. region adjacency graph [3] for graphical and
Voronoi-based neighborhood graph [4] for textual document images).
This paper presents an approach similar with the “bag of words” method from
Information Retrieval (IR) field. We describe a document using a bag of symbols
found automatically using graph mining [5] techniques. In other words, we consider
as “symbols” the frequent subgraphs of a graph-based document representation and
we investigate if the description of a document as a bag of “symbols” can be
profitably used in a indexation and retrieval task.
The approach has the ability to process document images without knowledge of, or
models for document content. Frequent items are used in clustering of textual
documents [6], or in describing XML documents [7] , but we do not know any
similar approch in the DIA field.
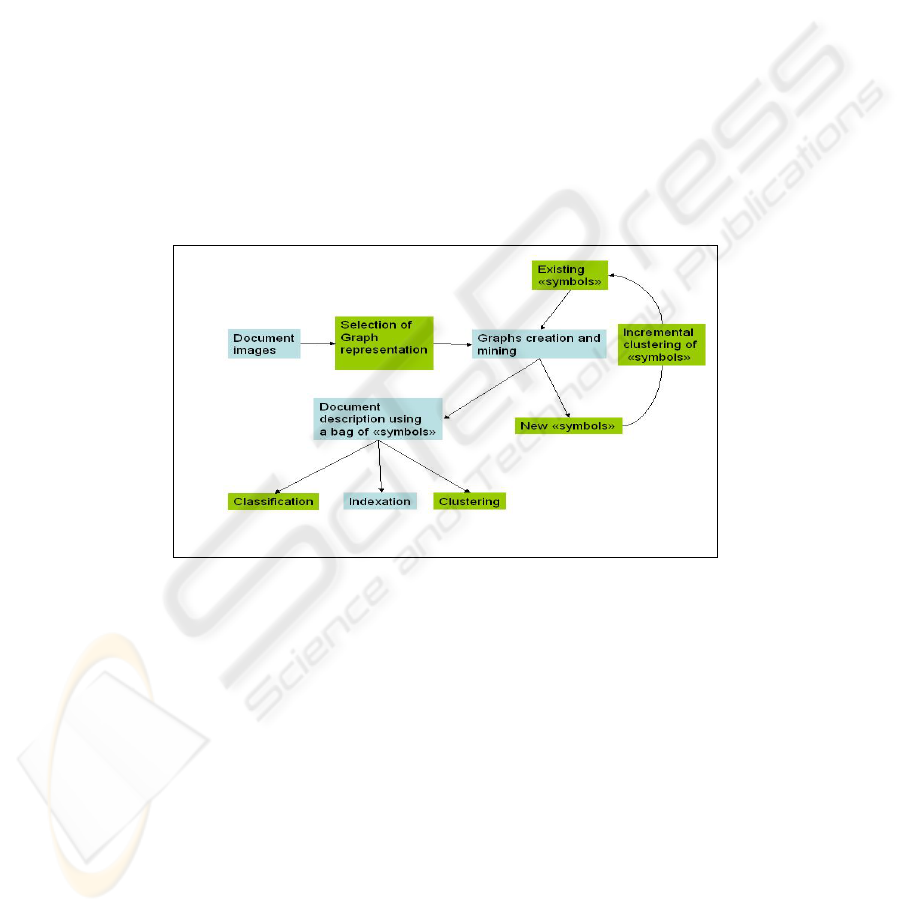
This paper is one step from a plan that has as aim to study if the bag of symbols
approach can be successfully used in document image supervised classification,
indexation and clustering (see Fig. 1).
Fig. 1. The “ bag of symbols” applications on document images
The outline of this paper is as follows. In section 2 we present a graph
representation and how we create this representation from a document image. Section
3 presents the graph-mining method used, in section 4 we describe how we search
documents based on dissimilarities between bags of objects. Section 5 shows
experimental results. We conclude the paper and outline perspectives in section 6.
2 Graph representation
Eight levels of representation for document images are proposed in [8]. These levels
are ordered in accordance with their aggregation relations. Data array, primitive,
165

lexical, primitive region, functional region, page, document, and corpus level are the
representation levels proposed.
Without loosing generality, in the following paragraphs we fix our attention on a
graph-based representation build from the primitive level. The primitive level
contains objects such as connected components (set of adjacent pixels with the same
color) and relations between them. From a binary (black and white) document image
we extract connected components. The connected components will represent the
graph nodes. On each connected component we extract features. In the actual
implementation the extracted characteristics are rotation and translation invariant
features based on Zernike moments [9]. The invariants represents the magnitudes of a
set of orthogonal complex moments of a normalized image.
Let I be an image and C(I) the connected components from I, if
)(ICc
∈
, c is
described as
, where id is a unique identifier and P the set of pixels the
component contains. Based on this set P, we can compute the center for the connected
component bounding box and also we can associate a feature vector to it. Based on
that,
. Subsequently using a clustering procedure on the feature
vectors we can label the connected component and reach the description
where l is a nominal label . The graph G(I) representing the image is
. Vertices V(I) correspond to connected components and are
labeled with component labels. An edge between vertex u and vertex w exists iff
),( Pidc=
n
Rvvyxidc ∈= ),,,,(
),,,( lyxidc=
))(),(( IEIVGG=
tywyuxwxu <−+−
2
1
22
))..()..((
,where t is a threshold that depends on the image I
global characteristics (size, number of connected components,…).
The following paragraph presents the clustering procedure used to associate each
connected component a label.
2.1 Labeling connected components
The two main categories of clustering methods are partitional and hierarchical.
Partitional methods can deal with large sets of objects (“small” in this context means
less than 300) but needs the expected number of clusters in input. Hierarchical
methods can overcome the problem of number of clusters by using a stopping
criterion [10] but are not applicable on large sets due to their time and memory
consumption.
In our case the number of connected components that are to be labeled can be
larger than the limit of applicability for hierarchical clustering methods. In the same
time we cannot use a partitional method because we do not know the expected
number of clusters. Based on the hypothesis that a “small” sample can be informative
for the geometry of data, we obtain in a first step an estimation for the number of
clusters in data. This estimation is made using an ascendant clustering algorithm with
a stopping criterion. The number of clusters found in the sample is used as input for a
partitional clustering algorithm applied on all data.
We tested this “number of cluster estimation” approach using a hierarchical
ascendant clustering algorithm [11] that employes Euclidean distance to compute the
dissimilarity matrix, complete-linkage to compute between-clusters distances, and
166
Calinsky-Harabasz index [10] as a stopping criterion. The datasets ( ) (see
Table 1.) are synthetically generated and contain well separated (not necessary
convex) clusters.
321
,, TTT
Table 1. Data sets description
T |T| no. of clusters
T1 24830 5
T2 32882 15
T3 37346 24
Table 2. Proposed number of clusters
T \ |S| 50 100 300 500 600 700
T1
[6, 8, 7, 6, 5,
6, 6, 6, 5, 5]
6
[5, 7, 9, 7, 5,
5, 7, 5, 5, 7]
5
[7, 5, 7, 8, 7,
5, 5, 5, 7, 7]
7
[8, 7, 5, 5, 5,
5, 5, 5, 5, 5]
5
[5, 5, 5, 5, 5,
7, 7, 7, 7, 5]
5
[5, 5, 7, 5, 7,
5, 5, 7, 5, 5]
5
T2
[9, 15, 15,
14, 13, 15,
13, 13, 14,
15]
15
[15, 15, 13,
15, 15, 15,
15, 15, 15,
15]
15
[15, 15, 15,
15, 15, 15,
15, 15, 15,
14]
15
[15, 15, 15,
15, 15, 15,
15, 15, 15,
15]
15
[15, 15, 15,
15, 15, 15,
15, 15, 15,
15]
15
[15, 15, 15,
15, 15, 15,
15, 15, 14,
15]
15
T3
[11, 7, 9, 18,
7, 7, 6, 4,
14, 8]
7
[6, 14, 23,
21, 7, 17,
23, 16, 12,
11]
23
[22, 24, 23,
19, 23, 24,
24, 21,
21,24,] 24]
24
[21, 25, 25,
24, 22, 24,
23, 24, 24,
24]
24
[20, 25, 21,
24, 19, 23,
24, 25, 24,
22]
24
[23, 20, 21,
20, 25, 24,
24, 21, 25,
24]
24
Considering S the sample extracted at random from a test set, in Table 2 we
present predicted cluster numbers obtained for different sample sizes. After repeating
the sampling procedure for 10 times if the test set is for example |S|=50, we obtain a
set of estimations for the number of clusters. We can see that by using a majority
voting decision rule we can find the good number of clusters in most of the cases and
even when the sample size is very small (50 or 100) compared to the data set size.
We employed our sampling approach combined with the k-medoids clustering
algorithm [12] on the connected components data set from images in our corpus (see
section 5). The k-medoids clustering algorithm is a more robust version of the well
known k-means algorithm. The images from our corpus contain 6730 connected
components. The proposed number of clusters using ten samples of size 600 is
[16,14,17,16,16,19,7,17,15,16] and by considering the majority we use 16 clusters as
input to the partitional clustering algorithm.
After labeling the connected components (nodes in the graph) subsequently we
describe the way we add edges to the graph. The edges can be labeled or not (if
unlabeled the significance is Boolean: we have or have not a relation between two
connected components) and can be relations of spatial proximity, based on “forces”
[13], orientation or another criterion.In our actual implementation the distance
between centers of connected components is used (see Fig. 2). If the distance between
two connected components centers is smaller than a threshold, then an edge will link
the two components (nodes).
167

3 Graph mining
“The main objective of graph mining is to provide new principles and efficient
algorithms to mine topological substructures embedded in graph data” [5].
Mining frequent patterns in a set of transaction graphs is the problem of finding in
this set of graphs those subgraphs that occur more times in the transactions than a
threshold (minimum support). Because the number of patterns can be exponential this
problem complexity can also be exponential. An approach to solve this problem is to
start with finding all frequent patterns with one element, then all patterns with two
elements, etc in a level-by-level setting . In order to reduce the complexity different
constraints are used: the minimum support, the subgraphs are connected, and not
overlapped.
The first systems emerged from this field are SUBDUE and GBI [5]. These
approaches use greedy techniques and hence can overlook some patterns. The
SUBDUE system search subgraphs in a single graph using a minimum description
length-based criterion. Complete search for frequent subgraphs is made in an ILP
framework by WARMR [5]. An important advance is the introduction of the concept
of closed subgraph. A graph is said to be closed or maximal if it does not have a
super-graph with the same number of apparitions in the dataset [14]. The graph-
mining systems were applied to scene analysis, chemical components databases and
workflows. A system that is used to find frequent patterns in graphs is FSG (Frequent
Subgraph Discovery) that “finds patterns corresponding to connected undirected
subgraphs in an undirected graph database”[15].
In our document image analysis context we are interested in finding maximal frequent
subgraphs because we want to find symbols but to ignore their parts.
The input for the FSG program is a list of graphs. Each graph represents a
transaction. We present subsequently how we construct the transactions list starting
from a set of document images. Using the procedure presented in section 2 we create
for each document an undirected labeled graph.
168
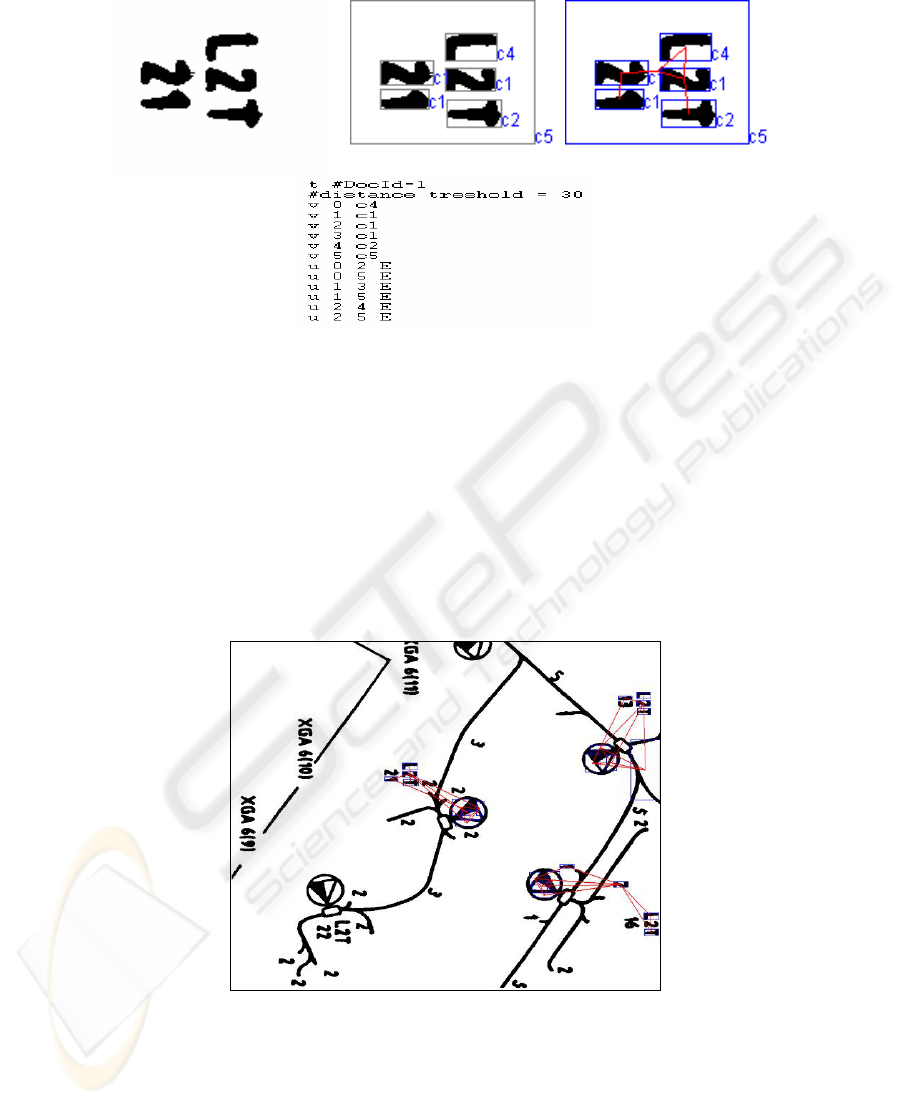
Fig. 2. An image (width=123, height=96) and associated graph transaction
Every connected component of this graph represents a transaction. We can further
simplify the graphs by removing vertices that cannot be frequent and their adjacent
edges. Using FSG we extract the frequent subgraphs and we construct a bag of graphs
occurring in each document. In the following paragraphs we consider that the
frequency condition is sufficient for a group of connected components to form a
symbol and we will conventionally make an equivalence between the frequent
subgraphs found and symbols. As we can see in the example (Fig. 2) the proposed
symbols are far from being perfect due to the image noise, connected components
clustering procedure imperfections, … however we can notice the correlation between
this artificial symbol and the domain symbols.
Fig. 3. Frequent subgraph and its occurences in an image
In conclusion, the subgraphs proposed as frequent are used to model a document
as a bag of symbols. Because some documents may not contain any symbols the
169

document representation is based on two vectors containing connected components
labels, and symbols labels.
()
(
)
....,...,,...,,,,...,,: 2121
21
21
mnjjjiii jjjiiissscccA mn
≤
≤
≤
≤
4 Dissimilarity between document descriptions
In this paragraph we present the dissimilarity measure employed between the
documents descriptions that we used.
A collection of documents is represented by a symbol-by-document matrix A,
where each entry represents the occurrences of a symbol in a document image,
A=
, where is the weight of symbol i in document k. Let be the
frequency of symbol i in document k, N the number of documents in the collection,
and
the total number of times symbol i occurs in the whole collection. In this
setting conform with [16] one of the most effective weighting scheme is entropy-
weighting. The weight for symbol i in document k is given by :
)( ika
ika
ikf
in
))log(
)log(
1
1(*)1log(
1
∑
=
++=
N
j
ij
i
ij
ikik
ni
f
n
f
N
fa
Now, considering two documents A, B with the associated weights
where t is the total number of symbols, then
),...,,(),,...,,( 2121 tt bbbBaaaA ==
2/1
1
2
1
2
1
)(
*
1),(
∑∑
∑
==
=
−=
t
i
i
t
i
i
t
i
ii
ba
ba
BAd
represents a dissimilarity measure based on the cosine correlation.
5 Experiments
The corpus used for evaluation contains 60 images from 3 categories: electronic (25
images) and architectural schemas (5 images) and engineering maps (30 images) (see
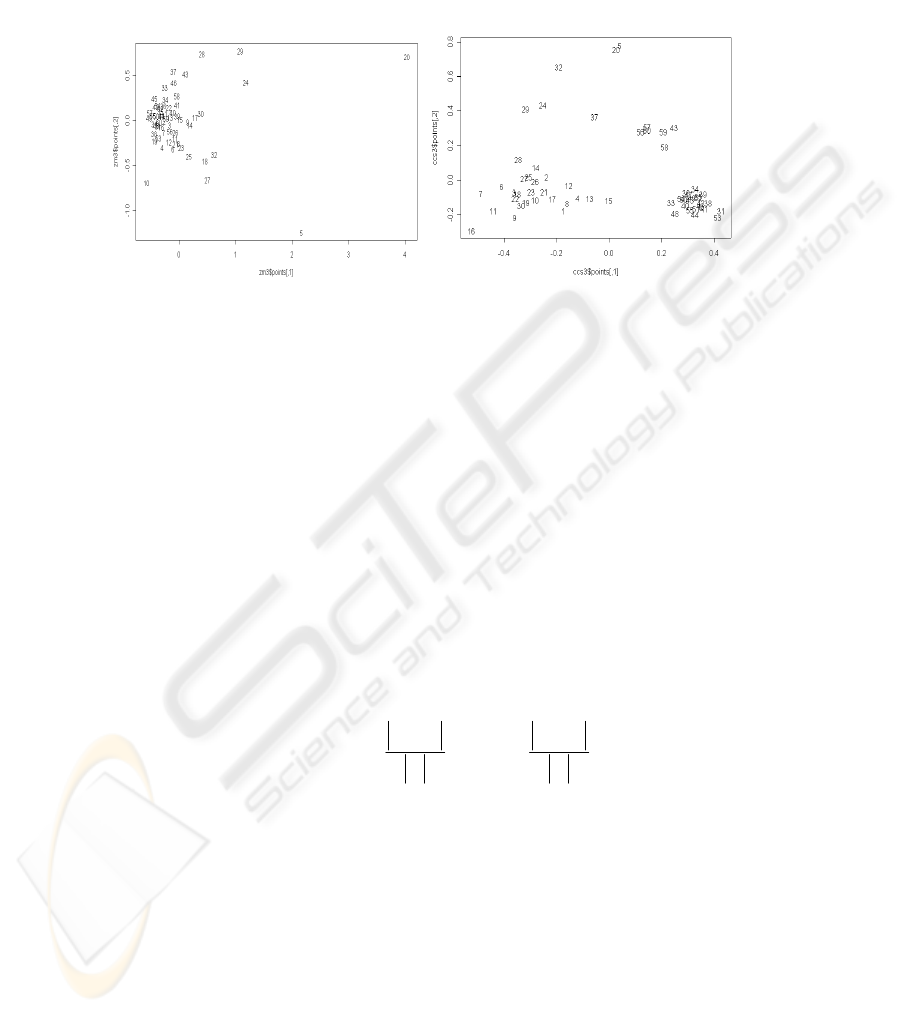
Fig. 5). In order to present a corpus summary we employed a multidimensional
scaling algorithm to represent in a two dimensional plot the dissimilarities between
documents (see Fig. 4). Each document image is described with one of the following
types of features : Zernike moments for the whole image (a vector with 16
components) or the connected components and symbols lists described above. In Fig.
4.a) we present the dissimilarities between images represented by Zernike moments.
In Fig. 4.b) are plotted the dissimilarities between the document images computed
using the cosine correlation presented in section 4. Each image from the corpus has an
170
id from 1 to 60. The engineering maps have identifiers from 1 to 30, electronic images
from 31 to 55, and the arhitectural schemas from 56 to 60. We can see in Fig. 6 that
the bag of symbols representation separate better the image classes. This fact has an
important influence on the quality of the query results.
a.) b.)
Fig. 4. Documents ids presented in a two dimensional space with respect to their reciprocal
dissimilarities
A query can be an image, a list of symbols and connected components, or only one of
the later lists.
()
(
)
....,...,,...,,,,...,,: 2121
21
21
mnjjjiii jjjiiissscccquery mn
≤
≤
≤
≤
(
)
....,,...,,: 21
21
mjjj jjjsssquery m
≤
≤
(
)
....,,...,,: 21
21
niii iiicccquery n
≤
≤
In order to extract the formal description of a given query image we label the
connected components of the query image, construct the graph, and employ graph
matching to detect which symbols occur in the query image. At the end of this process
the query image is described by the two lists of connected components and symbols.
In order to evaluate experimental results we used precision and recall measures. If A
is the set of relevant images for a given query, and B is the set of retrieved images
then :
B
BA
precision
∩
=
,
A
BA
recall
∩
=
171
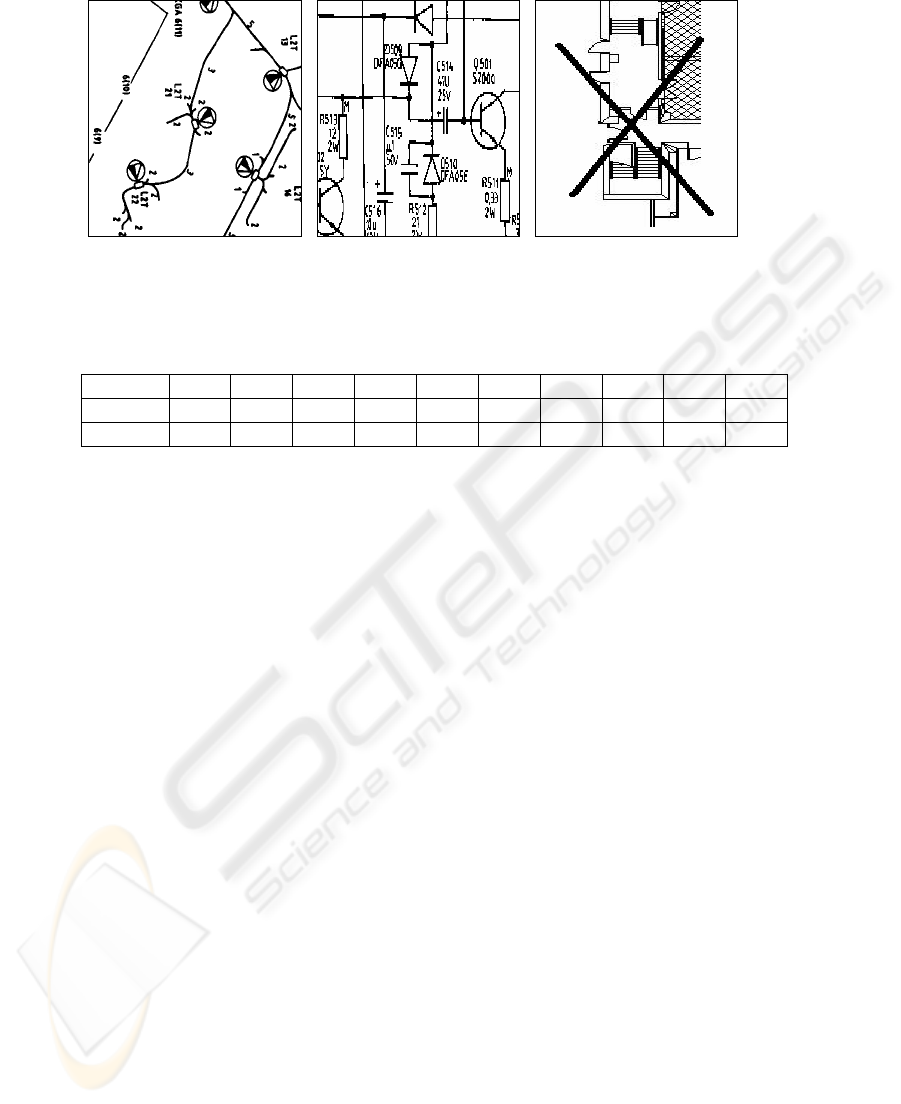
Fig. 5. Corpus images
This corpus contains images that are scanned and contain real and artificial noise.
Table 3. Queries recall and precision
Q1 Q2 Q3 Q4 Q5 Q6 Q7 Q8 Q9 Q10
recall 0.75 0.5 0.48 0.55 0.56 0.76 0.6 0.4 0.32 0.16
precision 0.6 0.31 0.8 0.73 0.87 0.95 0.88 0.5 0.42 0.4
Queries Q1-4 represents symbol queries , i.e. as input is a list of symbols. The
other queries are document images.
6 Conclusions
The research undertaken represents a novel approach for indexing document images.
The approach uses data mining techniques for knowledge extraction. It aims at
finding image parts that occurs frequently in a given corpus. These frequent patterns
are part of the document model and can be put in relation with the domain knowledge.
Using the proposed method we reduce in an unsupervized manner the semantic
gap between a user representation for a document image and the indexation system
representation.
The exposed method can be applied to other graph representations of a document.
In the near future, we will apply this approach to layout structures of textual
document images.
Another follow up activity is to quantify the way noise affects the connected
components labeling, and the manner in which an incorrect number of clusters can
affect the graph mining procedure. Based on this error propagation study we can
ameliorate our method. Other possible improvements can be obtained if we would
employ a graph-based technique that can deal with error tolerant graph matching.
References
1. Antonacopoulos A. Introduction to Document Image Analysis, 1996.
172

2. Nagy G. Twenty years of document analysis in PAMI. IEEE Transactions on Pattern
Analysis and Machine Intelligence, 22:38-62, 2000.
3. Pavlidis, T., Algorithms or Graphics and Image Processing, Computer Science Press, 1982
4. Bagdanov A.D. and M. Worring, "Fine-grained Document Genre Classification Using First
Order Random Graphs", Proc. 6th. Int'l Conf. on Document Analysis and Recognition
(ICDAR 2001),79-90.
5. Washio T., Motoda H., State of the art of graph-based data mining. SIGKDD Explor.
Newsl.vol. 5, no 1,pp. 59-68 ,2003.
6. Fung, B. C. M., Wang, K., & Ester M. Hierarchical Document Clustering Using Frequent
Itemsets. Proceedings of the SIAM International Conference on Data Mining,2003.
7. Termier A., Rousset M., and Sebag M., “Mining XML Data with Frequent Trees”,
DBFusion Workshop’02,pages 87-96,2002.
8. Blostein D., Zanibbi R., Nagy G., and Harrap R., “Document Representations”, GREC
2003
9. Khotazad A., and Hong Y.H., “Invariant Image recognition by Zernike Moments”, IEEE
Transactions on Pattern Analysis and Machine Inteligence, Vol 12, No 5, May 1990
10. Milligan, G. W., Cooper, M.C.: An Examination of Procedures for Determining the
Number of Clusters in a Data Set. Psychometrika, 58(2),(1985)159-179.
11. Gordon A.D. “Classification 2ndEdition”, 1999.
12. L. Kaufmann and P. J. Rousseeuw. Clustering by means of medoids. In Statistical Data
Analysis based on the L 1 Norm and Related Methods, pages 405—416, 1987.
13. Salvatore Tabbone, Laurent Wendling, Karl Tombre, “Matching of graphical symbols in
line-drawing images using angular signature information” Int’l Journal on Document
Analysis and Recognition, Vol. 6, No. 2, 2003, 115-125.
14. Yan, X., Han, J.: “Closegraph: mining closed frequent graph patterns”. In: Proceedings of
the Ninth ACM SIGKDD International Conference on Knowledge Discovery and Data
Mining, ACM Press (2003) 286–295.
15. Seno M., Kuramochi M., and Karypis G., PAFI, A Pattern Finding
Toolkit,http://www.cs.umn.edu/~karypis, 2003.
16. Dumais, S.T. , Improving the retrieval information from external resources, Behaviour
Research Methods, Instruments and Computers, Vol. 23, No. 2, pp. 229-236, 1991.
173

174
