
Car License Plate Extraction from Video Stream in
Complex Environment
Giorgio Grasso, Giuseppe Santagati
Facoltà di Scienze,
Università degli Studi di Messina,
Salita Sperone, Messina, Italy
Abstract. Th
e recognition of car license plates has a variety of applications
ranging from surveillance, to access and traffic control, to law enforcement.
Today a number of algorithms have been developed to extract car license plate
numbers from imaging data. In general there two class of systems, one
operating on triggered high speed cameras, employed in speed limit
enforcement, and one based on video cameras mainly used in various
surveillance systems (car-park access, gate monitoring, etc). A complete
automatic plate recognition system, consists of two main processing phases: the
extraction of the plate region from the full image; optical character recognition
(OCR) to identify the license plate number. This paper focuses on dynamic
multi-method image analysis for the extraction of car license plate regions,
from live video streams. Three algorithms have been deviced, implemented and
tested on city roads, to automatically extract sub-images containing car plates
only. The first criterion is based on the ratio between the height and width of
the plate, which has, for each type of plate, a standard value; the second
criterion is based on the eccentricity of the image on the two dimensions, i.e.
the projection histogram of plate number pixels onto the reference axes of the
image; the third criterion is based on the intensity histogram of the image. For
each criterion a likelihood is defined, which reaches its maximum when the
tested sub-image is close to the standard value for the type of plate considered.
The tuning of the methods has been carried on several video streams taken
during travel on busy city roads. The results for the overall recognition rate on
single frames is around 65%, whereas the multi-frame recognition rate is
around 85%. The significant value for the performance of the method is the
latter, as typically a license plate is visible in 5-10 frames. Based on three
parameters ranking, the same system can potentially distinguish and identify a
wide range of license plate types.
1 Introduction
Car license plate automatic recognition has an ever-increasing importance in many
fields of application. Law enforcement has gained greatly from the availability of
systems able to detect autonomously suspicious car plate numbers. There are also a
large number of examples in surveillance, for premises monitoring, gate access
control, car parking automatic management, etc. Differently from usual optical
Grasso G. and Santagati G. (2005).
Car License Plate Extraction from Video Stream in Complex Environment.
In Proceedings of the 5th International Workshop on Pattern Recognition in Information Systems, pages 73-80
DOI: 10.5220/0002565600730080
Copyright
c
SciTePress

character recognition (OCR) applications (e.g. documents archiving, postal code
reading, etc), which occur in controlled environments and lighting conditions, the
recognition of car plates is generally applied to imaging data collected in highly
complex sceneries [1,2]. In general such a system has to operate day and night, with
varying visibility conditions, analyzing images containing a large number of
unwanted objects of different nature (e.g. buildings, traffic signs, people, etc). In
addition the scene to be analyzed may contain more than one car [1,3,5].
The most important phase of car plate recognition is the extraction of the plate
region from the full scene frames. Subsequently OCR is applied, being this
technology in a mature state and quite reliable. Of course the reliability of OCR
algorithms rely on good quality images, not containing noise coming from unwanted
information [4].
This paper reports a novel car plate extraction method, based on three independent
feature matching criteria. In order to tackle the problem three parameters have been
identified as representative of a particular license plate type: the ratio between height
and width of the plate; the number of rows and columns where the characters are
located; the ratio between the plate number area and the plate background area. The
standard values of all the three features, defined for each car plate type, are compared
with the values computed for each sub-image analyzed, to construct a likelihood
ranking. The ranking gives an indication of how likely it is that a sub-image contains
a car plate and only a car plate of a particular type (e.g. national, foreign, front or
back, etc).
Experiments have been conducted on 34.5 minutes of video streams, recorded on
high traffic city roads. The data has been divided into two subsets, one used for
training of the system, the second one for testing. A total of 25 car plates have been
considered for training and a total of 40 car plates have been used during the
performance tests. Video streams where recorded on a standard digital camcorder,
with full PAL resolution at framerate, using MPEG2 compression.
The developed system can recognize car plates in a variety of lighting conditions
and a broad range of sub-image sizes, starting from 70x20 pixels (corresponding to
less than 2% of the frame area).
2 Image Segmentation
The car plate recognition process requires a first step of image segmentation, to
extract homogeneous regions within single frames. This is a necessary phase that
partitions the acquired image into several sub-images, to be taken into account as
candidate car plates.
In this paper a gradient based segmentation algorithm has been employed, which
uses the Canny [6] method to extract edges from imaging data. A thresholding
procedure is then used to remove dark areas of the image, given that plates show
usually high values of intensity. This process results in a binary image where white
pixels are the ones corresponding to brighter areas in the original frame. After
thresholding and edge extraction a seeded region growing (SRG) [7] strategy is used
to identify uniform image areas. A typical result of a complete segmentation for a
frame captured during experiments is shown in Fig. 1. The top left image (a) shows
74
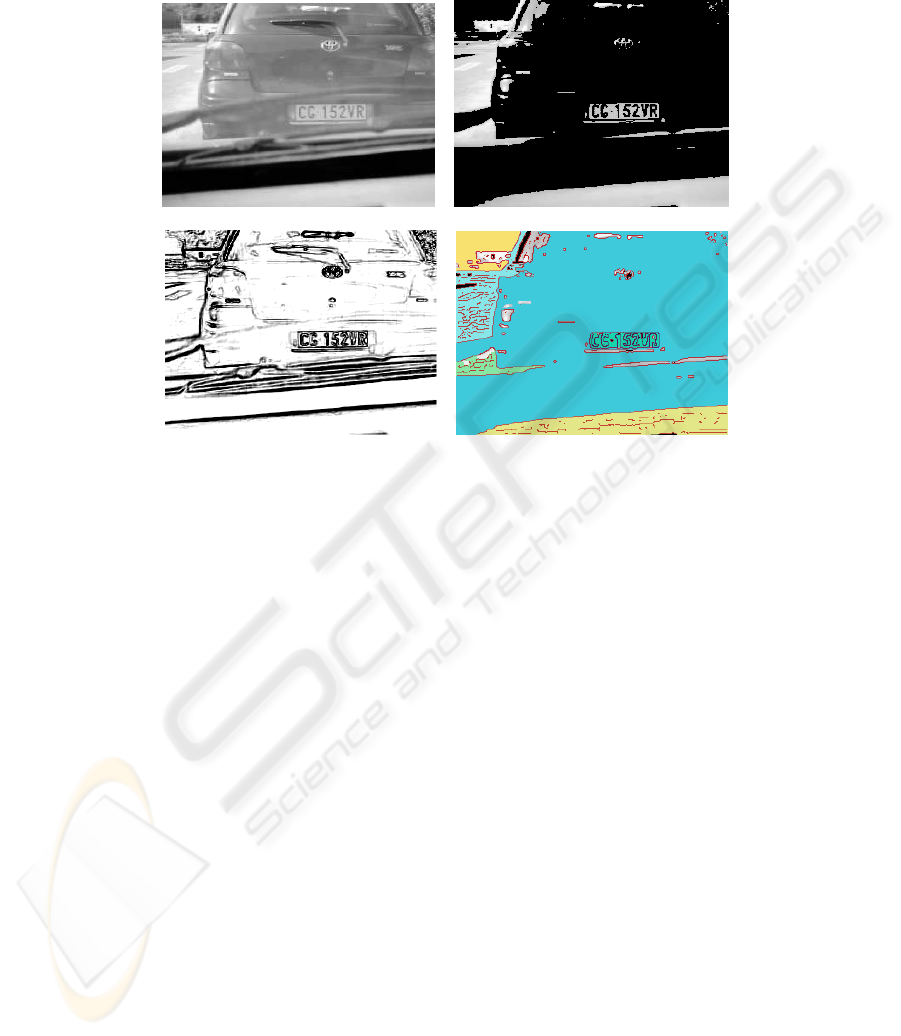
the original data, the top right image (b) the threshold result, the bottom left image the
edge detection output (c), the bottom right image (d) the segmentation result.
(a) (b)
(c) (d)
Figure 1. Example of image segmentation. Top left original image (a); top right thresholded
image (b); bottom left edge detection result (c); bottom right segmentation output (d).
Once the image frame is segmented into homogeneous regions - solid colors in Fig
1. (d) - the subsequent feature extraction procedure starts, to identify amongst
candidate areas of the image, the ones corresponding to car license plates. A detail of
the feature recognition strategies is reported in the following section.
3 Feature Extraction
The second step towards the definition of a car plate type is to identify univocal
features representing it. What is known about car plates is that they have a rectangular
shape, they contain a certain number of characters with a specified font and size,
distributed over a fixed number of rows and columns. The above features constitute a
reliable indication of a specific car license plate type, exception made for customized
car plates. An additional feature useful for identification is the background/foreground
colors, which is some cases can be different from white/black.
Starting from the above definition of what constitutes a car plate, three identifying
features have been defined: the ratio between height and width of a plate; the number
of rows and columns over which the plate digits distribute, which are described by the
projection eccentricity; the ratio between the areas covered in the plate by digits and
the area of background, defined through the intensity histogram.
75

A brief description of the methods used to implement the feature extraction for the
three criteria above mentioned is reported in the following.
Aspect ratio
Given a particular type of car plate, to be identified, its height and width are
measured and their ratio is computed to give a dimensionless characteristic number.
The absolute value of the difference between the height/width ratio measured on each
sub-image, and the characteristic number is defined as
∆
R. From all
∆
R measured on
the training set of images, a maximum value is obtained
∆
R
max
. A parameter is then
defined that gives a measure of how close to the actual value the aspect ratio of each
sub-image is, with respect to a specific plate type:
D
a
= 1 -
∆
R /
∆
R
max
Digit distribution
A second identifying feature is the location of characters included in the car plate.
Two integer numbers can be defined as the number of rows Nr and the number of
columns Nc over which characters align in the plate. In our case all digits and letters
spread across a single row and 7 columns, giving the following values for Nr = 1, Nc
= 7 (see Fig. 2). Using the eccentricity projection of digit pixels, an histogram can be
constructed, where peaks correspond to individual characters and valleys correspond
to the separation between adjacent characters. To obtain Nr
and
Nc
the eccentricity
histograms have to be processed and the number of peaks and valleys extracted. For
this purpose a threshold value is applied to the smoothed histograms, as a fraction of
the average value of each histogram, this to construct a binary vector. Then the
number of transitions from zero to one in the binary vector is counted.
∆
∆
Figure 2. Italian license plate example, with its eccentricity histograms reported in the x, y
axes.
Once Nr
and
Nc are computed for a sub-image, they are compared to the actual
values for the specific car plate type considered, and the absolute value of the
differences ∆Nr and ∆Nc extracted. From the training set of data, the maximum
values of these quantities are derived, ∆Nr
max
and ∆Nc
max
. Two parameters can be
defined, giving a measure of how close to the actual case the distribution of characters
in a given sub-image is:
D
r
= 1 - ∆Nr / ∆Nr
max
76

D
c
= 1 - ∆Nc / ∆Nc
max
Coverage ratio
Given a particular license plate type, which corresponds to a fixed background
color and a distribution of digits with specific font type and size, the coverage ratio of
is confined in a fixed range. In order to account for variations of the coverage related
to varying character sequences and to allow for noisy data, a characteristic intensity
histogram can be constructed from experimental training data.
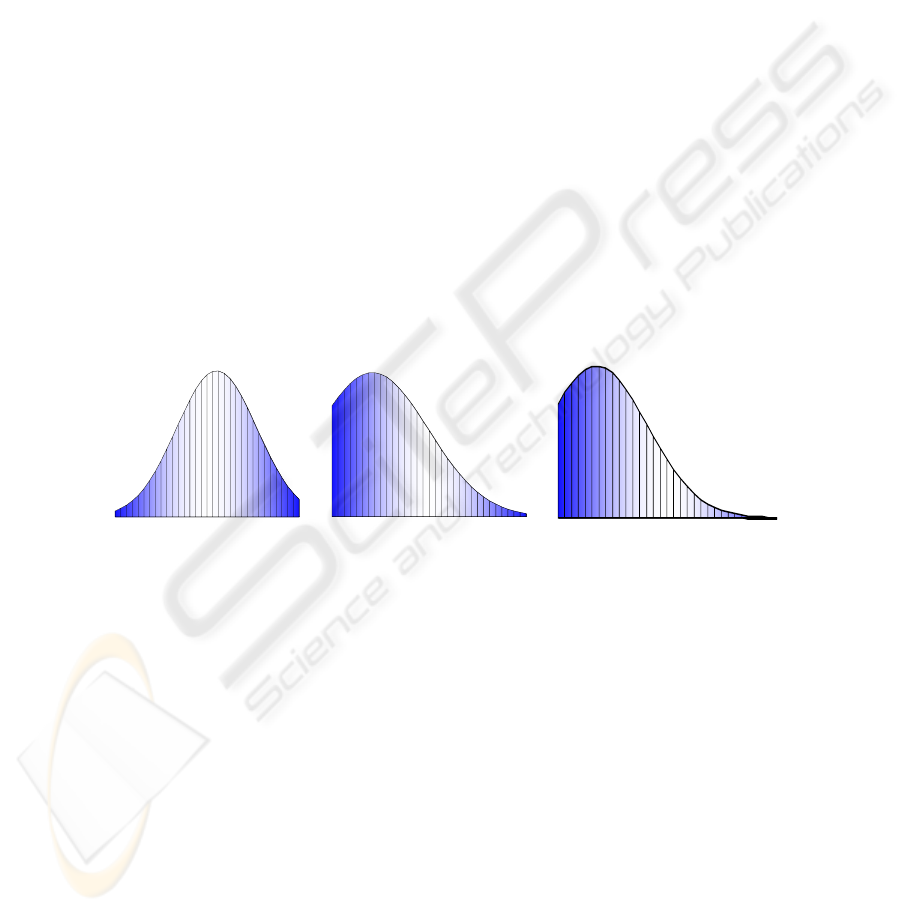
This characteristic histogram is a representation of the “average” value for the
coverage ratio. To construct such an average histogram the sub-images containing
license plates are extracted manually from the data and their histograms computed.
The result of averaging over all 25 sample license plate is shown in Fig. 3. It is
noticeable as the histogram shows a broad distribution of dark pixels, present in lower
number, and a more peaked bright pixel distribution, corresponding to the plate
background.
From the analysis of the histogram shape it is evident that the two pixel classes are
present in the images, digits and background, which spread over a rather wide range
of intensities. This is mainly due to the changing environmental conditions during
experiments and data acquisition noise.
Figure 3. Average intensity histogram computed on experimental sample Italian license plate
images.
The intensity histogram for a single plate candidate sub-image is derived, stretched
to cover the dynamic range of the average histogram (see above), with which is then
compared. From the comparison a metric distance is extracted as the sum of the
absolute value of the differences computed over all intensities, to obtain the coverage
ratio difference
∆
CR. The maximum value of
∆
CR is computed on the training set of
data giving
∆
CR
max
. A parameter can then be defined, which gives a measure of how
close to the actual scenario the coverage of characters with respect to the background
of a candidate plate sub-image is:
D
cr
= 1 -
∆
CR
max
/
∆
CR
max
77
4 Classification Methods
The recognition process starts from the segmented image as input and proceeds to
compute the features of each sub-image identified, in order to compare them with the
standard values defined for a specific car plate type.
Each of the four parameters defined in the previous section, D
a
,
D
r
,
D
c
and D
cr
has values ranging from zero to one. The latter corresponding to the perfect
correspondence of the analyzed sub-image to the specific plate type considered.
Once the four feature values for a sub-image are extracted they have to be turned
into homogeneous parameters and combined into a single recognition score. To
achieve this the training car plate set is analyzed to construct statistical distributions
of each feature.
The distribution widths are used to define the weight of each feature in the
combined recognition score. When data distribute over a wide range it means that the
corresponding feature has a low discriminating capability, thus it should not
contribute substantially to the recognition process.
In the present case, however, all the feature normalized distributions show
comparable widths and they are, as a consequence, all significant in the recognition
process. For the case of Italian license plates the parameter D
r
has been neglected
because of the single row digit distribution characterizing the standard plate.
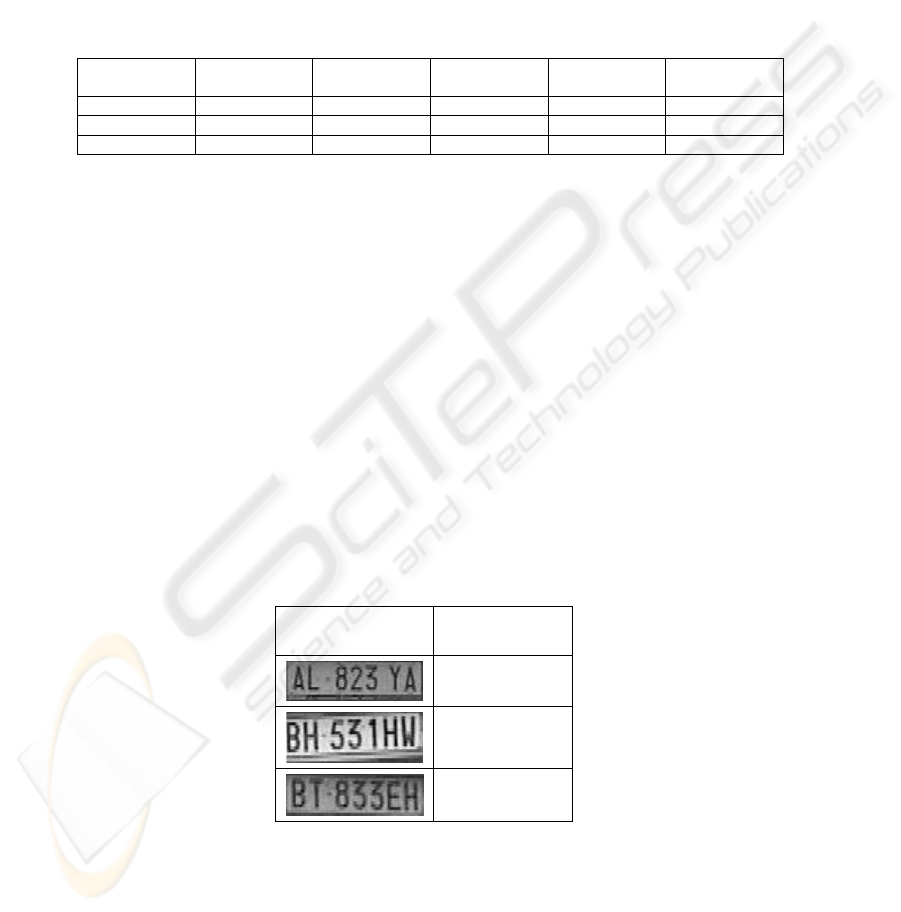
Data are shown in Fig. 4 for the training set used during the calibration of the
system. Fig. 4 refers to the aspect ratio D
a
distribution (a), digit distribution on
columns D
c
(b), coverage ratio D
cr
(c).
(a) (b) (c)
Figure 4. Distributions of values for the three features used in the recognition process (see
text).
From the training set of images and the above distributions, with mean and
variance reported in Table 1, the following formula is defined for the recognition
score R:
R =
α
D
a
+
β
D
r
+
γ
D
c
+
δ
D
cr
with
α
+
β
+
γ
+
δ = 1
78
5 Experimental results
Apart from the training set a total of 34.5 min of video streams have been analyzed.
From this data 2362 single sub-images have been extracted, according to the
procedure described in section 2. All sub-images have been processed according to
the algorithm presented in sections 3 and 4, giving an overall recognition performance
of 65% on single frames and of 85% on sequences of 5 frames. In Table 1 a summary
of the experimental results are presented.
Table 1. Results of the plate classification experiments.
Video stream Environmental
conditions
# of actual
plates
Average # of
frames/plate
Recog. rate on
single frame
Recog. rate on
sequences
movie1.avi daylight 13 54 72% 90%
movie2.avi daylight 16 48 74% 91%
movie3.avi night 11 49 54% 65%
The lower performance of the algorithm, observed in data collected at night, is due
both to the lower visibility of the car plates and to the slow and noisy response of the
camera.
The values for the weights of the feature parameters in defined section 4 have
been, for the experiments conducted on the collected video streams, of α = 0.07, β =
0, γ = 0.75 and δ = 0.18. The parameter β has value zero because the car license plate
type analyzed has only one row of characters, thus it does not have a relevant
influence on the recognition process.
The obtain the final classification the recognition score R parameter has been
thresholded to 0.5 – i.e. all sub-images with a computed value of R higher than 0.5 are
considered car plate images. This is consistent with the assumption that the parameter
R is an indirect measure of the probability that a sub-image represents a car plate. In
this view when the value of R is higher the ½, there more than 50% chance that the
sub-image is the one containing only the car plate.
Table 2 shows some examples of recognized car license plates, together with the
corresponding values of recognition score R.
Table 2. Example recognized car license plates
License plate sub-
image
R
0.68
0.52
0.54
79

6 Conclusion
This paper describes a novel method for car license plate automatic extraction from
video streams. Experiments were presented for a set of 34.5 min of video data,
showing a good performance for the recognition of car plate locations within outdoor
sceneries. The algorithm allows the analysis of both single frames and sequences, the
latter giving a greatly improved performance. This is extremely useful for a great deal
of applications of the method, where single plate are visible in sequences of
successive video frames.
The system can be trained to recognize a variety of plate types, and can be
extended to do multi-type recognition, through a ranking procedure on the single
recognition parameter defined R.
Another possible extension of the method, able to track plates on image sequences,
is in the field of motion dynamics, extremely useful, for example, in speed limit
enforcement applications.
Though preliminary, the results shown here are promising for the definition of a
robust method for car plate recognition.
References
1. Mi-Ae K., Young-Mo K.: License Plate Surveillance System Using Weighted
Template Matching. 32nd Applied Image Pattern Recognition Workshop, Image Data
Fusion, Washington, DC, USA (2003) 269-274
2. Choudhury A. Rahman, Wael M. Badawy, Ahmad Radmanesh: A Real Time
Vehicle's License Plate Recognition System. IEEE Conference on Advanced Video
and Signal Based Surveillance, Miami, FL, (2003)
3. Kwang-Baek K., Si-Woong J., Cheol-Ki K.: Recognition of Car License Plate by
Using Dynamical Thresholding Method and Enhanced Neural Networks. Computer
Analysis of Images and Patterns, 10th International Conference, Groningen, The
Netherlands, (2003) 309-319
4. Yuntao C., Qian H.: Extracting characters of license plates from video sequences.
Mach. Vis. Appl. 10(5/6) (1998) 308-320
5. Eun Ryung Lee, Pyeoung Kee Kim, Hang Joon Kim: Automatic Recognition of a Car
License Plate using Color Image Processing. International Conference on Image
Processing, Austin, Texas, USA (1994) 301-305
6. Canny J.: A Computational Approach to Edge Detection. IEEE Transactions on
Pattern Analysis and Machine Intelligence, 8(6) (1986)
7. Adams, R., Bischof, L.: Seeded region growing. IEEE Trans. On PAMI, 16(6) (1994)
641-647
80
