
Distinction of Patterns within Time-Series Data Using
Constellation Graphs
Mayumi Oyama-Higa
1
, Michihiko Setogawa
2
and Teijun Miao
3
1
Department of Integrated Psychological Science, Kwansei Gakuin University
1-1-155, Ichibancho,Uegahara, Nishinomiya-City,662-8501, Japan
2
Research & Development Center, Hitachi Systems & Services, Ltd.
10-70, 2-Chome, Nanbanaka, Naniwa-ku, Osaka, 556-0011, Japan
3
Chaos Technical Research Laboratory and CCI Incorporation
3-1-2401, Ryodocho, Nishinomiya-City, 662-0841, Japan
Abstract. Constellation graphs for time-series data are very
effective tool for
displaying a physio-psychological index. In this study, we recorded fingertip
pulse waves of elderly subjects, carried out chaos analysis on the plethys-
mogram data thus obtained, and examined their relationship with dementia. We
discovered the Lyapunov exponent of the time series had a clear relationship
with the severity of dementia and the communication skill of the elderly sub-
jects. We could clearly demonstrate a relationship between dementia and the
Lyapunov exponents using constellation graphs of the time series data.
1 Introduction
Measuring fingertip pulse waves, which are biomedical signals, is easier than electro-
encephalography because it is less restrictive and more convenient. In this study, we
conducted experiments to examine whether senile and other types of dementia have
any relationship with the fingertip pulse waves. The study subjects were residents of
an elder care home and persons receiving day-care at the same facility. The fingertip
pulse waves of each subject were measured and chaos analysis was carried out to
obtain three minutes of time series data. The chaos attractor, entropy, and the largest
Lyapunov exponent were calculated as time series data. In order to obtain the criteria
for estimating the subjects’ quality of life and severity of dementia, we gathered data
on the activities of daily living (ADL) measured by the subjects’ caregivers and on
criteria of different levels of dementia severity. The relationship between the ADL
indices and the results of the chaos analysis and the severity of dementia was ana-
lyzed. We discovered that the mean value and standard deviation of the largest
Lyapunov exponent of the time series had a clear relationship with the severity of
dementia and the communication skill of the elderly subjects. We also examined the
relationship between dementia and communication skills and could clearly demon-
Oyama-Higa M., Setogawa M. and Miao T. (2005).
Distinction of Patterns within Time-Series Data Using Constellation Graphs.
In Proceedings of the 5th International Workshop on Pattern Recognition in Information Systems, pages 192-197
DOI: 10.5220/0002559301920197
Copyright
c
SciTePress

strate a relationship between dementia and the largest Lyapunov exponents using
constellation graphs of the time series data.
2 Data analyzed
Informed consent was obtained from both the subjects’ care home and their families.
There were 179 subjects (139 females and 40 males), who ranged in age from 65 to
100 years (mean 83.4). Measurements were made between August and November
2003. The temperature, systolic blood pressure, diastolic blood pressure, and pulse
rate were measured before recording the plethysmograms.
3 Measuring fingertip pulse waves and analyzing plethysmograms
3.1 Method of measurement
The pulse waves were measured using a photoplethysmography sensor (CCI
BC2000) using the following procedure. We gave the subjects at least 10 minutes
each, to become accustomed to the surroundings in a room maintained at 25°C. They
were allowed to sit comfortably in a chair with both hands placed in a relaxed manner
on a desk (at a height that was comfortable for writing). The subjects kept their eyes
open while the measurements were made on the left index finger for 180 seconds.
The signals were A/D converted. Digital data sampled at a frequency of 200 Hz and a
resolution of 12 bits were fed to a PC.
3.2 Method of chaos analysis
For the time series data x(i), with i=1,…, N obtained from the fingertip pulse waves,
the phase space was reconstructed using the method of delays. Assuming that we
create a d-dimensional phase space using a constant delay τ, the vectors in the space
are generated as d-tuples from the time series and are given by:
)}({)))1((),...,(()( ixdixixi
k
=
−
−
=
τ
X
(1)
where x
k
(i) = x(i –(k – 1)τ), with k=1,...,d. In order to correctly reconstruct the phase
space, the parameters of delay, τ, and embedding dimensions d should be chosen
optimally [4]. In time series recorded from human finger photoplethysmograms, we
chose the parameters τ =50 ms and d=4, as in references [1] and [2].
In the reconstructed phase space, one of the important measures of complexity is the
largest Lyapunov exponent λ
1
. Considering X(t) is the evolution with time of some
initial trajectory X(0) in the phase space, it is given by
||
|)(|
ln
1
limlim
0
1
ε
δ
λ
ε
ε
t
t
t
X
→∞→
=
(2)
193

where
)()()( ttt
εε
δ
XXX −=
)0()0(
ε
ε
XX −=
for almost all initial difference vectors ε = X(0) – X
ε
(0). We estimated λ
1
using the
algorithm of Sano and Sawada [3]. λ
1
describes the divergence and instability of the
orbits in the phase space.
The largest Lyapunov exponents, λ
1
, were calculated for a basic window of 8,000
points (40 sec). The 180 sec (36,000 points) were covered by sequentially sliding,
200 points (1 sec) at a time and λ
1
was determined for each window.
4 Activities of daily living (ADL) and dementia level data of the
elderly subjects
Data recorded by the persons caring for the subjects in the care home was used as the
ADL data. The dementia data used were those recorded by healthcare professionals.
For the ADL, each activity of daily living, such as walking, eating, toileting, bathing,
dressing, and grooming was assigned to one of three care dependence categories: a)
can do independently although it takes a long time; b) needs some assistance; and c)
totally dependent on assistance. Each subject’s communication skill was also as-
signed to one of the three levels: a) can communicate normally; b) can communicate
to some extent; and c) can hardly communicate.
Data on dementia obtained from the healthcare professionals were categorized into
the five grades of dementia: 0: none, 1: mild, 2: moderate, 3: severe, and 4: very se-
vere.
5 Pulse wave parameters and analysis of ADL indices and severity
of dementia
We examined whether the values of the largest Lyapunov exponent (group means and
standard deviations) had any significant correlation with each of the factors—sex,
age, body temperature, systolic blood pressure, diastolic blood pressure, pulse rate,
walking, eating, toileting, bathing, dressing, grooming, communication skill, and
severity of dementia—in order to examine the relationship between the ADL indices
and dementia with the pulse wave data.
We found that only communication skill and the severity of dementia were signifi-
cantly correlated with the mean and standard deviation of the Lyapunov exponent.
Figs. 1 and 2 show the relationship of these factors with mean and standard deviation
of the Lyapunov exponent, respectively.
The Lyapunov exponent is a measure of the divergence of the attractor trajectory. It
became clear from the above results that communication skill and dementia were
related to the deviation of the Lyapunov exponent and that elderly persons who could
194
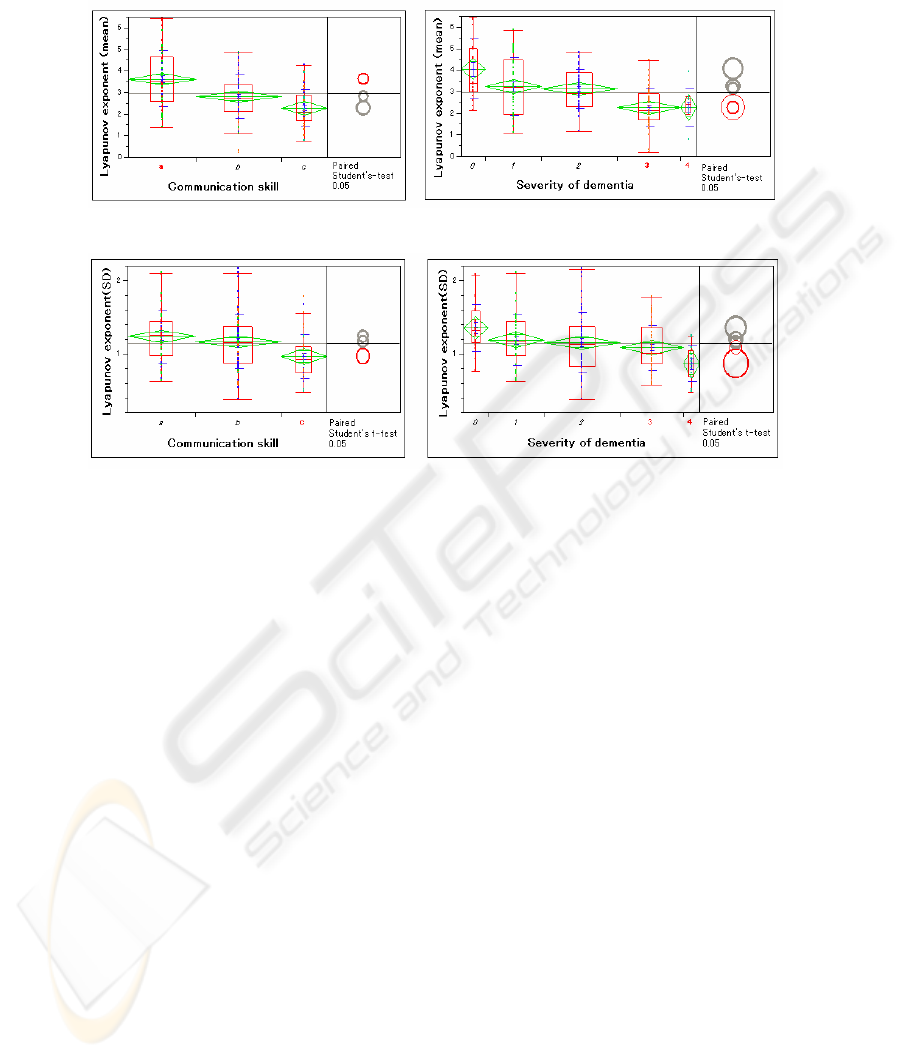
not communicate well had less deviation of the exponent compared with those who
could communicate well. We observed similar relationships with dementia.
Fig. 1. Relationship of the mean Lyapunov exponent with communication skill and dementia
Fig. 2. Relationship between the standard deviation of the Lyapunov exponent with communi-
cation skill and dementia
6 Representation of dementia in a constellation graph
If we could represent the changes in the Lyapunov exponent obtained by sliding
within the 180-second time interval visually, it would be possible to measure the
changes in the severity of dementia easily.
We realized such a visual representation by preparing constellation graphs[5]. In
these constellation graphs, the numerical data of a time series were converted into
angles between 0 and 180°, and the vectors of the same length were joined and de-
picted on a semicircular graph. The maximum and minimum values were set auto-
matically from the values of the Lyapunov exponent. Each line represents the data for
one subject. The smaller the Lyapunov exponent, the closer the vector is to the bot-
tom right of the constellation graph. As the value of the Lyapunov exponent in-
creases, the line moves to the left in the graph. The line is straighter when the stan-
dard deviation is small, and is bent more when it is large.
Figure 3 shows the relationship between dementia and the Lyapunov exponents ob-
tained from the analysis. The five levels of dementia are shown in different colors.
Subjects with more severe dementia have their lines more to the right side of the
graph. The subjects in the five different dementia categories were sorted according to
severity and five subjects around the median value were selected from each category
195
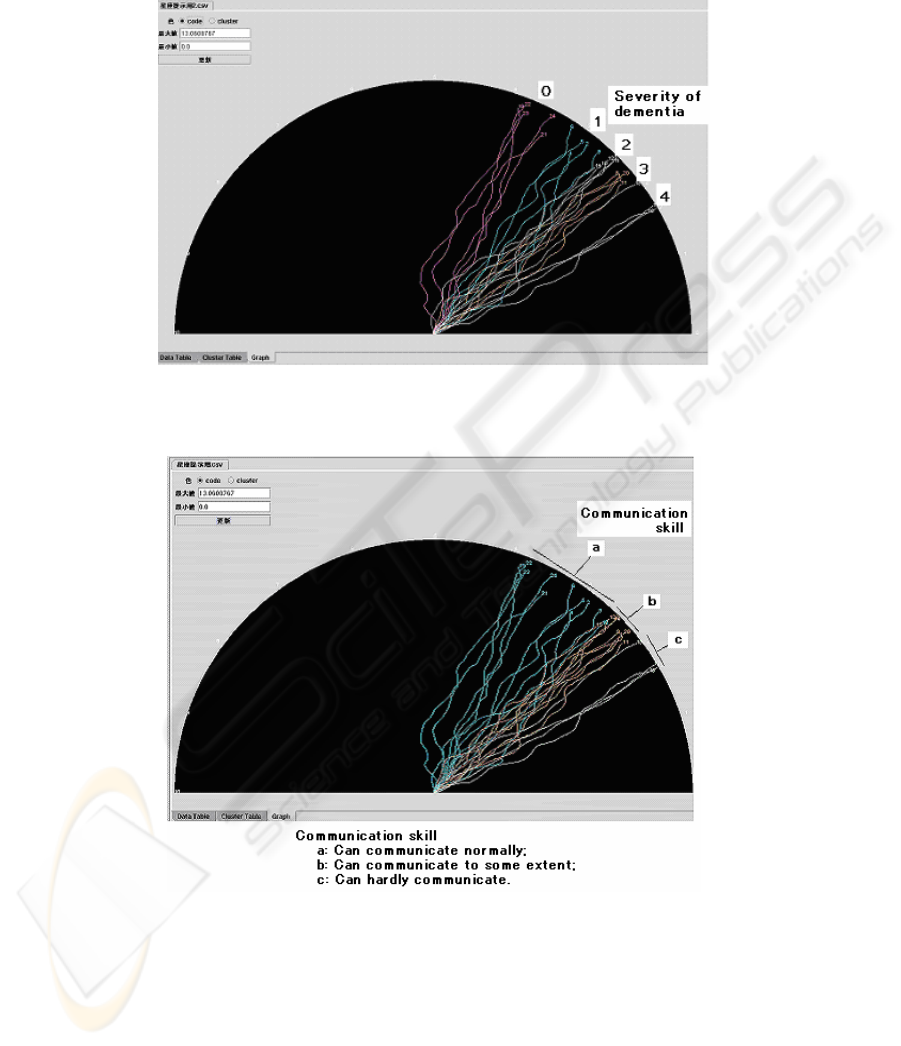
to prepare this graph. Fig. 4 is similar to Fig. 3, but shows the relationship between
communication skill and the Lyapunov exponent.
Fig. 3. The relationship between the severity of dementia and the Lyapunov exponents of the
time series (each line represents one subject)
Fig. 4. The relationship between communication skill and the Lyapunov exponents of the time
series
196

7 Conclusion
The traditional view of homeostasis has been that when certain factors disturb vital
signs, such as the pulse rate, respiration rate, blood pressure, and temperature, that are
directly related to the maintenance of life, and push them outside the normal range,
corrective feedback is activated to stabilize them, and stable values of these signs
indicate the proper functioning of the control mechanisms of the living body. How-
ever, even when a healthy subject is placed at bed rest, the heart beat interval fluctu-
ates irregularly. Respiration rate, blood pressure, and body temperature act similarly.
In fact, the fluctuations of the heart rate are less prominent in elderly persons and sick
persons.
In this study, changes in vital signs caused by aging were measured through finger-
tip pulse waves, represented as constellation graphs, and verified. We demonstrated
that the Lyapunov exponent was related to dementia in elderly persons. Our research
showed that the decrease in the divergence of the Lyapunov exponent in subjects with
advanced senile dementia was similar to that observed in persons with depressive
psychosis. We plan to advance this study further by obtaining detailed data on the
changes in divergence during the time when a newborn infant becomes a young child
and in patients with mental diseases, like depressive psychosis.
Acknowledgments
We thank the staff of the elder care home, Associate Professor Hirohashi of Seisen
University, and Dr. Junko Tsujino and the students of the Oyama Laboratory of
Kwansai Gakuin University for their help and cooperation in collecting data and
taking measurements from our elderly subjects.
References
1. Tsuda I, Tahara T, Iwanaga I : Chaotic pulsation in capillary vessels and its dependence on
mental and physical conditions. Int J Bifurcation and Chaos 2: (1992)313-324.
2. Sumida T, Arimitu Y, Tahara T, Iwanaga H :Mental conditions reflected by the chaos of
pulsation in capillary vessels. Int J Bifurcation and Chaos 10: (2000) 2245-2255.
3. Sano M and Sawada Y : Measurement of the Lyapunov spectrum from a chaotic time series.
Phys. Rev. Lett. 55: (1985)1082.
4. Abarbanel HDI, Brown R, Sidorowich JJ, Tsimring LS: The analysis of observed chaotic
data in physical systems. Rev Mod Phys 1993, 65: 1331-1392.
5.Tokihiko Niwa, Kenji Fujikawa, Yoshikazu,Tanaka, Mayumi Oyama: Visual Data Mining
Using a Constellation Graph.ECML/PKDD-2001,Freiburg
197
