
DEVELOPING OF MULTISTAGE VIRTUAL SHARED MEMORY
MODEL FOR CLUSTER BASED PARALLEL SYSTEMS
Aye Aye Nwe, Khin Mar Soe, Than Nwe Aung
University of Computer Studies, Yangon, Myanmar
Thinn Thu Naing, Myint Kyi, Pyke Tin
University of Computer Studies, Yangon, Myanmar
Keywords: Multistage Virtual shared memory (MVSM), Cluster Based Parall
el System, Analytical model, Queuing
theory, Jackson queuing network.
Abstract: In this paper, we proposed a new multistage virtual shared memory model for cluster based parallel systems.
This model can be expanded in hierarchical manner and covered many of the previous clusters of parallel
system designs. Queuing theory and Jackson queuing networks are applied for constructing an analytical
model. This model gives a closed-form solution for the system performance metrics, such as processor
waiting time and system processing power. In development of this analytical model we used open queuing
network rules for analyzing a closed queuing network and calculate the input rate of each service centre as a
function of the input rate for previous service centre. The model can be used for evaluating the cluster based
parallel processing systems or optimizing its specification on design space.
1 INTRODUCTION
Cluster of workstations or symmetric
multiprocessors (SMPs) are potentially powerful
platforms for executing parallel applications (Buyya
, 1995). To simplify the programming of such
clusters, researchers have developed a number of
Virtual Shared Memory systems (VSMs) that
support a virtual shared address space across the
cluster through a layer of software (Li, 1989). The
main problem for constructing a scalable VSM
system is conflict over the common resources. The
limited service capacities of these common
resources cause an increase in the waiting time of
the processors when the number of the processor
increases. Using more powerful common resources
are the conventional method for decreasing the
waiting times, but the capacity of servicing of the
resources such as effective memory access time and
the interconnection network bandwidth is saturated
by the technology and their architectures. This
problem would be more important in parallel
processing systems that utilized a large number of
processors.
In this paper, we develop multistage VSM model
(M
VSM) to overcome above problems. In the
propose architecture, processors are divided into the
cluster groups, and organized in several stages. The
MVSM is expandable in hierarchical manner, and is
so flexible that it covers many of the previous
clusters of parallel system designs.
In the next section, architecture of MVSM
syste
m is discussed. An analytical model is
constructed in section 3 and on base of analytical
model, the performance graphs of the system are
depicted in section 4. Conclusion is presented in the
last section.
2 MVSM CLUSTER
ARCHITECTURE
The basic MVSM system is composed of three
modules: client, provider and VSM manager. A
node that sends the user’s computation requests is
called a client. The client simply submits all requests
to a VSM manager.
263
Aye Nwe A., Mar Soe K., Nwe Aung T., Thu Naing T., Kyi M. and Tin P. (2005).
DEVELOPING OF MULTISTAGE VIRTUAL SHARED MEMORY MODEL FOR CLUSTER BASED PARALLEL SYSTEMS.
In Proceedings of the Seventh International Conference on Enterprise Information Systems, pages 263-266
DOI: 10.5220/0002554702630266
Copyright
c
SciTePress
The manager is responsible for handling requests
from clients and invokes computation threads on
each provider. The provider is invoked by the VSM
manager and then mutually establishes connections
with the client node.
Forward link (FL) is used to transmit remote
request from client to the manager and backward
link (BL) is used for the invocation request of the
VSM manager to the service provider.
The VSM cluster can be expanded in two ways:
increasing the number local cluster nodes (CNs) in
each stage, or using several clusters with one
additional manager that is shared by those clusters.
The unit that are located inside the basic clusters
are indicated by index 1 (M
1p
, PC
1p
, F
1p
, B
1p
) and the
units that are located outside of the cluster are
indicated by index 2 (M
2q
, PC
2q
, F
2q
, B
2q
).
In this system, if the number of PCs that make a
cluster will be equal for all clusters in all stage, the
system is called homogenous and if it will not be
equal at least in one stage, it will be called
heterogeneous. In next section, the homogeneous
MVSM system will be discussed and analyzed.
3 ANALYTICAL MODELING
Queuing theory and Jackson queuing network
(Cooper,1981)are applied to evaluate the
performance of the system. During job execution, it
needs to communicate with the other jobs.
Therefore, several queues would be constructed for
each service centre. We assume the following
assumptions to analyze MVSM model:
1. The no. of PCs in i
th
stage of system is C
i
and the
no. of nodes in each basic cluster is C
0
.
2. The inter job communication requests are
generated independently by processors.
3. The destination of each request will be uniformly
distributed and probability to local PCs in i
th
stage indicated by P
i
.
4. Both of intra-cluster and inter-cluster
communication are uniformly random.
5. Each node generates requests at rate .
6. Service rate for FL and BL are and .
7. Service rate for VSM manager and each service
provider are and .
8. Conflict over the service centre will be resolved
by queuing centre with FCFS discipline.
9. The clients must wait until they offer service as
per the above scheme; and during waiting period,
they cannot generate any other requests.
The input rate of each stage must be computed to
analyze this system. Any service centre assumed as
M/M/1 queuing centre.
We derive the input rate of each service centre as
a function of the input rate for the previous service
centre. By investigating the situation of the request
of each client, we can reach the state diagram.
λ
bi
µ
fi
µ
li
µ
mi
µ
....
....
LM
1
LM
2
LM
3
LM
4
LM
C0
P
C0
P
4
P
3
P
2
P
1
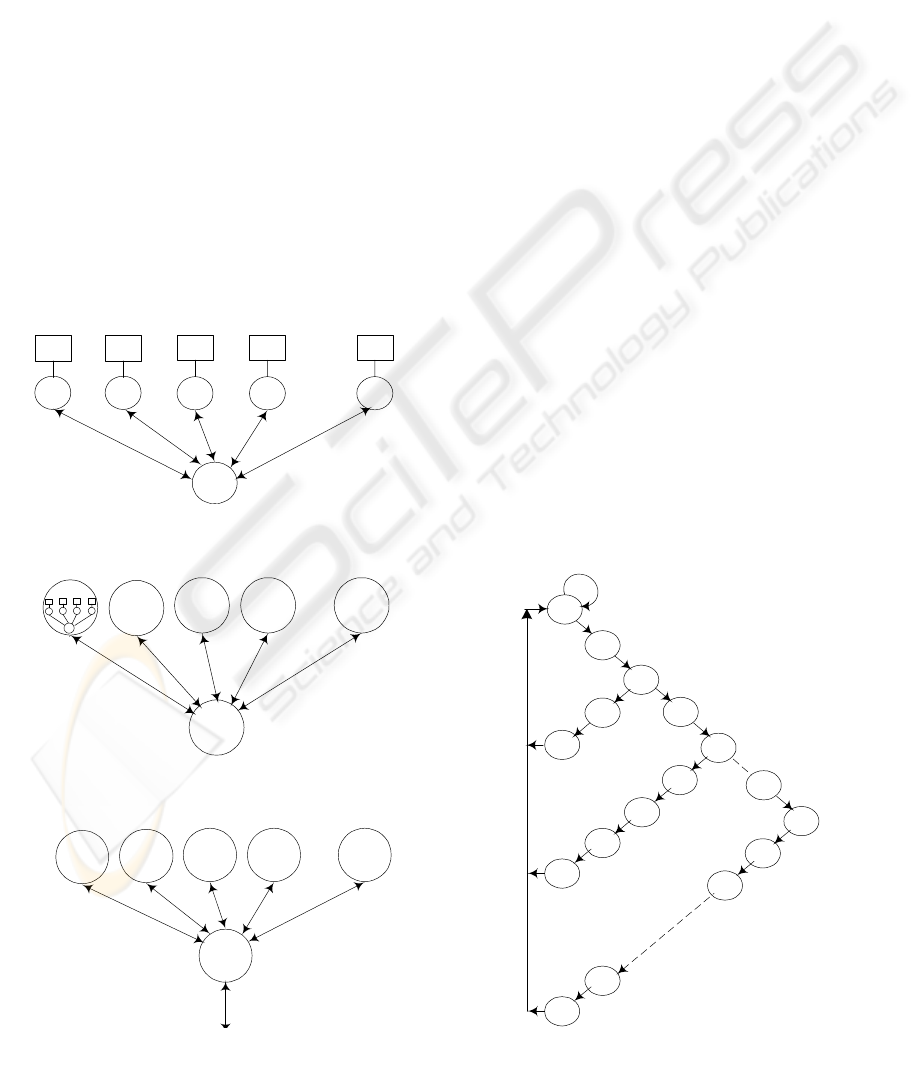
M
1p
Figure 1: Basic MVSM cluster
Proc
FL
1i
P
0
P
f1
P
1
P
m1
P
m2
M
1i
P
m1
FL
2i
M
2i
BL
1j
CNs
P
f2
P
2
P
m2
BL
2j
BL
1k
CNs
M
1j
P
ms
M
s
P
ms
BL
sj
BL
1l
CNs
M
(s-1)j
FL
si
....
PC
12
PC
13
PC
14
PC
1C1
M
2q
Figure 2: Two stage MVSM system
....
Hirerchical
Expansion
PC
(i-1)1
PC
(i-1)2
PC
(i-1)3
PC
(i-1)4
PC
(i-1)C(i-1)
M
ij
Figure 3: A cluster in i
t
h
stage of s-stages system
Figure 4: State diagram of MVSM with s-stages
ICEIS 2005 - SOFTWARE AGENTS AND INTERNET COMPUTING
264
If the probabilities of the request that directed to
itself and FL
1
are and r ,one can compute
the probabilities of referring a processor request to
FL
i
, M
i
, BL
i
and local PCs by following equations:
(1)
(2)
is 1 for the last stage of the system.
If the request rate of a processor is , the input
rate of F
L1
that originated from that processor will be
1 . Since there are processors in each
basic cluster, the requests that receive to F
L1
from
other processor will be .
(14)
So the total requests of the processors that
received to service centres in 1
st
stage are,
(3)
(4)
In the i
th
stage of the system, if the input request
rate from each PC is , we can derive input rate
of each service centre by the similar method.
(5)
(6)
Based on the M/M/1 queuing equation
(Sheldon,2000), we can compute the queue lengths
of each centre for all stages. Then the average of
total waited processors can also be computed based
on the number of service centre in the system and
the number of the waited processor in each centre:
(7)
According to assumption 9, the effective
processor’s request rate would be lower than . It
will be decreased with the same ratio as the active
processors to the total processor’s number. After
determining effective request rate and waited
processor for each service centre, the waiting time
can be computed by following the equations:
(8)
(9)
(10)
(11)
(12)
Based on the average waiting time W, we can
compute the processor utilization as follows:
(13)
Finally, the most important metric for evaluating
of the system’s performance, i.e., total processing
power of the system (TPP), can be computed on the
basic of single processor power (SPP),
[]
4 PERFORMANCE METRICS
The model is useful not only to evaluate the system
performance but also to investigate the effect of
different parameters’ variation on the system
performance. The last capability of the performance
model can be used during the system design.
Table 1: System assumption
Quantity Units
Processor’s Power 400 MIPS
Total Processor 3201 Pieces
Inter Job Communication
Probability
0.25 %
Memory Reference Per
Instruction (MPI)
1.2 -
We used 3201 pieces of the 400 MIPS RISC
processors, interconnection network with 1000
Mbps and the memory access time is 20ns. It is
assume that the system is organized in a three stages
by MVSM model. To measure performance metrics,
it is based on P
i
and MPI.
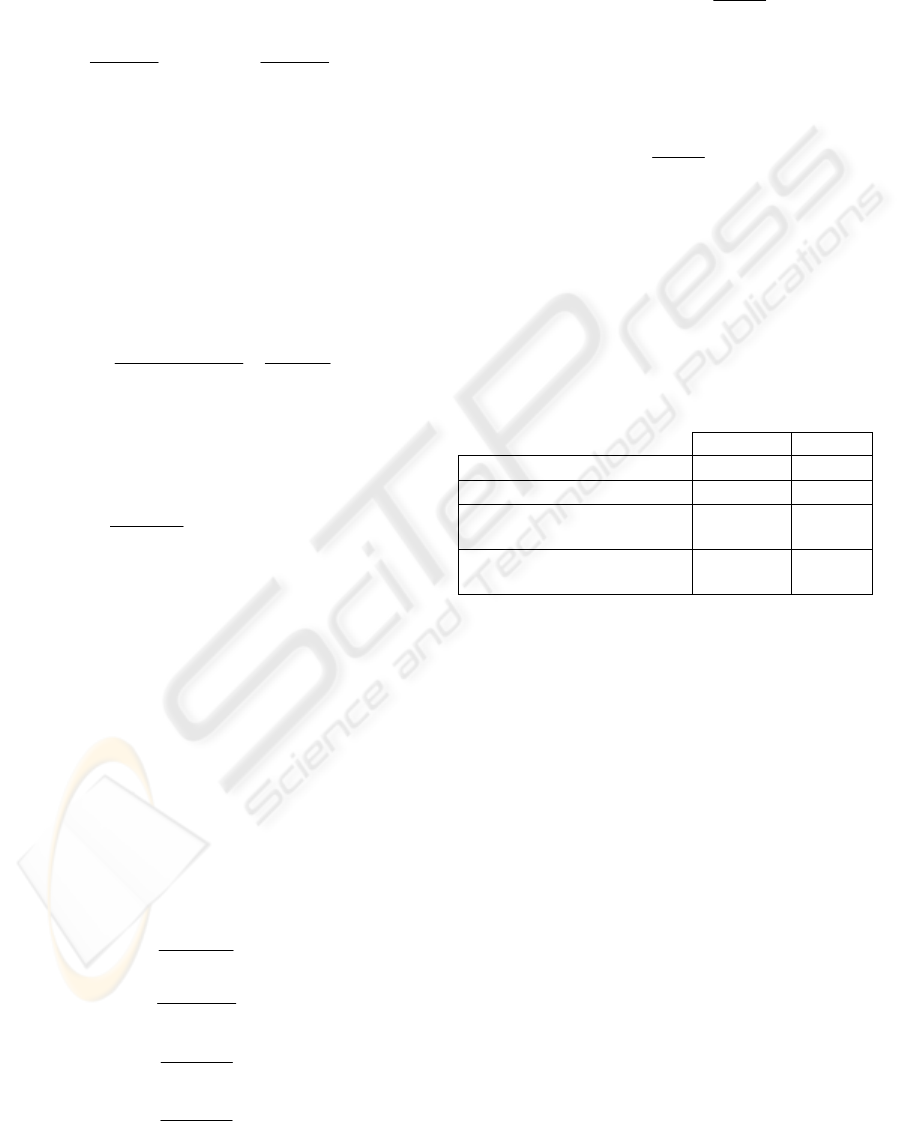
System must give TPP of 1,280,400 MIPS for
3201 pieces of 400 MIPS. It is reachable if there is
no overhead by parallelism. To reach the maximum
PP and find the best architecture, we study the PP
corves in each stage.
Figure 6 depicted these curves when the first
stage’s cluster number (C
1
) varies from 1 to 100.
The curves are plotted for some values for the
second stage’s cluster number (C
2
) from 2 to 20.The
curves show that the maximum PP will occur on 16
clusters on the 1
st
and 10 clusters in 2
nd
stages. For
this configuration the processing power will be
equal to 1,113,948 MIPS or 87% of TPP.
Figure 7 shows the variation of PU. The best
configuration will be held on 10 clusters of 16 sub-
clusters, that each sub-cluster consist 20 nodes.
∏
== )
j
PP
−
=
−
1
0
1(
i
j
fimi
P
)1(( −
=
−
==
∏
j
P
)1(
)1
1
1
0
1
−
−
−
=
−
i
mii
i
j
i
i
bili
C
PP
P
C
P
P
λ
λ
λ
λ
100011
)1(
mfm
PCPC === −
)1(( −
=
−−
==
)1)(1
)1(
0
11
00
101
11
−
C
P
CC
PP
mlm
bl
λ
λ
λλ
)
==
fi
C
λλλ
1(1 −− immiimi
P
)1( −
==
1−i
mili
bili
C
P
λ
λλ
()
()()
∑
∏∏
=
=
−−
−
=
⎥
⎦
⎤
⎢
⎣
⎡
⎭
⎬
⎫
⎩
⎨
⎧
−++
⎭
⎬
⎫
⎩
⎨
⎧
+=
s
k
k
i
ikkbklk
s
ki
ifkmk
CCLLCLL
1
2
1
1
1L
mkmk
mk
W
λµ
−
=
1
lklk
lk
W
=
1
λµ
−
fkfk
W
λµ
−
=
fk
1
bkbk
bk
W
λµ
−
=
1
∑
=
=
+++
s
i
bibififililimimi
WPWPWPWPW
1
1
1
Pr
+
==
W
PUlizationocessorUti
λ
⎟
⎟
⎠
⎜ +
+
=××=
i
i
PUNTPP
λ
⎞
⎜
⎝
∏
−
=
1
1
1
0
s
C
W
SPP
⎛
SPP
λ
λ
)1( P
0
−
λ
00
)1( P C
−
λ
s
P
0
C
0
P
)( P
0
−1
)m
λ
1( −i
DEVELOPING OF MULTISTAGE VIRTUAL SHARED MEMORY MODEL FOR CLUSTER BASED PARALLEL
SYSTEMS
265
2nd stage cluster no.(C2) used as plots parameter
0
0.2
0.4
0.6
0.8
1
1.2
1 3 5 7 9 1113151719
1st stage cluster no.(C1*5)
Total Processing Power (*1000000
)
MIPS
C2=2 C2=4 C2=5 C2=8
C2=10 C2=16 C2=20
2nd stage cluster no.(C2) used as plot's parameter
0
0.2
0.4
0.6
0.8
1
135791113151719
1st stage cluster no.(C1*5)
Processor Utilization
C2=2
C2=4 C2=5 C2=8
C2=10 C2=16 C2=20
Figure 7: PU vs. Cluster No. for 3-stage MVSM system
Figure 6:TPP vs. Cluster No. for 3-stage MVSMSystem
5 CONCLUSION
Mohaparta P., Das C.R., Jan 1996. Performance analysis
of finite buffered asynchronous multistage
interconnection networks, IEEE Transactions on
Parallel & Distributed Systems, pp.18-35.
We proposed a new architecture and its analytical
model for MVSM system. Analytical model was
constructed on queuing theory and the system
performance metric was expressed as mathematical
equations. The performance graphs may be used by
designer to find the optimum system configuration
for reaching to maximum performance with fixed
resources.
Mohapatra P., Das C.R. and Feng,T.Y. Jan 1994.
Performance analysis of cluster based multiprocessors,
IEEE Transaction on Computer, Vol. 43 pp. 109-114.
Nitzberg Bill and Virginia Lo, 1991. Distributed Shared
Memory: A Survey of Issues and Algorithms, IEEE
Computer, pp. 52-60.
Pinar Ali, Hendrickson Bruce., July 2004. Interprocessor
Communication with Limited Memory, IEEE
Transactions on Parallel and Distributed Systems, Vol
15, No.7
The future work focuses on improving the
analytical model for heterogeneous system to
determine the optimum point in design space. The
other subject is improving the analytical model by
applying software and scheduling features.
Shahhoseini H.S., Naderi M., Buyya R., 2000. Shared
memory multistage clustering structure: An efficient
structure for massively parallel processing systems,
The 4th International Conference on High
Performance Computing in Asia-Pacific Region (HPC
Asia 2000), Beijing, China. IEEE Computer Society
Press, USA.
REFERENCES
Buyya Rajkumar, 1995. High Performance Cluster
Computing: Architectures and Systems. vol. 1,
Prentice-Hall.
Sheldon M.Ross, 2000. Introduction to Probability Model,
Academic Press, 7
th
Edition.
Sohda Y., Nakada H., and Matsuoka S., 2001.
Implementation of a Portable Software DSM in Java,
Proceedings of the ACM JavaGrande/ISCOPE 2001
Conference, Stanford University, California.
Cooper Robert B., 1981. Introduction to Queuing Theory,
Elsevier North Holland. 2
nd
Edition.
Dandamudi S.P., Eager D.L., Jun 1990. Hierarchical
interconnection networks for multiprocessor systems,
IEEE Transaction on Computer, pp. 786-797.
Stumm Michael and Zhou Songnian. 1990. Algorithms
Implementing Distributed Shared Memory, IEEE
Computer, pp.54-64.
Hayes J.P., 2002. Computer Architecture and
Organization, McGraw-Hill. 3
rd
Edition.
Tanenbaun Andrew S., 1995. Distributed Operating
Systems,Prentice Hall, Inc.
Hennessy J. L. and Patterson D. A., 2003. Computer
Architecture: A Quantitative Approach, 3
rd
ed: Morgan
Kaufmann Publishers Inc.
Trevisan Thobias S., Costa Vitor Santos, Whately Lauro,
Amorim Claudio L., 2002. Distributed Shared Memory
in Kernel Mode, IEEE 14
th
Symposium on Computer
Architecture and High Performance Computing.
Li. K., Hudak P., Nov 1989. Memory Coherence in Shared
Virtual Memory Systems, ACM Transactions on
Computer Systems, 7(4), pp 321-359.
Http://staff.um.edu.mt/simweb/mm1.htm
ICEIS 2005 - SOFTWARE AGENTS AND INTERNET COMPUTING
266
