
EVALUATION OF METHODS FOR CONVERTING REQUEST
FOR QUOTATION DATA INTO ORDINAL PREFERENCE DATA
Estimating Product Preference in Online Shopping System
Toshiyuki Ono
Systems Development Laboratory Hitachi, Ltd., 292 Yoshida-cho, Totsuka, Yokohama, Japan
Hirofumi Matsuo
Graduate School of Business Administration, Kobe University, 2-1 Rokkodai, Nada, Kobe,Japan
Norihisa Komoda
Graduate School of Information Sceince and Technology, Osaka University, 2-1 Yamada-Oka, Suita, Osaka,Japan
Keywords: Product Preference, Online shopping, Multiattribute utility function, Conjoint analysis
Abstract: Obtaining timely information on consumer preference is critical for the success of marketing and operations
management. In a previous paper we proposed a method of estimating consumer preference by using their
history of browsing among possible configurations of personal computer in an online shopping environment.
It consisted of three steps: (1) collecting data on each consumer’s browsing history regarding quotations and
purchase requests, (2) converting requests for quotations and purchase order data into ordinal preference
data, and (3) estimating consumer preference for product attributes by applying a multiattribute utility
function. The underlying assumption with this method was that a product configuration that was quoted
later would be preferred to those quoted earlier. Another assumption was that how many times a product
configuration was quoted would not affect estimates for product preference as long as this was quoted at
least once. Although these assumptions are critical in estimating consumer preference, their validity has not
been examined. In this paper, we evaluate the validity of such hypotheses regarding the relationships
between consumer preference and the sequence and frequency of quoted product configurations, and
propose six methods of estimating consumer preference. We show through experiments that, for about 60%
of examinees, all the proposed methods could approximate consumer preference obtained by conjoint
analysis, and that the six methods have almost equal accuracy. We therefore concluded that any of the six
methods could be used equally well for estimating consumer preference in a timely fashion.
1 INTRODUCTION
Obtaining timely information on consumer
preference is critical for the success of marketing
and operations management. Personal computer
(PC) manufactures carefully control their inventories
of components because their profit margins are
rapidly declining (Kurawarwala and Matsuo, 1996),
and the underage and overage costs of inventory
may become prohibitively expensive. To keep such
inventory related costs under control, these
companies need to track shifts of consumer
preference in a timely fashion.
Many methods of estimating consumer
preference have been developed. One category of
such methods is to estimate consumer behaviour
such as preference and price sensitivity by
constructing a marketing model based on buying
information collected by tools such as a POS (point
of sales) terminal (Andrews and Manrai, 1999;
Bucklin and Gupta, 1999; Cooper, 1993). Another is
conjoint analysis (Green et al., 2001; Lilien et al.,
1992), which is used to estimate the consumer
preference for each of product attributes. Input data
of conjoint analysis is collected by questionnaire that
24
Ono T., Matsuo H. and Komoda N. (2005).
EVALUATION OF METHODS FOR CONVERTING REQUEST FOR QUOTATION DATA INTO ORDINAL PREFERENCE DATA - Estimating Product
Preference in Online Shopping System.
In Proceedings of the Seventh International Conference on Enterprise Information Systems, pages 24-31
DOI: 10.5220/0002545200240031
Copyright
c
SciTePress

survey how consumers make trade-offs between
attributes collects.
Methods that use POS data, however, fail to
collect information on the preferences of the
shoppers who do not make purchases, while
methods that use elaborate questionnaires are
expensive and time-consuming even if questionnaire
survey can be conducted by online environment such
as Internet (Miller and Dickson, 2001). When we are
dealing with short-life-cycle products like PCs, we
need an economical and fast means of tracking shifts
in consumer needs in response to new product
launches, price changes, and competitors’ moves.
The widespread use of Internet has allowed
companies to offer product information and prices in
real time, and take purchase orders through online
shopping systems (Kalakota and Whinston, 1997).
Ono and Matsuo (2000) focused on the browsing
data of consumers who did not make purchases. The
proposed method used data on consumer browsing
history involving available product configurations in
an online shopping environment. The information
could easily and inexpensively be collected by the
seller, reflecting individual consumer preference as
well as her/his chosen set.
The proposed method consisted of three steps:
(1) collecting data on individual consumers’
browsing histories for quotations and purchase
requests, (2) converting requests for quotations and
purchase order data into ordinal preference data, and
(3) estimating consumer preference on product
attributes by applying a multiattribute utility
function (Green and Krieger, 1993).
The proposed method assumed that that a
product configuration quoted later would be
preferred to those quoted earlier. It also assumed that
how many times a product configuration was quoted
would not affect estimates of product preference as
long as it was quoted at least once. However, some
consumers might prefer a configuration that was
quoted earlier or one that was selected more
frequently. In this paper, we evaluate the validity of
several conceivable hypotheses regarding the
relationships between product preferences and the
sequences and frequency of quoted product
configurations. We are not concerned with the wider
issue affecting preferences such as choice of store,
quality of on-line store and prior experience
(Marsden et al., 1999).
The rest of this paper is organized as follows.
Section 2 describes the procedure for estimating
product preference. Section 3 describes proposed
methods of converting requests for quotation data
into ordinal preference data. Section 4 reports our
experimental evaluation of the proposed methods
through experiments. Section 5 concludes the paper.
2 ESTIMATING PRODUCT
PREFERENCE
2.1 Definition of Product Preference
The product attributes of the PC we consider in this
paper are its total price and the performance levels
of its components such as the CPU, random access
memory and hard disk drive. Product attributes have
various levels. The random access memory level, for
example, is measured by its storage capacity (e.g.,
256 and 512 MB).
When consumers purchase a product, they decide
whether some attributes are more important than
others, and what levels for all attributes are required
or preferred. A particular configuration that a
consumer purchases is regarded as the configuration
that has the largest total preference calculated from
the preference for each product attribute. The
product preference of each consumer can be
expressed as an additive model of the multiattribute
utility function (Green and Krieger, 1993):
)1( )(),,,(
1
21
∑
=
=
K
k
kkK
xuxxxU L
where x
k
is the level of attribute k, U(x
1
, x
2
,…,x
k
) is
the product preference for attribute levels equal to x
1,
x
2, …,
and x
k
, and u
k
(x
k
) is the preference for attribute
k at level x
k
.
As preference differs from one consumer to
another, the attribute preferences are estimated for
each consumer. When the preferences of all
attributes are estimated, we can estimate the
preference for a product that is represented by the
combination of attributes.
2.2 Procedure for Estimating Product
Preference
Ono and Matsuo’s method proposed (2000) consists
of three steps. This subsection describes each step in
detail.
(1) Collecting requests for quotations and
purchase order data
The consumer’s series of requests for quotations
and orders are collected using an online shopping
system. Figure 1 shows a web screen for such a
system. The consumer’s operational procedure using
online shopping system is as follows.
EVALUATION OF METHODS FOR CONVERTING REQUEST FOR QUOTATION DATA INTO ORDINAL
PREFERENCE DATA: Estimating Product Preference in Online Shopping System
25
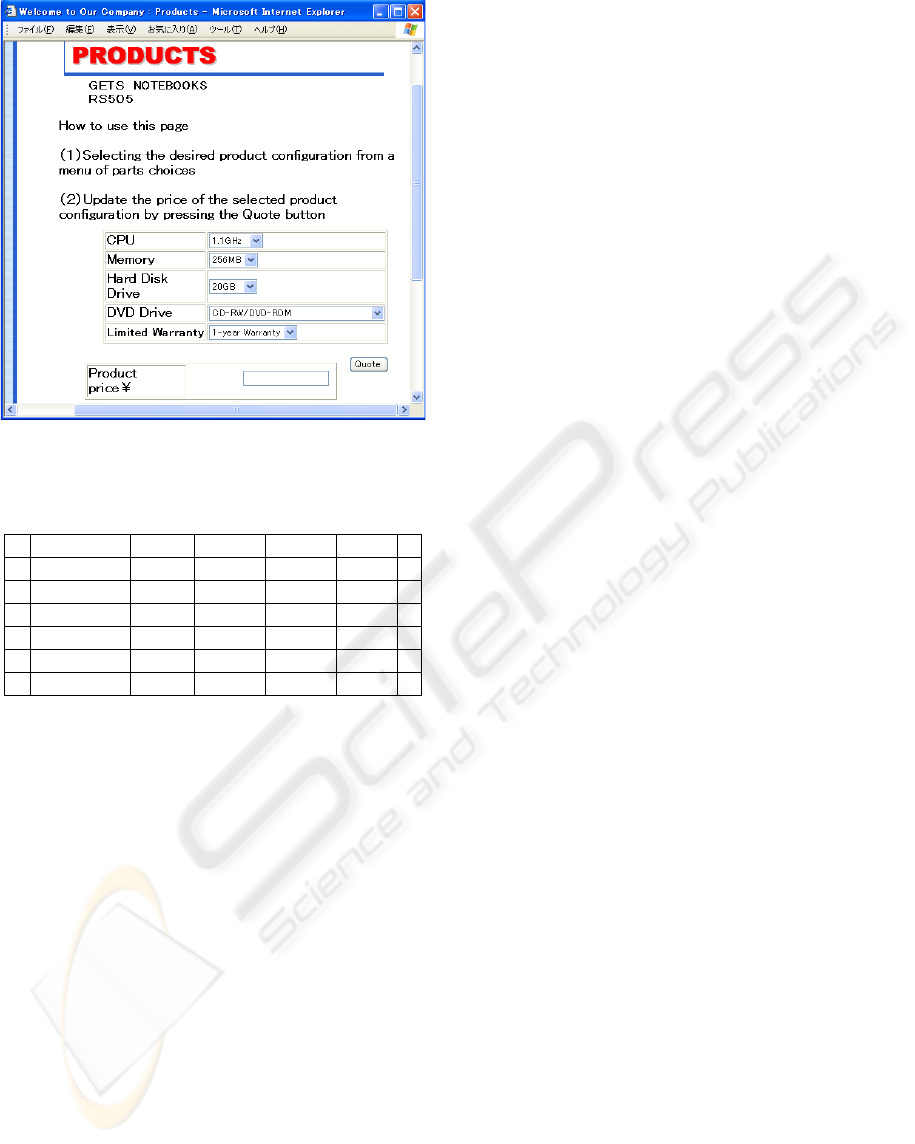
Figure 1: Screen for online shopping service.
Table 1: Example consumer series of requests for
quotations and purchase order data.
# Consumer ID Time Request CPU Memory …
1 123.45.6.7 14:09:06 Quote 900 MHz 256 MB …
2 123.45.6.7 14:09:59 Quote 1.1 GHz 512 MB …
3 123.45.6.7 14:11:02 Quote 900 MHz 256 MB …
4 123.45.6.7 14:11:35 Quote 1.1 GHz 256 MB …
5 123.45.6.7 14:12:20 Quote 900 MHz 512 MB …
6 123.45.6.7 14:13:20 Order 900 MHz 512 MB …
(a) She/he selects her/his desired product
configuration from a menu of component
alternatives.
(b) The consumer sends a quotation request for
the selected product configuration.
(c) The consumer receives the price for the
selected product configuration.
(d) If the consumer decides to purchase the
product with the configuration, then she/he
sends her/his order to purchase it.
Otherwise, she/he quits or repeats (a) to (c).
The online-shopping server system collects and
stores a series of quotation requests (b) and purchase
order information (d), if any.
Table 1 has an example of a consumer’s series of
requests for quotes and purchase order. Here, she/he
first asks for a quote for a configuration comprised
of a 900-MHz CPU and 256-MB memory. Then,
she/he asks for a quote for a configuration
comprised of a 1.1-GHz CPU and 512-MB memory.
After five rounds of such requests for quotes, she/he
finally places a purchase order for a configuration
comprised of a 900-MHz CPU and 512-MB memory.
In this example, the consumer can be identified
by her/his source IP address to access the Internet.
We could also use a preliminarily registered
consumer ID or a “cookie” (Lemay et al., 1996),
which is Internet technology to read and write in a
file on the consumer’s PC.
(2) Converting requests for quotes and purchase
order data into ordinal preference data
Based on collected requests for quotes and
purchase order data, we can attempt to rank
configurations that have been requested for quotes
by each consumer in the order of preference. The
collected data contains purchasers’ data and non-
purchasers’ data. The product configuration that is
ordered to purchase should be ranked the highest in
terms of preference. Product configurations that are
not quoted should be ranked lower in the order of
preference. However, the question is how
configurations that are quoted and then not ordered
should be ranked in each consumer’s order of
preference. We propose several rules for converting
requests for quotation data into ordinal preference
data in Section 3, and evaluate these in Section 4.
(3) Estimating product preference
Three models for measuring a consumer’s
multiattribute utility function are described in Green
and Krieger (1993). The vector model assumes that
the preference is linearly related to product attribute
levels. The ideal-point model assumes that
preference is inversely related to the weighted
squared distance between the level of an attribute
and the individual’s ideal level of the attribute. The
part-worth model assumes a function representing
the discrete part-worth levels for each attribute.
Because the performance levels of components
such as CPUs and random access memories are
discrete, we use the following part-worth model:
)2(
11
∑
=
×
∑
=
=
L
l
mkl
d
kl
K
k
m
U
λ
where U
m
is a consumer’s product preference for
configuration m, d
mkl
is an indicator that takes on
value of one when attribute k is at level l for
configuration m, and zero otherwise, and λ
kl
are
part-worth for attribute k at level l. The ordinal
preference data and the configurations can be
regarded as sample values of U
m
and d
mkl
in Eq. (2),
and the estimate of part-worth, λ
kl
is calculated using
linear regression analysis.
ICEIS 2005 - SOFTWARE AGENTS AND INTERNET COMPUTING
26

3 PROPOSED METHODS OF
CONVERTING REQUESTS FOR
QUOTATION DATA INTO
ORDINAL PREFERENCE DATA
3.1 Hypotheses on relationships
between consumer preference and
sequences and frequency of
requests for quotations
In this subsection, we propose the following
hypotheses on the relationships between the
consumer preference for configurations and the
sequence and frequency of configurations that
appear in a consumer’s series of requests for
quotation, and propose methods of converting
requests for quotation data into ordinal preference
data. In Section 4, we attempt to verify the validity
of these hypotheses.
(1) Ranking the configurations based on the
sequence of quoted product configurations
Hypothesis 1a: Consumers prefer
configurations quoted later.
- Configurations quoted later rank higher in
the order of preference.
Hypothesis 1b: Consumers prefer
configurations quoted earlier.
- Configurations quoted earlier rank higher in
the order of preference.
Hypothesis 1c: Consumer preference is not
reflected in the order of the sequence of
requests for quotes.
- All configurations requested for quotes rank
in the same order of preference.
(2) Ranking configurations based on frequency of
appearance in sequence
Some consumers quote the same configuration
many times. We propose the following hypotheses
on the relationships between the ordinal preference
for configurations and the frequency of appearance
in the sequence.
Hypothesis 2a: Consumers prefer
configurations more frequently requested
for quotes.
- Configurations requested for more quotes
rank higher in the order of preference.
Hypothesis 2b: Consumer preference is not
reflected in the frequency of requests for
quotes.
- All the configurations requested for quotes
rank in the same order of preference.
3.2 Algorithm for deriving the ordinal
preference of configurations
We propose the following algorithm to assign a
positive integer to each configuration based on a
sequence of configurations where a consumer
requested a quotation. An integral number is
assigned to each configuration that reflects the order
of preference for the configuration. This integral
number for each configuration is referred to below
as the preference number. A preference number of
one is assigned to the most preferred configuration.
The smaller the preference number, the more
preferred the configuration is.
Steps 1-7 are applied to each consumer’s data.
Step 1: Set the preference number of n =1.
Step 2: If the collected data includes the
product configuration that the consumer
placed order to purchase, then a preference
number of n=1 is assigned to the
configuration that is ordered to purchase.
Then, set n: =n+1, and proceed to Step 5.
Otherwise, proceed to Step 3.
Step 3: Of the unprocessed request data in the
consumer’s series of requests for quotations,
(i) If Hypothesis 1a or 1c is applied, then
select the latest configuration in the
consumer’s series of requests for quotations.
(ii) If Hypothesis 1b is applied, then select
the earliest configuration in the consumer’s
series of requests for quotation.
Step 4: Consider one of the following three
cases for the selected configuration,
(i) If the configuration selected in Step 3 has
already been assigned a preference number,
then proceed to Step 5.
(ii) If the configuration selected in Step 3 has
not been assigned a preference number,
then preference number n is assigned to the
configuration
(ii-a) If Hypothesis 1a or 1b is applied,
then set n: =n+1 and proceed to Step 5.
(ii-b) If Hypothesis 1c is applied, then
proceed to Step 5.
Step 5: If been a configuration remains that has
not been processed in the sequence of
requests for quotations, then proceed to
Step 3. Otherwise, proceed to Step 6.
Step 6: There are two cases for Hypotheses 2a
and 2b.
(i) If Hypothesis 2a is applied, then do the
following.
Apply the following Steps 6.1 to 6.7 for
each configuration that has been
requested for quotation many times.
EVALUATION OF METHODS FOR CONVERTING REQUEST FOR QUOTATION DATA INTO ORDINAL
PREFERENCE DATA: Estimating Product Preference in Online Shopping System
27

Step 6.1: Select the configuration that has
been requested for quotation many times.
Step 6.2: Count the frequency of quotations
for the selected configuration.
Step 6.3: Set i: =1
Step 6.4:
(a) If the selected configuration has a
preference number of 1, then preference
numbers that have already been assigned
to other configurations should be
increased by one.
(b) If the selected configuration has a
preference number of 2 and the
configuration that has been ordered by the
consumer has a preference number of 1,
then the preference numbers that have
already been assigned to other
configurations should be increased by one.
(c) For any other cases, the preference
number for the selected configuration
should be reduced by one.
Step 6.5: Count up i = i+1
Step 6.6: If i is equal to the frequency of
quotation for the selected configuration,
then proceed to Step 7. Otherwise
proceed to Step 6.4
(ii) If Hypothesis 2b is applied, then proceed
to Step 7.
Step 7: Calculate the maximum value for the
preference numbers assigned to the
configurations in Steps 1 to 6. Assign the
maximum value plus 1, as the preference
number to the product configurations that
do not appear in the sequence of requests
for quotations and purchase order.
We evaluate six combinations of Hypotheses 1a-
1c and 2a-2b and these are listed in Table 2.
Table 3 lists the preference numbers for the six
methods, which were calculated from data on the
sequence of requests for quotations and purchase
order in Table 1.
Table 2: Methods of deriving ordinal preference for
configurations.
Quote-sequence
hypothesis
Quote-frequency
hypothesis
Method 1 Hypothesis 1a Hypothesis 2a
Method 2 Hypothesis 1a Hypothesis 2b
Method 3 Hypothesis 1b Hypothesis 2a
Method 4 Hypothesis 1b Hypothesis 2b
Method 5 Hypothesis 1c Hypothesis 2a
Method 6 Hypothesis 1c Hypothesis 2b
3.3 Estimating Part-worth
Based on the preference numbers derived in Section
3.2, we estimate the part-worth coefficients in Eq.
(2). Figure 2 has an example of a part-worth
estimate. The Method 2 column in Table 3 has
sample values for product preference U
m
in Eq. (2),
and corresponding configurations are represented by
d
mkl
. The estimate for part-worth, λ
kl
, can be
calculated by using linear regression analysis. Part-
worth, λ
kl
, expresses a consumer’s preference for
product attributes. Product preference U
m
for
configuration m can be estimated by the sum of the
part-worths of corresponding product attributes.
U
m
Preferenc e
number
4
3
2
1
5
・・・
=
d
mkl
Product configuration
900 MH
Z
1.1 GH
Z
256 MB 512 MB
・・・
0101
・・・
1010
・・・
0110
・・・
1001
・・・
・・・
・・・
λ
kl
Part- worth
λ
11(900 MHz)
λ
12 (1.1 GHz)
λ
21 (256 MB)
λ
22 (512 MB)
・・・
・・・
Quote 2 →
Quote 3 →
Quote 4 →
Order 6 →
Other →
Figure 2: Example part-worth estimate.
Table 3: Examples of ordinal preference data
Consumer’s data on quotation
and purchase order
Ordinal preference data by proposal methods
Request CPU Memory … Method 1 Method 2 Method 3 Method 4 Method 5 Method 6
Quote 1 900 MHz 256 MB … 2 2
Quote 2 1.1 GHz 512 MB … 4 4 4 3 3 2
Quote 3 900 MHz 256 MB … 2 3 2 2
Quote 4 1.1 GHz 256 MB … 2 2 5 4 3 2
Quote 5 900 MHz 512 MB …
Order 6 900 MHz 512 MB … 1 1 1 1 1 1
Rest of above configuration 5 5 6 5 4 3
ICEIS 2005 - SOFTWARE AGENTS AND INTERNET COMPUTING
28
4 EVALUATION OF PROPOSED
METHODS
4.1 Experimental procedure
We designed an experiment and tested it on subjects,
who were university students majoring in science
and engineering, to evaluate the methods proposed
in the previous sections. The product attributes and
levels that we used are listed in Table 4. The total
price of a product configuration is determined by the
sum of the component prices in Table 4. We
constructed the experimental system as a Web site
on the Internet to mimics an actual online shopping
system. Because it was an experimental system, we
did not sell products or collect the data on requests
for purchase.
To test the validity of the proposed methods, we
compared our experimental results with those of the
conjoint analysis. To do this, we conducted a
questionnaire using the same set of subjects. We
used orthogonal design, and asked each participant
to rank eight configurations in their order of
preference.
Table 4: Products attributes in experiment.
# Attribute Level No. Level Price
1 900 MHz +0 yen A CPU
2 1.1 GHz +20,000 yen
1 256 MB +0 yen B Memory
2 512 MB +23,000 yen
1 20 GB +0 yen
2 40 GB +10,000 yen
C HDD
3 60 GB +20,000 yen
1 CD-RW &
DVD-ROM
+0 yen D DVD drive
2 DVD-RAM &
DVD±R/RW
+20,000 yen
1 1-year warranty +0 yen E Warranty
2 3-year warranty +18,000 yen
Base price 190,000 yen
(Note: Profile nos. of all 48 (2*2*3*2*2) kinds of product
configurations were calculated by 24*(attribute A’s level No.-1)
+12*(attribute B’s level No.-1) +4*(attribute C’s level No.-1) +2*
(attribute D’s level No.-1) + (attribute E’s level No.-1)
4.2 Results and Discussions
4.2.1 Results for preference estimation
The quotation data collected from 66 subjects with
the experimental system described in Section 4.1 are
listed in Table 5. We converted the collected data
into ordinal preference data by using the six methods
described in Section 3 and used the data to estimate
part-worth λ
kl
and product preference U
m
for any m.
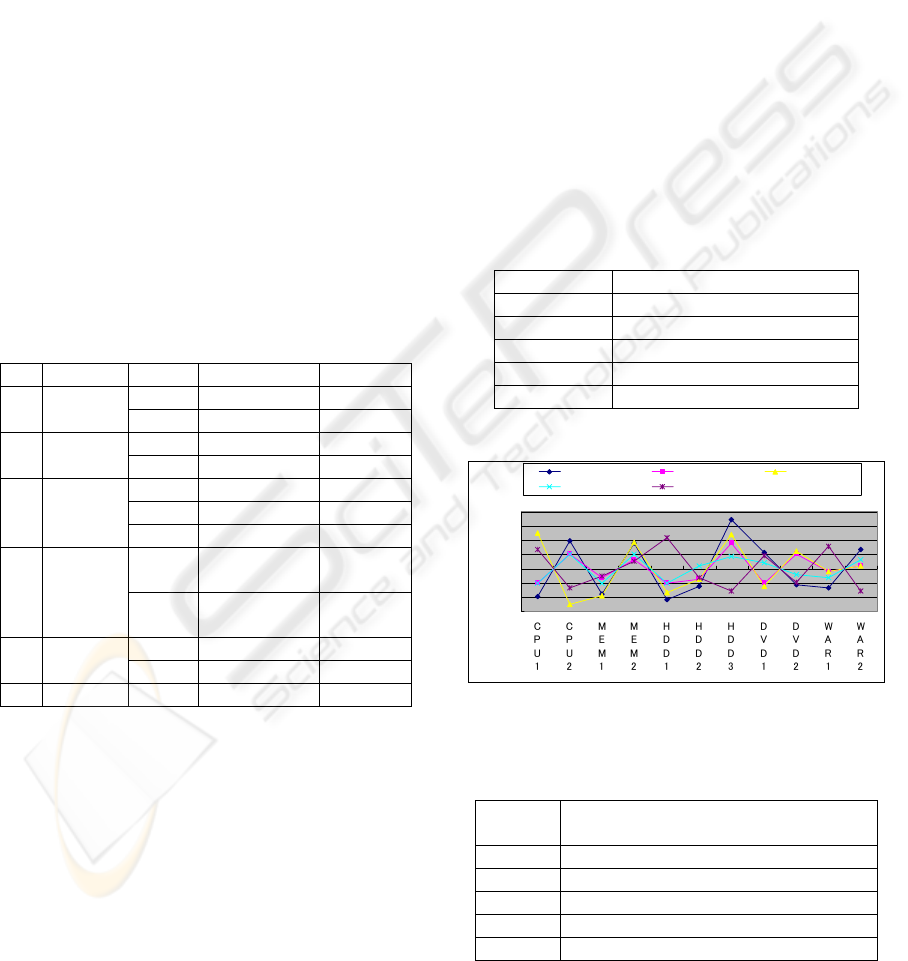
Figure 3 is a graph indicating the part-worth λ
kl
estimated with Method 2 for five subjects. The
estimated part-worth value was calculated from the
corresponding preference number described in
Section 3. By data conversion, the higher the part-
worth is, the more the subjects preferred that level
for product attribute. The average part-worth in the
same attributes for each consumer is set to zero.
Figure 3 shows that subject No. 1 preferred a 1.1-
GHz CPU and 512-MB memory and that subject No.
5 preferred a 900-MHz CPU and 512-MB memory.
4.2.2 Discussions on results
We evaluated the accuracy of estimated product
preferences U
m
with the questionnaires, which
subjects had indicated the configurations they
preferred. The data collected from these
questionnaires is listed in Table 6.
Table 5: Collected requests for quotation data.
Subject No. Product profile of quote sequence
1 46, 22, 34, 46, 42, 45, 46, 48, 46
2 44, 48, 36, 48, 47
3 10, 48, 24, 22, 2 , 24 ,23, 19
… …
66 29
(Note: Starting from left, product profile is quoted earlier)
-.60
-.40
-.20
.00
.20
.40
.60
.80
Part-worth
Subject No.1 Subject No.2 Subject No.3
Subject No.4 Subject No.5
Figure 3: Part-worth λ
kl
of five subjects estimated with
proposed Method 2.
Table 6: Preference data collected from questionnaire.
Subject No. Preference order for 8 product profiles
(4, 7, 10, 16, 25, 28, 42, 47)
1 4, 7, 3, 8, 6, 5, 1, 2
2 7, 5, 4, 6, 3, 8, 2, 1
3 1, 8, 6, 4, 7, 5, 3, 2
… …
66 3, 8, 6, 4, 7, 5, 2, 1
EVALUATION OF METHODS FOR CONVERTING REQUEST FOR QUOTATION DATA INTO ORDINAL
PREFERENCE DATA: Estimating Product Preference in Online Shopping System
29
We calculated Peason’s correlation coefficient
between product preference estimated with conjoint
analysis and product preferences estimated with the
six proposed methods. The estimated product
preferences and correlation coefficients for subject
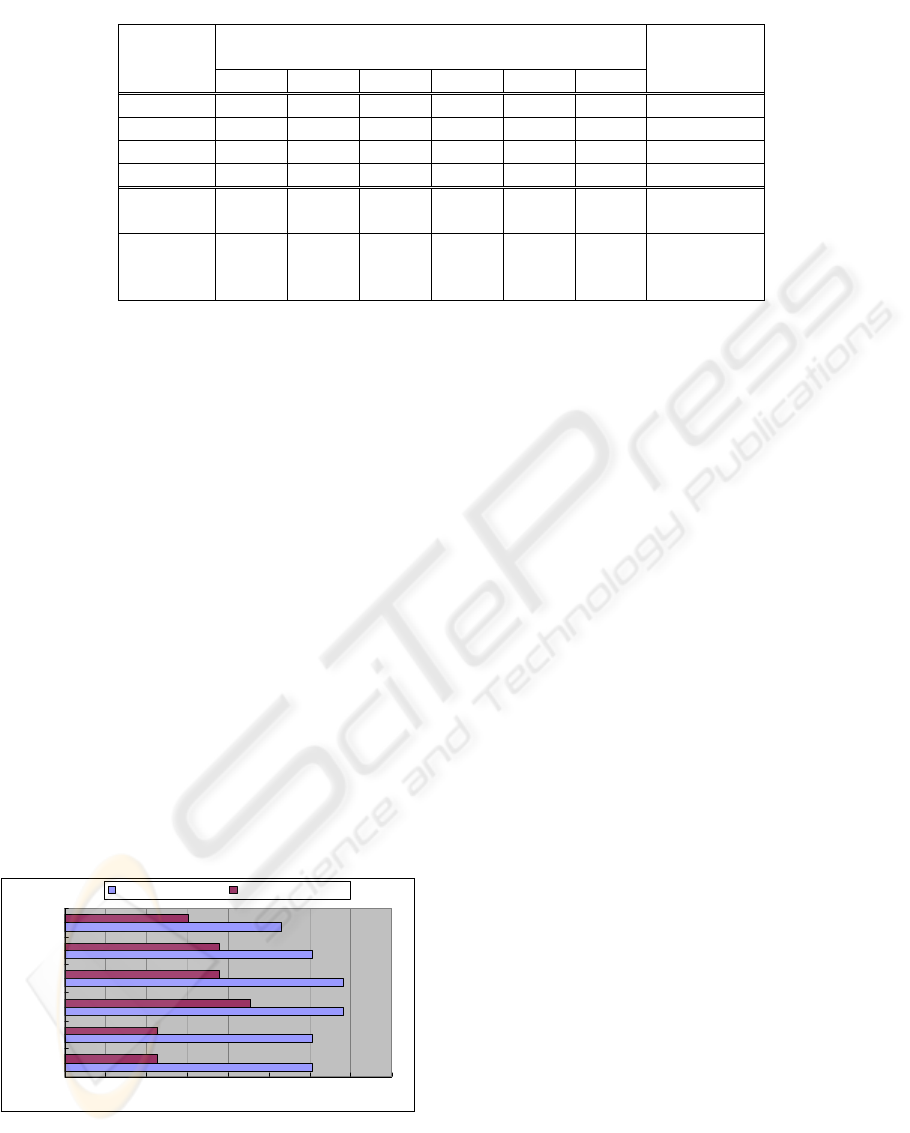
No. 1 are listed in Table 7. Figure 4 shows the
percentages of subjects for whom the correlation
coefficients between preference estimated with
conjoint analysis and with the six proposed methods
are statistically significant at the 5% and 1% levels.
Note that 33 of the 66 subjects only requested one
configuration for quotes. Therefore, these six
methods generated the same ordinal preference data,
and the same correlation coefficients results.
The number of subjects for whom there was a
significant correlation between the preferences
estimated with conjoint analysis and with the six
proposed methods was greatest for Methods 3 and 4.
For Method 3, the correlation coefficients of 42 of
the 66 subjects were significant at the 5% level and
the correlation coefficients of 39 subjects were
significant at the 1% level.
50.0% 52.0% 54.0% 56.0% 58.0% 60.0% 62.0% 64.0% 66.0%
Method1
Method2
Method3
Method4
Method5
Method6
5% significance level 1% significance level
Figure 4: Percentage of subjects for whom correlation
between preferences estimated with conjoint analysis and
proposed methods was significant at 1% and 5% levels.
In terms of ratio, the correlation coefficients for
63.6% of the subjects were significant at the 5%
level and the correlation coefficients for 59.1% of
subjects were significant at the 1% level. Even with
the method that had the lowest correlation, 60.6% of
the subjects had correlation that was significant at
the 5% level, and 54.5% of the subjects had
significant correlation at the 1% level. These results
led us to conclude that any of the proposed methods
could approximate preference obtained by conjoint
analysis for about 60% of the subjects.
Outcome of the hypothesis test for difference of
correlation coefficients among the proposed methods
are listed in Table 8. Numeric data “4” in the table
where the row is Method 2 and the column is
Method 4 means that H
0
is rejected in favour of H
1
at
the 5% significance level by “4” subjects from the
outcome of testing the hypotheses.
H0 (null hypothesis): population correlation
coefficients between Methods 2 and 4 are
equal
H1 (alternative hypothesis): population
correlation coefficient of Method 2 is
greater than that of Method 4.
All six methods are almost the same, and none
can be said to be better than the others.
Table 9 indicates the number of subjects who had
a high correlation between the outcome for conjoint
analysis and that for each of the six methods. Here,
the subjects are categorized by the number of
requests for quotes. We cannot see any relationships
between the number of requests for quotes and the
proposed methods. From the viewpoint of
computational effort, Method 6 (based on the
hypothesis that quote sequence and frequency are
not related to configuration preference) is the most
efficient because Steps 4 and 6 for the algorithm
described in Section 3.2 are not required to process
for each consumer data.
Table 7: Examples of estimated product preferences and correlation coefficients.
Product preference of subject No. 1
estimated with proposed methods
Product No.
Method 1 Method 2 Method 3 Method 4 Method 5 Method 6
Preference on
questionnaires
1 0.40 0.21 0.38 0.54 -0.33 -0.17 0.36
2 0.75 0.75 1.25 1.25 0.00 0.00 2.71
… … … … … … … …
48 3.33 2.92 3.00 2.58 0.90 0.48 8.75
Peason’s
correlation
0.761 0.77 0.722 0.721 0.741 0.764 -
Significance
probability of
correlation
0 0 0 0 0 0 -
ICEIS 2005 - SOFTWARE AGENTS AND INTERNET COMPUTING
30

Table 8: Outcome of the hypothesis test for difference of
correlation coefficients among proposed methods
Method
1
Method
2
Method
3
Method
4
Method
5
Method
6
Method 1 - 0 4 4 1 2
Method 2 0 - 4 4 1 2
Method 3 3 3 - 0 0 2
Method 4 3 3 0 - 0 1
Method 5 0 0 3 3 - 1
Method 6 0 0 3 3 0 -
Table 9: Number of significantly correlated subjects.
Quote
frequency
Method
1
Method
2
Method
3
Method
4
Method
5
Method
6
1 20 20 20 20 20 20
2 3 3 3 3 3 3
3 4 4 4 4 3 4
4 6 6 7 7 6 6
5 1 1 1 1 1 1
6 3 3 3 3 3 3
7 1 1 1 1 1 1
8 2 2 2 2 2 2
10 1 1 1 1 1 1
11 0 0 0 0 0 0
5 CONCLUSION
We proposed and examined hypotheses regarding
the relationship between preference for
configurations and the sequences and frequency of
requests for quotes. These hypotheses are critical in
estimating individual consumer product preference
from their browsing data. Ono and Matsuo (2000)
assumed Hypotheses 1a and 2b. However, the
validity of their assumptions over others that are
conceivable has not examined, and it was the focus
of this paper.
The experimental results indicated that, for about
60% of subjects, any of the six proposed methods
was able to approximate explicit preference obtained
by conjoint analysis. Therefore, any of these
methods could be used to track shifts in consumer
preference in a timely fashion.
The six methods had almost equal accuracy.
From the viewpoint of computational effort, the
method based on the hypothesis that there is no
relationship between configuration preference and
the quote sequences and frequency was the most
efficient.
Our evaluation only used experimental data on
requests for quotes, and thus did not include
information on purchase order. Evaluation based on
data that includes the order information from an
actual online shopping system is an issue for further
investigation.
The proposed methods can not only be applied to
PCs but also other products consisting of several
components. As long as we can collect data on the
browsing history of individual consumers, the
proposed methods may also be able to be applied to
shopping systems that use multimedia kiosks in
stores and on the street.
REFERENCES
Andrews, R. L. & Manrai, A. K., 1999. MDS Maps for
Product Attributes and Market Response: An
Application to Scanner Panel Data. Marketing Science,
18(4), 584-604.
Bucklin, R. E. & Gupta, S., 1999. Commercial Use of
UPC Scanner Data: Industry and Academic
Perspectives. Marketing Science, 18(3), 247-273.
Cooper, L. G., 1993. Market-Share Models. In Eliashberg,
J. & Lilien, G. L. (Eds.), Marketing Handbooks in
Operations Research and Management Science Vol. 5
(pp. 299-309). Elsevier Science Publishers B. V.
Green, P. E. & Krieger, A. M., 1993. Conjoint Analysis
with Product-Positioning Applications. In Eliashberg,
J. & Lilien, G. L. (Eds.) Marketing Handbooks in
Operations Research and Management Science Vol. 5
(pp. 469-477). Elsevier Science Publishers B. V.
Green, P. E., Krieger, A. M. & Wind, Y., 2001. Thirty
Years of Conjoint Analysis: Reflections and Prospects.
Interfaces, 31(3), 56-73.
Kalakota, R. & Whinston, A., 1997. Electronic Commerce
(pp. 217-243). Addison Wesley,
Kurawarwala, A. A. & Matsuo, H., 1996. Forecasting and
Inventory Management of Short Life Cycle Products.
Operations Research, 44(1), 131-150.
Lemay, L., Murphy, B. K. & Smith, E. T., 1996. Creating
Commercial Web Pages (p. 269). Sams.net Publishing.
Lilien, G. L., Kotler, P. & Moorthy, K., 1992. Marketing
Models (pp. 241-244). Prentice Hall.
Marsden, J. R., Tung, Y. A. & Keeney, R. L., 1999. The
Value of Internet Commerce to the Customer.
Management Scinece, 45(4), 533-542.
Miller, T. W. & Dickson, P. R., 2001. On-line Market
Research. International Journal of Electronic
Commerce, 5(3), 139-168.
Ono, T. & Matsuo, H., 2000. A Method for Analyzing
Customer’s Product Preference Based on Browsing
Data Collected in an Online Shopping System. The
Institute of Electrical Engineers of Japan, 120-C (8/9),
1230-1235 (in Japanese).
EVALUATION OF METHODS FOR CONVERTING REQUEST FOR QUOTATION DATA INTO ORDINAL
PREFERENCE DATA: Estimating Product Preference in Online Shopping System
31
