
INTERNATIONAL STANDARDS AND USABILITY
MEASUREMENT
Hema Banati and P.S.Grover
Department of Computer Science
University Of Delhi
Delhi-110007, India
Keywords: Usability, Standards, Understandability, Learnability
, Operability, Attractiveness, Information oriented
website
Abstract: The current trend of increased web usage has recognized the need of usable websites.
A site containing
relevant information may not gain user acceptance if the user finds it difficult to use. A quantifiable
measure of usability can provide a measurable estimate of improvement required in the website. It can also
help in comparing different websites. This measure would gain wider acceptability, if obtained, by applying
the international standards of measurement. This paper measures usability quantitatively using the
international standard ISO/IEC TR 9126-2. Metrics specified in the standards are used to measure the four
sub-characteristics of usability, “Learnability”, “Operability”, “Understandability” and “Attractiveness” for
an academic website. It was found that the “Learnability” level of the website was very low, as compared to
the Understandability level. This is not in conformation with the standards, which mention the latter to be
an indicator of the former. The significance and relevance of each metric to usability of the website was
then examined in this light. The study also highlight the long due need of standardizing the process of
usability measurement.
1 INTRODUCTION
Websites can have different level of acceptance by
users, depending on their sensitivity towards the
needs of users. A site containing all relevant
information may not gain acceptance if the user
finds it difficult to use. This issue attains significant
relevance for an academic website which addresses
the technologically aware new generation.
Studies of different websites of universities have
been conduct
ed in the past. (Strauss, 2000)
identified the need of web portals, for universities,
which can provide information as required by the
users. In order to make these more useful, the
website designers need to identify different class of
users and their specific requirements. Usefulness, as
discussed by (Nielsen, 1993), includes both utility
and usability. The term “utility” of a site implies the
presence of features, required to achieve the specific
goals. “Usability” refers to the capability of utilizing
these features efficiently and effectively to achieve
desired goals with complete user satisfaction.
(Corry, Frick and Hansen, 1997) studied effect of
issues such as ease of
information location, scrolling
and key presses on usability of Indiana University
website. (Dhillon, 2001) stressed upon the need of
organizing relevant information on the university
websites to improve upon their user-friendliness.
(Rao, 2002) explored the best possible information
presentation style for a particular web portal for a
specific class. All these attempts were made to
enhance the usability of a website. However, no
study was undertaken to measure and improve
usability of a website using the international
standards.
Researchers across the globe have developed
various
qualitative and quantitative methods to
measure usability. It is felt that a quantifiable
measure of usability can affect the process of
planning and designing of websites. It allows for a
measurable estimate of each sub-characteristic and
the overall usability of the product. This measure
gains wider acceptability and reliability, if obtained,
by applying the international standards of
measurement.
This paper is an attempt to highlight the need of
stan
dardizing the process of usability measurement.
The sub-characteristics specified in the standard
184
Banati H. and S.Grover P. (2005).
INTERNATIONAL STANDARDS AND USABILITY MEASUREMENT.
In Proceedings of the Seventh International Conference on Enterprise Information Systems, pages 184-188
DOI: 10.5220/0002536701840188
Copyright
c
SciTePress
ISO/IEC 9126-2[5] are measured on a website. The
relationship between these was explored and was
found to be in non-conformation with the standards.
This could be attributed towards the non-
measurement of all metrics specified by the
standards. The priority and significance of each of
the usability metric is hence questioned.
The following section discusses the site studied and
the method adopted for measurement. The measures
obtained are analyzed in the next section. The
impact of the study is explained in the final section
where we outline the significance of this study.
2 METHOD
This paper applies the international standard
ISO/IEC TR 9126-2 to measure the usability of
Indira Gandhi National Open University
(commonly known as IGNOU) website. The URL
for this site is www.ignou.ac.in.
IGNOU has been a
pioneer in distance education in India. It is the
recipient of the Center of Excellence in Distance
Education award, in 1993, conferred by the
Commonwealth of Learning
. It was amongst the first
universities in India to host a website. Students
(prime users) scattered geographically across the
country, find the website a forceful, reliable
platform for interaction between them and the
university. The study of usability of such a website
is relevant, as it is the most timely and reliable form
of communication between the users and university.
Usability measurement of IGNOU website was done
by employing the external usability metrics specified
in the international standard ISO/IEC TR 9126-2.
These metrics measure the extent to which a given
software product is compliant with usability
regulations and guidelines.
The standard specifies measurement of five sub-
characteristics of usability: Understandability,
Learnability, Operability, Attractiveness and
Compliance. However, we measured only the first
four, because of non-availability of compliance
standards, being followed by the university. Since
links are central to a website functionality, the term
functions is interpreted as links in the metrics.
0
2
4
6
8
10
12
Understandabilit
Learnability
Operability
Attractiveness
Metrics as per
standards
Metrics
Measured
Figure 1: Number of metrics, measured v/s specified in the
standards
Initial study of the site revealed the absence of
certain features due to which all the metrics
specified in the standards could not be measured.
Fig 1 depicts the number of metrics measured as
against the total number of metrics specified in the
international standards. Table 1 lists the 12 metrics
that were measured.
The standards specify two types of method for
measurement of metrics. In “User Test” method a
sample set of users, representative of the actual
users, are requested to use a function. In the other
method, “Test of Product in Use”, the usage of
function, during a general use of the product, is
observed. However certain functions may be hardly
used during normal use. These might not be
measured using the “Test of Product in Use”
method. Therefore we adopted the “User Test
Method” of measurement. Eight users (as per the
standards) representing the student user group were
selected. We assigned specific tasks to each of these
eight users. Measurements were taken, based on
observations made during the test session.
There are two main categories of metrics, the
Performance metrics and the Preference metrics
(Nielsen and Levy, 1994). Preference metrics
provide a quantifiable measure of the user
preferences whereas the performance metrics
provide a measure of the actual use of the system by
the user, Constantine and Lockwood (1999).
We measured the preference metric “Attractive
Interaction”, on a preferential scale (Fig 2). The
users were asked to rate the attractiveness of the site,
by the following question.
Q. How would you rate the site?
1 2 3 4 5
Least Very
Attractive attractive
Figure 2: Scale to measure the attractiveness of the site
INTERNATIONAL STANDARDS AND USABILITY MEASUREMENT
185
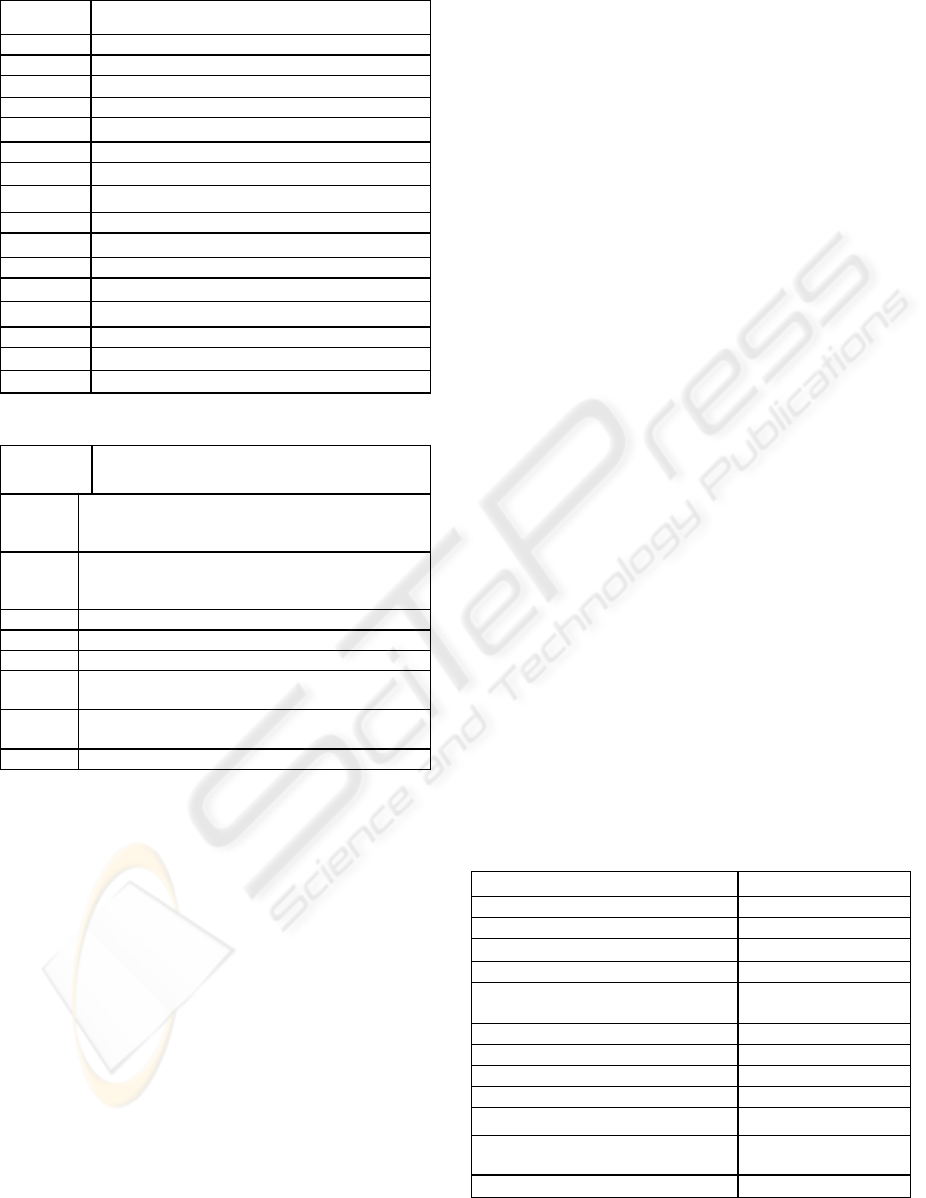
Table 1: List of metrics measured for IGNOU website
S.No Metric Name
1 Understandability
1.1 Evident functions
1.2 Function understandability
1.3 Understandable input and output
2 Learnability
2.1 Ease of Function learning
2.2 Ease of learning to perform a task in use
3 Operability
3.1 Operational consistency
3.2 Error correction
3.3 Error correction in use
3.4 Default value availability in use
3.6 Self explanatory error messages
3.8 Time between human error operations in use
4 Attractiveness
4.1 Attractive Interaction
Table 2: List of tasks designed
The performance metrics were measured by
observing the users perform a set of tasks. A survey
of the actual targeted users was done to identify the
most critical, important and frequently performed
tasks. Table 2 lists the set of tasks, which were
designed based on this survey
3 RESULTS
The mean of measures obtained while users
performed the assigned tasks, are listed in Table 3.
The absence of certain features in the website
inhibited the measurement of all metrics. Prominent
features not available in the website are the Help
facility, Demonstration capability, Customizability
and Accessibility features for physically challenged.
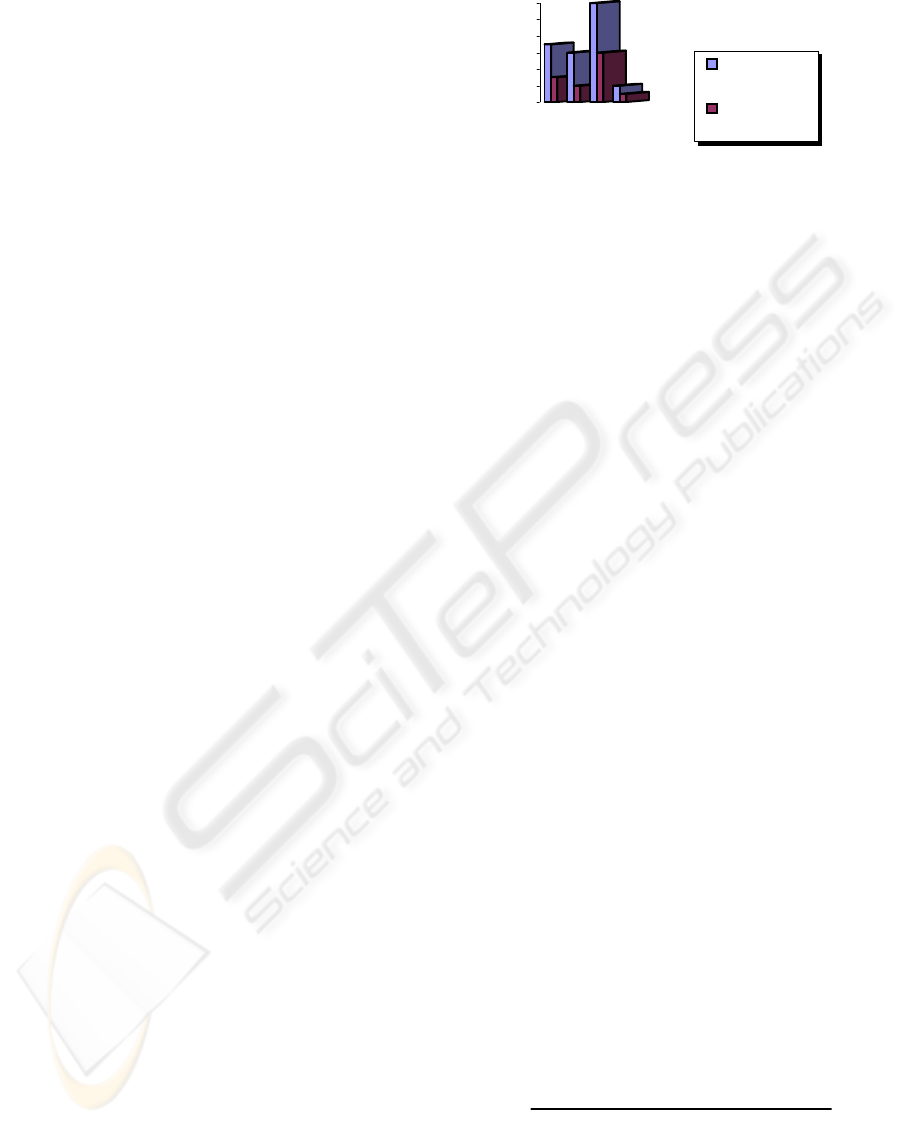
Fig 3 shows the measured values (except the time
metrics) against the value range specified in the
standards. The metric numbers as per table 1 are
specified on the X-axis (names have not been given
due to space constraint). The figure indicates that the
measures for features like input and output, default
value and self-explanatory error messages
approximate the ideal value of 1. This corroborates
that an information oriented website (Banati, Grover
2004) has limited scope for input/output and hence
default values and errors Although the users could
interpret the links (metric “Function
understandability”) the low value of metric “Evident
functions” indicated difficulty in identifying links
and hence in navigating through the website
.
Low values are recommended for metrics measuring
time, except for the metric “Time between human
error operation”. However, it is evident from table 3
that users spend a lot of time in learning to use a
function, performing task or correcting error. Users
found the site to be moderately well designed, in
terms of cosmetic appearance (a value of 3 for the
Appearance metric in Table 3). During the process
of measurement, we failed to measure the metric
“Error correction in use”. Usability of the website
was measured to be approximately 26%.
Task
number
Task
Task 1 Observe the home page and identify all the
possible links (functionalities) which website
provides
Task 2 Observe the home page and interpret the meaning
of
each link
Task 3 Get the Result for specified course
Task 4 Identify the centers at specified place
Task 5 Subscribe to E-journal
Task 6 Send complaint about non-receipt of starter kit of
course
Task 7 Check for admission announcement for Entrance
examination for year 2005
Task 8 Fill examination form for a course
4 DISCUSSION
The site under study is predominantly an
information-oriented website where the user
activities are directed towards search and/or retrieval
of information rather than input and output. Such
websites should provide for a good comprehension,
quick learning, and easy navigational facilities. The
measured values of metrics indicated that the site
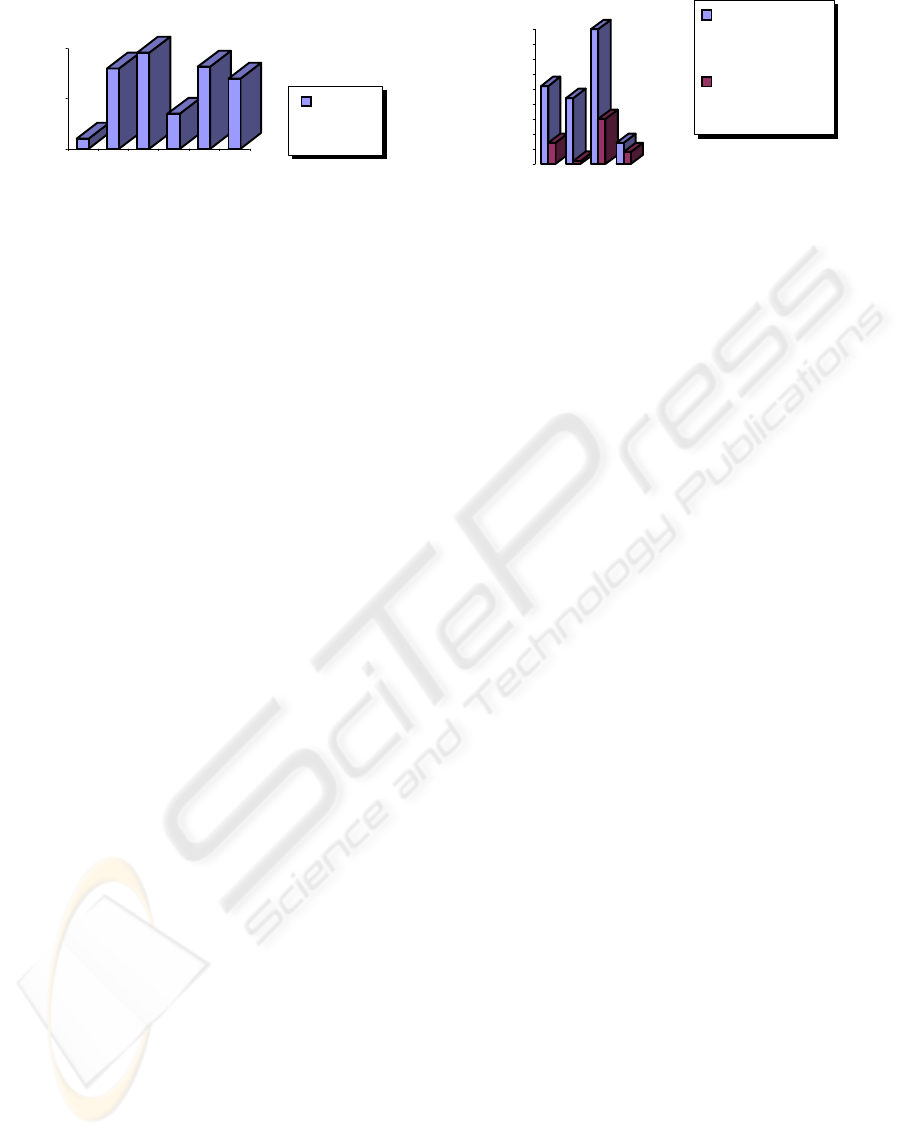
was lacking this. Fig 4 depicts the percentage level
contribution of each sub-characteristic (what it
should be as per standards v/s what it is in the
IGNOU website).
Table 3: Results
Metric Name Mean value
Evident functions 0.10
Function understandability 0.80
Understandable input and output 0.96
Ease of function learning 15.22(sec)
Ease of learning to perform a task in
use
41.52(sec)
Operational Consistency 0.35
Error Correction 15.94(sec)
Error Correction in use -----
Default value availability in use 0.82
Self explanatory error messages 0.70
Time between human error operations
in use
49.37(sec)
Attractive interaction 3
ICEIS 2005 - HUMAN-COMPUTER INTERACTION
186
0
0.5
1
1.1 1.2 1.3 3.1 3.4 3.6
Actual
Value
Obtained
Figure 3: Measured values against the standard range
The significantly low value of Learnability is
alarming. The standards mention that
Understandability is an indicator of Learnability.
However, the measurements indicate that does not
hold true for this site. This could be attributed to
non-measurement of certain metrics due to non-
availability of the relevant features in the website.
However, the metrics measured are almost in the
same ratio, as to what could have been measured
(Fig 1). The question raised is “Are the metrics, that
could not be measured, more significant than those,
that could be measured”. The issue of priority of
metrics therefore gains significance. In case certain
metrics have higher relevance than the others,
neglecting features relevant to those metrics might
be critical.
5 CONCLUSIONS
The usability of an academic website was measured
by applying international standards. The study
helped us obtain quantitative measure of usability
and it’s sub-characteristics. The standards mention
Understandability as an indicator of Learnability.
This was not corroborated by the measurement
obtained in the study. The issue of relevance and
criticality of each metric towards the total usability
of the website needs to be looked into. The case
study also exemplifies that the process of
standardizing usability measurement can help in
quantifying the amount of improvement required in
usability of a website, which cannot be achieved by
non-standardized methods. A singular study cannot
conclusively comment on this, but the question
raised is crucial, as it can influence future usability
studies. We are in the process of examining such
websites to substantiate the findings of this paper.
0
5
10
15
20
25
30
35
40
45
Understandability
Learnability
Operability
Attractiveness
Contribution level
specified by the
standards
Contribution level
found in the
website
Figure 4: Comparison of percentage contribution of
usability characteristics (Standard v/s Measured)
REFERENCES
Banati, Hema and Grover P.S, 2004.A Structured
Approach To Study Usability, National Conference on
Software Engineering Principles and Practices
Constantine Larry L and Lockwood Lucy A.D, 1999.
Software For Use: A Practical Guide to the Models
and Methods Of Usage-Centered Design, ACM Press,
New York
Corry, M.D., Frick, T.W., and Hansen, L., 1997. User-
Centered Design and Usability Testing of a Web Site:
An Illustrative Case Study. Educational Technology
Research and Development, 45, 65-76.
Dhillon, J.K, 2001.Challenges and strategies for
improving the quality of information in a university
setting: a case study. Total Quality Management, 12i2,
167.
ISO/IEC TR 9126-2:2003 Software engineering -- Product
quality -- Part 2: External metrics
Nielsen J. 1993.Usability Engineering, Boston: Academic
Press
Nielsen, J and Levy, J. ,1994. Measuring usability:
Preference vs. performance. Communications of the
ACM
, 37(4) 67-75.
Strauss, H., 2000. Techtalks. Interview conducted by
CREN.
Sushma Rao, 2002. “Application of Human-computer
Interaction Theories to Information Design on Internet
Portals” A Masters Thesis, available at
http://scholar.lib.vt.edu/theses/available/etd-
11192002-164448/unrestricted/ThesisSushmaRao.pdf
www.ignou.ac.in - Website of Indira Gandhi National
Open University
INTERNATIONAL STANDARDS AND USABILITY MEASUREMENT
187

ICEIS 2005 - HUMAN-COMPUTER INTERACTION
188
