
DECISION SUPPORT SYSTEM FOR AFFORDABLE HOUSING
Deidre E. Paris, Ph.D.
Department of Engineering,Clark Atlanta University 223 James P. Brawley Drive SW, Box 724, Atlanta, Georgia 30314
USA
Keywords: Neural Networks, Decision Support Sy
stems, Housing
Abstract: This research used neural
networks to develop a decision support system, and model the relationship
between one’s living environment and residential satisfaction. Residential satisfaction was investigated at
two affordable housing multifamily rental properties located in Atlanta, Georgia. The neural network was
trained using data from Defoors Ferry Manor and the network was validated using data from Moores Mill.
The neural network accurately categorized ninety-eight percent of the cases in the training set and ninety-
three percent of the cases in the validation test set. This research represents a first attempt to use neural
networking to model the relationship between one’s living environment and residential satisfaction.
1 INTRODUCTION
There are several challenges and complexities that
are involved in managing affordable housing
properties, including 1) social programming, 2)
meeting financial goals, 3) budgeting, 4) compliance
with governmental and local housing regulations, 5)
decreasing tenant turnover and vacancy rates, and 6)
maintaining the physical building structure. Once
provided by government funded programs and for-
profit developers, nonprofit organizations have more
recently taken on the task of housing the nations’
less privileged, lower-income households. Several
studies have examined the organizational
performance of nonprofit management properties.
One of the most recent studies suggests several
indicators for determining management
performance; one of the indicators was residential
satisfaction (Bratt et al. 1994).
Francescato, Weidemann, Anderson, and
C
henoweth proposed that people’s satisfaction with
where they lived was sufficiently important in itself
to merit examination (Francescato, Weidemann,
Anderson and Chenoweth, 1974; 1979).
Understanding the determinants of satisfaction
became the focus of their study of 37 multifamily
housing developments. They initially proposed a
model that can be interpreted as focus
ing on the affective response of residents to their
housi
ng environment. They conceived of
satisfaction, or affection for the home, as being a
function of different categories of variables: the
objective characteristics of the residents (e.g., age,
sex, previous housing experience), the objective
characteristics of the housing environments, and the
occupants’ perceptions or beliefs about three aspects
of their housing environment (e.g., the physical
environment, the housing management, and the
other residents). In conducting their study of the 37
sites, their objective was to determine predictors of
residents’ satisfaction.
Whereas Francescato, Weidemann, Anderson,
and
Chenoweth focus on the use of residential
satisfaction as a criterion, Campbell, Converse, and
Rodgers were interested in examining residents’
satisfaction as a determinant of perceived quality of
life (Campbell, Converse and Rodgers, 1976).
Marans and his colleagues indicated the importance
of including objective measures of the physical
environment in a model of satisfaction (Marans and
Rodgers, 1975).
As a result, Marans and Sprecklemeyer presented
a
conceptual model for use in the understanding of,
and guiding research on, relationships between
objective conditions, subjective experiences, and
residential satisfaction (Marans and Spreckelmeyer,
1981). This model has also been used in
conjunction with research on recreational
environments and institutional settings. More
extensive versions of this model are also in Marans’
research (Marans, 1976; Marans and Rodgers,
1975).
Work at the Institute for Social Research, has
been directed toward the degree of agreem
ent
273
E. Paris D. (2005).
DECISION SUPPORT SYSTEM FOR AFFORDABLE HOUSING.
In Proceedings of the Seventh International Conference on Enterprise Information Systems, pages 273-282
DOI: 10.5220/0002536502730282
Copyright
c
SciTePress

between perceptions of the neighborhood and
objective physical measures of the actual conditions
around them (Marans, 1976). Similarly,
Weidemann, Anderson, Butterfield, and O’Donnell
all have examined the relationship between
objective measures of attributes of homes, residents’
perceptions and beliefs about those attributes, and
residents’ satisfaction with their home environments
(Weidemann, Anderson, Butterfield and O' Donnell,
1982). As Rodgers and Converse, Craik and Zube,
Hempel and Tucker, and Snider point out, both
subjective and objective inputs are important, and
neither can be properly interpreted in the absence of
the other.
This research examines residential satisfaction
not in a context of solving any social or behavioral
problem, but to assist decision makers in the
business community. Several techniques are
traditionally used to address issues concerning
residential satisfaction ranging from multivariate to
regression analysis. This research develop a
systematic approach to predict residential
satisfaction by developing a neural network
decision support system that can assist owners in
making decisions that will meet their residents’
needs.
2 BACKGROUND INFORMATION
Residential satisfaction was investigated at two
affordable housing multifamily rental properties
located in Atlanta, Georgia named Defoors Ferry
Manor and Moores Mill. Nonprofit housing
developers, Atlanta Mutual Housing Association
(AMHA) and Atlanta Neighborhood Development
Partnerships (ANDP), respectively owns Defoors
Ferry Manor and Moores Mill.
This research used neural networks to develop the
decision support system, and to model the
relationship between one’s living environment and
residential satisfaction. A residential satisfaction
questionnaire was mailed out to residents at both
rental properties. Eighty residents from Moores
Mill and ninety-nine from Defoors Ferry Manor
responded to the questionnaire. The questionnaire
solicited residents’ responses in the following areas:
1) residents’ demographic information, 2) rental
history, rental behavior, rental intentions, residential
satisfaction, and residents’ perception of their
property meeting their needs, 3) residents’ feelings
towards rehabilitation, 4) participation in
community events, residential committees, and
social services, 5) satisfaction with property
management, 6) satisfaction with maintenance, 7)
satisfaction with community, 8) satisfaction with
housing structure, and 9) residents’ feelings of
safety and security.
3 RESEARCH APPROACH
The residential satisfaction decision support system
presented is a multilayered feedforward neural
network. The neural network is trained using
Defoors train dataset. The data is divided into two
groups: input variables and an output variable. The
inputs are the independent research variables
specified in the model; the output variable SATIS is
the dependent variable. The train dataset is made up
of data rows, which makes up a set of corresponding
independent variables and a dependent variable.
These data rows are also referred to as cases. The
decision support system is developed by first
training the neural network. Training a neural
network refers to the process of the model
“learning” the patterns in the training dataset in
order to make classifications. The training dataset
includes many sets of input variables and a
corresponding output variable. When the value of
an input variable is fed into an input neuron, the
network begins by finding linear relationships
between the input variables and the output variable.
Weight values are assigned to the links between the
input and output neurons; every link has a weight
that indicates the strength of the connection. The
weights of the network are set randomly when it is
first being trained. After all the rows of Defoors’
dataset are passed through the network, the answer
the network is producing is repeatedly compared
with correct answers, and each time the connecting
weights are adjusted slightly in the direction of the
correct answer. If the total of the errors of all cases
in the dataset is too large, then a hidden neuron is
added between the inputs and outputs. The training
process is repeated until the average error is within
an acceptable range. The errors between the
network and the actual result are reduced as more
hidden neurons are added. The network has learned
the data sufficiently when it has reached an
acceptable error and is ready to produce the desired
results, which are called classifications, for all of the
data rows. The effectiveness of neural networks is
demonstrated when the trained network is able to
produce good results for data that the network has
never seen before.
This is examined using the
trained network on Moores Mill test dataset.
The neural network output variable is SATIS
which describes residential satisfaction which
indicates residents overall living satisfaction. This
variable had four categories that respondents could
select from to describe their satisfaction level:
ICEIS 2005 - ARTIFICIAL INTELLIGENCE AND DECISION SUPPORT SYSTEMS
274

1=very dissatisfied, 2=somewhat dissatisfied,
3=somewhat satisfied and 4=very satisfied. These
categories were collapsed into two categories to
simplify the neural network model: 1 & 2=NOT
SATISFIED and 3 & 4=SATISIFIED. Thus, the
residential satisfaction train dataset is clustered into
2 categories: NOT SATISFIED and SATISFIED.
Table 1 and Table 2 provide definitions of the input
variables that were used to train the neural network.
Table 1: Input data for neural network
Variable Name Definition
SATPROMAN How satisfied residents are with the
property management staff.
TENANTPOLICIES How satisfied residents are with
property management’s tenant selection
policies.
RFAIRLY How satisfied residents are with
property management enforcing rules
fairly.
TALK How satisfied residents are with
availability of property management
staff to address residents’ concerns.
4 NEURAL NETWORK ANALYSIS
RESULTS
Table 3 below displays the network’s progress
during training. Number of hidden neurons trained
displays the total number of hidden neurons that
have been added while the net is learning. Training
the net involves adding hidden neurons until the
network is able to make good classifications.
Optimal number of hidden neurons displays the
number of hidden neurons that best solves the
classification problem. Training time is the length
of time it took for the network to learn before it was
able to make accurate classifications.
Figure 1 shows the number of hidden neurons
graphed against the percentage of correct
classifications. The vertical line between the curve
and the x-axis shows that the network needed 56
hidden neurons during training before it can make
correct classifications on the dataset.
Table 2: Input data for neural network continued.
Variable Name Definition
COOPERATIVE How satisfied residents are with
the ability of property
management staff to cooperate
with residents.
FRIENDLY How satisfied residents are with
property management level of
friendliness towards residents.
RECOMMEND
1
If residents will recommend
their apartment complex to a
friend as a place to live.
QUALLIFE
2
Residents’ quality of life after
renovations.
BLDQUALITY How satisfied residents are with
the quality of the apartment
buildings on the property.
REPAIRSQUALITY How satisfied residents are with
the quality of maintenance
repairs.
CLEANNESS How satisfied residents are with
the overall cleanliness of the
property.
COMMUNCLEAN How satisfied residents are with
the cleanliness of the community
that surrounds the apartment
complex..
SATCOM How satisfied residents are with
the community that surrounds the
apartment complex.
SAFENIGHTHOOD
3
How safe residents feel during
the night in their neighborhood.
SATMAINTEN How satisfied residents are with
the property’s maintenance staff.
SAFENIGHT
3
How safe residents feel during
the night at their apartment
complex.
SATUNIT How satisfied residents are with
their apartment units.
1
Category responses are 1=will recommend, 2=will not
recommend, and 3=do not know.
2
Category responses are 1=better off than before, 2=worse off
than before, and 3=about the same as before.
3
Category responses are 1=very unsafe, 2=somewhat unsafe,
3=somewhat safe, and 4=very safe.
Table 3: Network training information and parameters
# of input variables:
18
output variable:
SATIS
Number Of Hidden Neurons
Trained:
79
Optimal Number Of Hidden
Neurons
:
56
Training time: 49’
DECISION SUPPORT SYSTEM FOR AFFORDABLE HOUSING
275
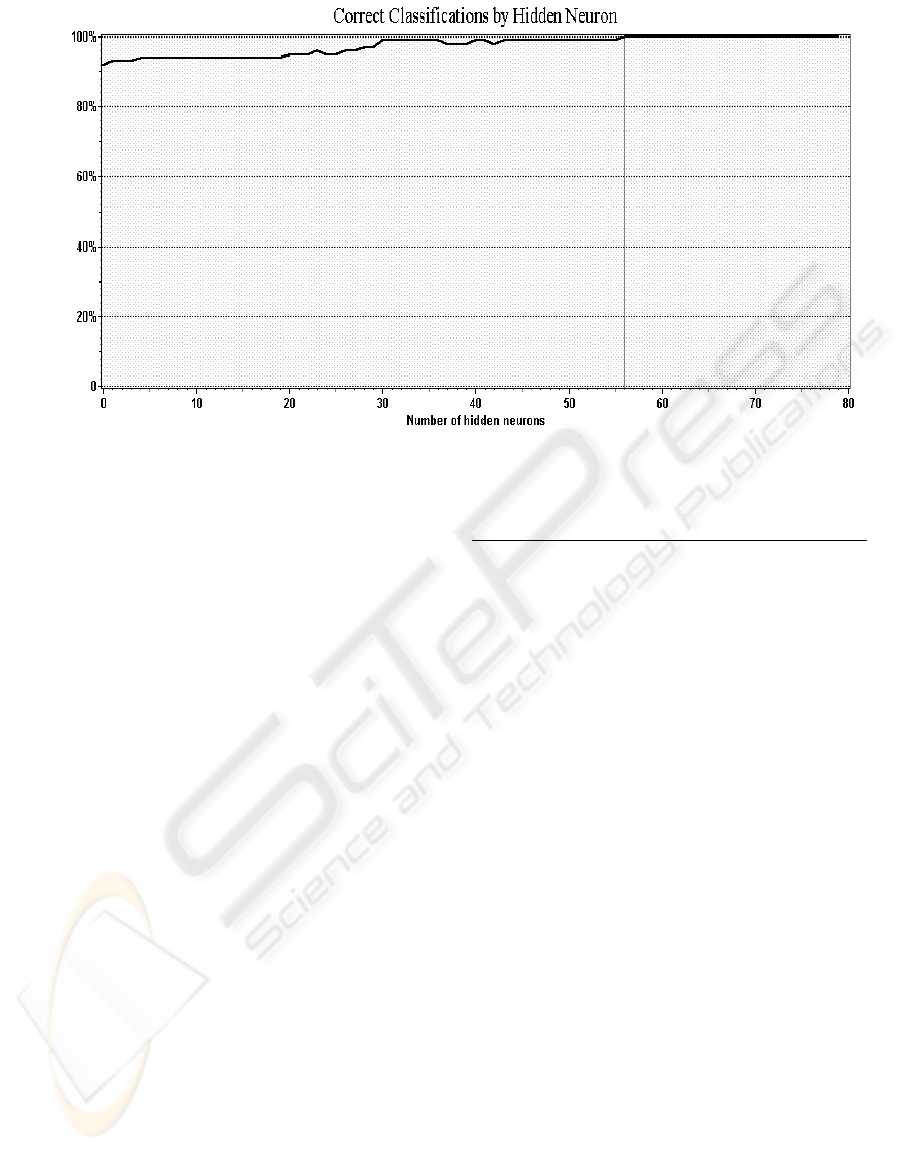
Figure 1: Graphical display of correct classifications by number of hidden neurons
4.1 Actual and Predicted Outputs
Tables 4, 5, and 6 display the actual and classified
outputs for all the data rows in the trained dataset.
This table displays results for every row in the data
file to which the net was applied. The Row #
column is the number of the row in the data file for
each example. An asterisk is displayed beside the
row number that the model makes an incorrect
classification. The Actual column displays the
category classification as it appears in the data file.
The Classified column displays the category
classification predicted by the network; the
classification is either satisfied or not satisfied. The
Not Satisf. and Satisf. columns are output
classification categories and display the network's
classification strength for each category. This value
is the neuron activation strength for each category
based on that set
of input values. This value can loosely be thought
of as a probability; the values for all categories add
up to 1. When the value is close to 1 in a category,
the network is more confident that the example set
of inputs belongs to that particular category. As
shown in the Tables 4, 5, and 6 below, there were
only 2 data rows (rows #15 & #64) that the network
classified incorrectly. These two rows were
classified as satisfied with a weight value of .998
(row #15) and .749 (row #64).
Table 4: Actual and classified outputs for all rows of
trained data
.
Row# Actual Classified Not Satisf. Satisf
1 satisf. satisf. 0.000 1.000
2 satisf. satisf. 0.003 0.997
3 not sa. not sa. 0.999 0.001
4 not sa. not sa. 0.995 0.005
5 satisf. satisf. 0.000 1.000
6 satisf. satisf. 0.000 1.000
7 satisf. satisf. 0.000 1.000
8 not sa. not sa. 0.992 0.008
9 not sa. not sa. 0.997 0.003
10 satisf. satisf. 0.000 1.000
11 satisf. satisf. 0.000 1.000
12 satisf. satisf. 0.000 1.000
13 not sa. not sa. 0.999 0.001
14 satisf. satisf. 0.000 1.000
15 * not sa. satisf. 0.002 0.998
16 satisf. satisf. 0.002 0.998
17 satisf. satisf. 0.000 1.000
18 satisf. satisf. 0.000 1.000
19 satisf. satisf. 0.000 1.000
20 satisf. satisf. 0.000 1.000
21 not sa. not sa. 0.999 0.001
22 satisf. satisf. 0.000 1.000
23 satisf. satisf. 0.000 1.000
24 satisf. satisf. 0.004 0.996
25 not sa. not sa. 0.999 0.001
*denotes a data row that was classified incorrectly
ICEIS 2005 - ARTIFICIAL INTELLIGENCE AND DECISION SUPPORT SYSTEMS
276

4.2 Agreement Matrix for Training
Network
The agreement matrix shows how the network's
classifications compare to the actual classification in
the Defoors data file in which the network was
applied. Table 7 is the agreement matrix for the
trained networking using Defoors data file. Column
labels Actual “NOT SATISFIED” and Actual
“SATISFIED” refer to the category classification in
the data file. The row labels Classified as “NOT
SATISFIED” and Classified as “SATISFIED” refer
to the network's predictions.
When the network was applied to 99 rows of
training data, there were 22 actual examples of
residents being “NOT SATISFIED”, but the
network classified 2 of those cases as “SATISFIED”
and 20 as “NOT SATISFIED”. There were 77
actual cases of residents being SATISFIED, which
the network confirmed.
Table 5: Actual and classified outputs for all rows of
trained data continued
Row# Actual Classified Not Satisf. Satisf
26 satisf. satisf. 0.007 0.993
27 not sa. not sa. 0.984 0.016
28 satisf. satisf. 0.014 0.986
29 not sa. not sa. 0.999 0.001
30 satisf. satisf. 0.001 0.999
31 satisf. satisf. 0.000 1.000
32 satisf. satisf. 0.000 1.000
33 satisf. satisf. 0.021 0.979
34 not sa. not sa. 1.000 0.000
35 satisf. satisf. 0.000 1.000
36 satisf. satisf. 0.000 1.000
37 satisf. satisf. 0.000 1.000
38 satisf. satisf. 0.000 1.000
39 not sa. not sa. 0.999 0.001
40 satisf. satisf. 0.001 0.999
41 satisf. satisf. 0.000 1.000
42 satisf. satisf. 0.000 1.000
43 satisf. satisf. 0.000 1.000
44 satisf. satisf. 0.003 0.997
45 not sa. not sa. 1.000 0.000
46 satisf. satisf. 0.000 1.000
47 satisf. satisf. 0.000 1.000
48 satisf. satisf. 0.000 1.000
49 not sa. not sa. 0.829 0.171
50 satisf. satisf. 0.018 0.982
51 satisf. satisf. 0.001 0.999
52 satisf. satisf. 0.021 0.979
53 satisf. satisf. 0.000 1.000
54 satisf. satisf. 0.045 0.955
55 satisf. satisf. 0.000 1.000
56 satisf. satisf. 0.000 1.000
57 satisf. satisf. 0.000 1.000
58 satisf. satisf. 0.000 1.000
59 satisf. satisf. 0.008 0.992
60 satisf. satisf. 0.009 0.991
61 satisf. satisf. 0.000 1.000
62 satisf. satisf. 0.000 1.000
63 satisf. satisf. 0.002 0.998
64 * not sa. satisf. 0.251 0.749
65 not sa. not sa. 0.947 0.053
66 satisf. satisf. 0.095 0.905
67 not sa. not sa. 0.790 0.210
68 satisf. satisf. 0.000 1.000
69 satisf. satisf. 0.001 0.999
70 satisf. satisf. 0.014 0.986
71 satisf. satisf. 0.000 1.000
72 satisf. satisf. 0.000 1.000
73 not sa. not sa. 0.742 0.258
74 satisf. satisf. 0.003 0.997
75 satisf. satisf. 0.000 1.000
*denotes a data row that was classified incorrectly
Table 6: Actual and classified outputs for all rows of
trained data continued
.
Row# Actual Classified Not Satisf. Satisf
76 satisf. satisf. 0.003 0.997
77 satisf. satisf. 0.066 0.934
78 satisf. satisf. 0.000 1.000
79 satisf. satisf. 0.000 1.000
80 satisf. satisf. 0.011 0.989
81 not sa. not sa. 1.000 0.000
82 not sa. not sa. 1.000 0.000
83 not sa. not sa. 0.996 0.004
84 not sa. not sa. 0.944 0.056
85 satisf. satisf. 0.000 1.000
86 satisf. satisf. 0.001 0.999
87 satisf. satisf. 0.000 1.000
88 satisf. satisf. 0.000 1.000
89 satisf. satisf. 0.001 0.999
90 satisf. satisf. 0.000 1.000
91 satisf. satisf. 0.000 1.000
92 satisf. satisf. 0.001 0.999
93 satisf. satisf. 0.000 1.000
94 satisf. satisf. 0.000 1.000
95 satisf. satisf. 0.000 1.000
96 satisf. satisf. 0.000 1.000
97 satisf. satisf. 0.016 0.984
98 satisf. satisf. 0.000 1.000
99 satisf. satisf. 0.087 0.913
4.2.1 Explanation of Classifier Statistical
Parameters
There are statistical parameters that are specific to
the classifier. They reflect the neural network
performance compared to the actual classification.
These parameters apply to each output classification
(SATISFIED and NOT SATISFIED) separately.
DECISION SUPPORT SYSTEM FOR AFFORDABLE HOUSING
277

The following classification parameters are
calculated from the comparison of the actual and
neural network classification. The neural network
classification can be considered as the predicted
classification from the network. The actual
classification can be considered as the true
classification, which comes from the Defoors train
database. Below is an explanation for the classifier
parameters for ACTUAL SATISFIED cases. When
the category is ACTUAL NOT SATISFIED, the
terms are reversed.
True-Positive Ratio (also known as Sensitivity):
is equal to the number of residents classified as
SATISFIED by the network that were actually
confirmed to be SATISFIED (77) through the
Defoors train dataset, divided by the total number of
SATISFIED (77) residents as confirmed by the
Defoors train dataset. It is also equal to one minus
the False-Negative ratio. 77/77=1.00
False-Positive Ratio: is equal to the number of
residents classified as SATISFIED by the network
that were actually confirmed to be NOT SATISFIED
(2) by the Defoors train dataset, divided by the total
number of NOT SATISFIED (22) residents as
confirmed by the Defoors train dataset. It is also
equal to one minus the True-Negative ratio.
2/22=0.09
True-Negative Ratio (also known as Specificity):
is equal to the number of residents classified as
“NOT SATISFIED” by the network that were
actually confirmed to be “NOT SATISFIED” (20)
by the Defoors train dataset, divided by the total
number of “NOT SATISFIED” (22) residents as
confirmed by the Defoors train dataset. It is also
equal to one minus the False-Positive ratio
.
20/22=0.91
False-Negative Ratio: is equal to the number of
residents classified as “NOT SATISFIED” by the
network that were actually confirmed to be
“SATISFIED” (0) by the Defoors train dataset,
divided by the total number of “SATISFIED” (77)
residents as confirmed by the Defoors train dataset.
It is also equal to one minus the True-Positive ratio.
0/77=0.00
Sensitivity and Specificity: The terms sensitivity
and specificity come from medical literature, but are
now being used for neural network classification
problems. Sensitivity and specificity are calculated
by comparing the network's results with the 99 rows
of training data for all possible output categories
(SATISFIED and NOT SATISFIED).
Sensitivity is a concept that can be thought of as
the probability that the mode will detect the
condition when it is present. Sensitivity (true
positives) equals 1 minus the number of false
negatives. Examining the column labeled Actual
SATISFIED:
Sensitivity (true positives): is equal to the number
of residents the network classifies as SATISFIED
that are also confirmed as SATISFIED by the
Defoors train dataset (77) divided by the total
number of residents confirmed as SATISFIED by the
Defoors train dataset (77). 77/77=1.00 or 100%.
This number implies that the sensitivity of the model
for satisfaction is 100.00%. Specificity is a concept
that can be thought of as the probability that the
network model will detect the absence of a
condition. Specificity (true negatives) equals 1
minus the number of false-positives. Examining the
column labeled “actual satisfied”:
Specificity (true negatives): equals the number of
residents the network classifies as NOT SATISFIED
that are also confirmed by the Defoors train dataset
as NOT SATISFIED (20) divided by the total
number of residents confirmed as NOT SATISFIED
by the Defoors train dataset (22). 20/22=.9091 or
90.91%. This number implies that the specificity of
the model for the model is 90.91%.
The calculations above for sensitivity and
specificity were for the category Actual SATISFIED.
When the category is Actual NOT SATISFIED, the
terms are reversed.
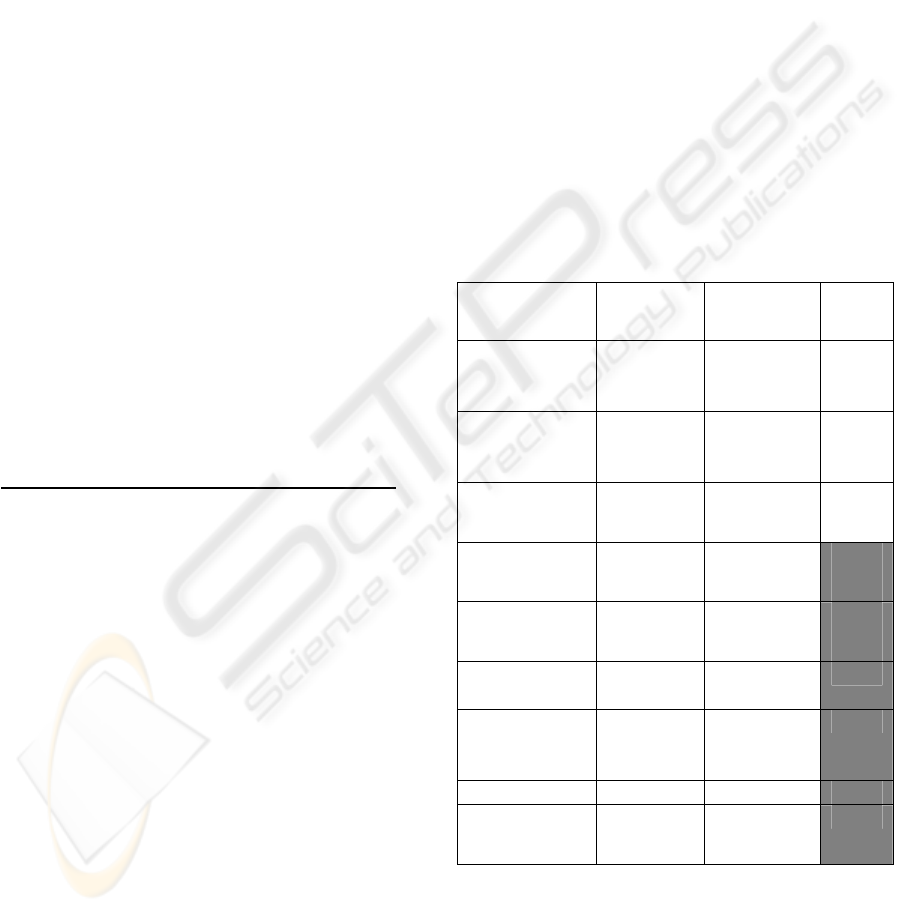
Table 7: Agreement matrix for trained network using
Defoors data file
ACTUAL
“NOT
SATISFIED”
ACTUAL
“SATISFIED”
TOTAL
Classified as
“NOT
SATISFIED”
20 0 20
Classified as
“SATISFIED
”
2 77 79
TOTAL
22 77 99
True-Positive
Ratio
0.91 1.00
False-Positive
Ratio
0.00 0.09
True-Negative
Ratio
1.00 0.90
False-
Negative
Ratio
0.09 0.00
Sensitivity
90.91% 100.00%
Specificity
100.00% 90.
91%
ICEIS 2005 - ARTIFICIAL INTELLIGENCE AND DECISION SUPPORT SYSTEMS
278

4.2.2 ROC (Receiver Operating
Characteristic Or Relative Operating
Characteristic) Curve Graphs For
Trained Network
The ROC graphs the false-positive ratio on the x-
axis and the true-positive ratio on the y-axis for each
classification category. The circle plotted on the
curve shows the intersection of the true-positive and
the false-positive ratio on the y-axis for each
classification category, and converts continuous
probabilities to binary classifications for the trained
network.
The area under the curve represents how well the
network is performing. A value close to 1 means
that the network is discriminating very well between
the different output categories. The area under ROC
curves shown in Figure 2 and Figure 3 below for
both, NOT SATISFIED and SATISIED categories,
is .9740 which implies that there is a 97.40% chance
that the network will make correct classifications.
5 VALIDATION OF NEURAL
NETWORK
After the residential satisfaction decision support
system was trained using data from Defoors train
dataset, the model was validated by running the
model on Moores Mill test data and observing how
efficient the model was in discriminating between
different output categories (NOT SATISFIED and
SATISFIED). The Moores Mill test dataset has the
same input variables and output variable as the train
dataset. There are 80 data rows in the Moores Mill
train dataset. Out of the 80 data rows, 70 residents
were SATISFIED; 10 were NOT SATISFIED. This
section will present similar model validation
statistical information that was presented on training
the network model.
5.1 Actual and Predicted Outputs
Tables 8-10 display the actual and classified outputs
for all the data rows in the test dataset. As shown
in these three tables, there were 4 rows that were
classified incorrectly: row numbers 25, 30, 46, and
63. All of these data rows were actually NOT
SATISFIED, but the network classified them as
SATISFIED. The weights that were assigned to
these rows for the SATISFIED classification were
respectively, 1.000, 0.814, 0.989, and 0.913.
Table 8: Actual and classified output for all of test data
Row# Actual Classified Not Satisf. Satisf
1 SATISF. SATISF 0.004 0.996
2 NOT SA. NOT SA. 0.905 0.095
3 SATISF. SATISF. 0.005 0.995
4 SATISF. SATISF. 0.000 1.000
5 SATISF. SATISF. 0.000 1.000
6 SATISF. SATISF. 0.003 0.997
7 SATISF. SATISF. 0.000 1.000
8 SATISF. SATISF. 0.004 0.996
9 SATISF. SATISF. 0.000 1.000
10 SATISF. SATISF. 0.001 0.999
11 SATISF. SATISF. 0.000 1.000
12 SATISF. SATISF. 0.256 0.744
13 SATISF. SATISF. 0.000 1.000
14 SATISF. SATISF. 0.000 1.000
15 SATISF. SATISF. 0.079 0.921
16 SATISF. SATISF. 0.000 1.000
17 SATISF. SATISF. 0.002 0.998
18 SATISF. SATISF. 0.000 1.000
19 SATISF. SATISF. 0.000 1.000
20 NOT SA. NOT SA. 0.590 0.410
21 NOT SA. NOT SA. 0.990 0.010
22 SATISF. SATISF. 0.000 1.000
23 NOT SA. NOT SA. 0.997 0.003
24 SATISF. SATISF. 0.001 0.999
Table 9: Actual and classified output for test data
continued
Row# Actual Classified Not Satisf. Satisf
25 * NOT SA. SATISF. 0.000 1.000
26 SATISF. SATISF. 0.000 1.000
27 SATISF. SATISF. 0.000 1.000
28 SATISF. SATISF. 0.000 1.000
29 SATISF. SATISF. 0.000 1.000
30 * NOT SA. SATISF. 0.186 0.814
31 SATISF. SATISF. 0.000 1.000
32 SATISF. SATISF. 0.000 1.000
33 SATISF. SATISF. 0.000 1.000
34 SATISF. SATISF. 0.000 1.000
35 SATISF. SATISF. 0.002 0.998
36 SATISF. SATISF. 0.000 1.000
37 SATISF. SATISF. 0.001 0.999
38 SATISF. SATISF. 0.000 1.000
39 SATISF. SATISF. 0.000 1.000
40 SATISF. SATISF 0.079 0.921
41 SATISF. SATISF. 0.001 0.999
42 SATISF. SATISF. 0.003 0.997
43 SATISF. SATISF. 0.107 0.893
44 SATISF. SATISF. 0.001 0.999
45 SATISF. SATISF. 0.000 1.000
46 * NOT SA. SATISF. 0.011 0.989
47 SATISF. SATISF. 0.009 0.991
DECISION SUPPORT SYSTEM FOR AFFORDABLE HOUSING
279
48 SATISF. SATISF. 0.000 1.000
49 SATISF. SATISF. 0.000 1.000
50 SATISF. SATISF. 0.000 1.000
51 SATISF. SATISF. 0.000 1.000
52 SATISF. SATISF. 0.001 0.999
53 SATISF. SATISF. 0.000 1.000
54 SATISF. SATISF. 0.000 1.000
55 SATISF. SATISF. 0.000 1.000
56 SATISF. SATISF. 0.007 0.993
57 SATISF. SATISF. 0.000 1.000
58 SATISF. SATISF. 0.000 1.000
59 SATISF. SATISF. 0.000 1.000
60 SATISF. SATISF. 0.000 1.000
61 SATISF. SATISF. 0.000 1.000
62 SATISF. SATISF. 0.000 1.000
63 * NOT SA. SATISF. 0.079 0.921
64 SATISF. SATISF. 0.000 1.000
65 SATISF. SATISF. 0.000 1.000
66 SATISF. SATISF. 0.000 1.000
67 SATISF. SATISF. 0.000 1.000
68 SATISF. SATISF. 0.000 1.000
69 SATISF. SATISF. 0.002 0.998
70 SATISF. SATISF. 0.141 0.859
71 SATISF. SATISF. 0.000 1.000
72 SATISF. SATISF. 0.000 1.000
*denotes a data row that was classified incorrectly
Table 10: Actual and classified output for test data
continued
Row# Actual Classified Not Satisf. Satisf
73 SATISF. SATISF. 0.001 0.999
74 SATISF. SATISF. 0.012 0.988
75 NOT SA. NOT SA 0.743 0.257
76 SATISF. SATISF. 0.000 1.000
77 NOT SA. NOT SA. 0.967 0.033
78 SATISF. SATISF. 0.000 1.000
79 SATISF. SATISF. 0.000 1.000
80 SATISF. SATISF. 0.000 1.000
the network classified 4 of those cases as
“SATISFIED” and 6 as “NOT SATISFIED”. There
were 70 actual cases of residents being
“SATISFIED”, which the network confirmed. A
true-positive ratio of 1.00 and a false-positive ratio
of .40 were given for the actual SATISFIED
classification. The sensitivity which is also refer to
as true positive is 100% which implies that there is a
100% chance that the network will detect when a
resident is satisfied. On the other hand, the actual
NOT SATISFIED classification has a true-positive
ratio of .6 and a false- negative ratio of 0.0. The
sensitivity for the actual NOT SATISFIED
classification is 60% or .6 (false-positive), which
means that there is a 60% probability that the
computer will detect that the resident is not satisfied.
The ratio values and the percentages for
sensitivity for Actual “Satisfied” and specificity for
Actual “Not Satisfied” are the same for Tables 7 and
11. However, the network misclassified 4 data
rows that were actually NOT SATISFIED but
classified as SATISFIED which explains the 60%
for specificity.
5.2 Network Agreement Matrix for
Validating Network
Table 11 is the agreement matrix for validating the
network model using Moores Mill data file. When
the
network was applied to 80 rows of data, there were
10 actual cases of residents being “NOT
SATISFIED”, but
Table 11: Agreement matrix for validating network using
Moores Mill data file
.
ACTUAL
“NOT
SATISFIED”
ACTUAL
“SATISFIED”
TOTAL
Classified as
“NOT
SATISFIED”
6 0 6
Classified as
“SATISFIED
”
4 70 74
TOTAL 10 70 80
True-Positive
Ratio
0.60 1.00
False-Positive
Ratio
0.00 0.40
True-Negative
Ratio
1.00 0.60
False-
Negative
Ratio
0.40 0.00
Sensitivity 60.00% 100.00%
Specificity 100.00% 60.00%
5.3 ROC for Validating Neural
Network
Figure 4 and Figure 5 represent the ROC curves for
the validation data for the network model. As
ICEIS 2005 - ARTIFICIAL INTELLIGENCE AND DECISION SUPPORT SYSTEMS
280
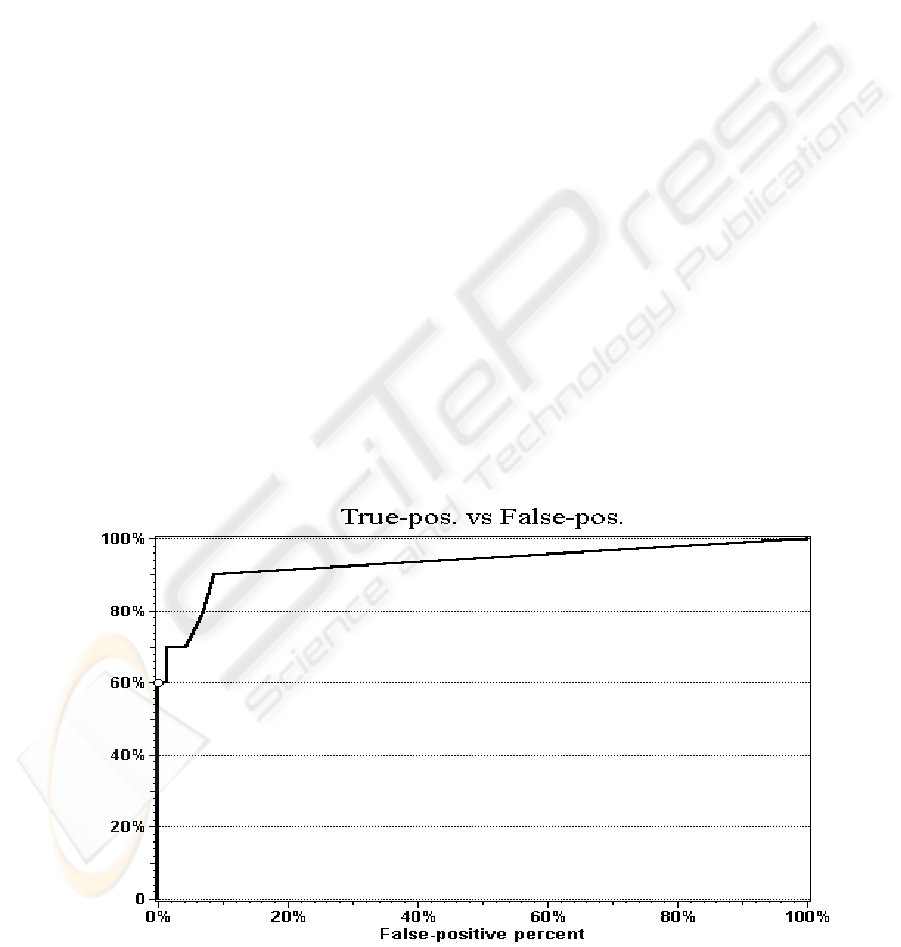
mentioned in section 4.3, the circle plotted on the
curve shows the intersection of the true-positive and
the false-positive ratio on the y-axis for each
classification category, and converts continuous
probabilities to binary classifications for the trained
network. The area under the curve represents how
well the network is performing. A value close to 1
means that the network is discriminating very well
between the different output categories. The area
under the curves in Figure 4 and 5 is 0.9307. This
implies that the overall effectiveness of the network
is in discriminating between different output
categories when validating the trained network is
93.07%.
6 CONCLUSIONS
As housing issues continue to grow as we move
further into the 21
st
century, decision makers are
faced with challenging decisions. Many of these
decisions are made either through intuition, past
experience, or ineffective traditional approaches.
Making appropriate decisions commonly entails risk
control and management. Although decision makers
have some control over the levels of risks to which
they are exposed, reduction of risk needs to be
pursued by housing agencies to decrease costs and
use resources efficiently. Housing policy makers
are required, with increasing frequency, to
subjectively weigh benefits against risks and assess
associated uncertainties when making decisions.
Such risk-based decisions require uncertainty
modeling and analysis. Neural networks are
mathematical models that emulate the processes
people use to recognize patterns, learn tasks, solve
problems, and address such uncertainty.
In conclusion, this research developed a
residential satisfaction decision support system that
can assist owners in making decisions that will meet
their residents’ needs. The system is based on
neural networks. Residential satisfaction was
investigated at two affordable housing multifamily
rental properties located in Atlanta, Georgia named
Defoors Ferry Manor and Moores Mill. Nonprofit
housing developers, Atlanta Mutual Housing
Association (AMHA) and Atlanta Neighborhood
Development Partnerships (ANDP), respectively
own Defoors Ferry Manor and Moores Mill
The neural network was trained using Defoors
Ferry Manor data, and it took 49 seconds to train the
network. Seventy-nine hidden neurons were
trained. The neural network was applied to 99 data
rows used to train the network. Ninety-seven of
those rows were classified correctly and 2 rows were
classified incorrectly. The ROC (Receiver
Operating Characteristic) graph showed the
efficiency of the network, and it was concluded that
the network was 97.40% effective in making correct
classifications.
Figure 4: ROC for NOT SATISFIED classification test data.
DECISION SUPPORT SYSTEM FOR AFFORDABLE HOUSING
281
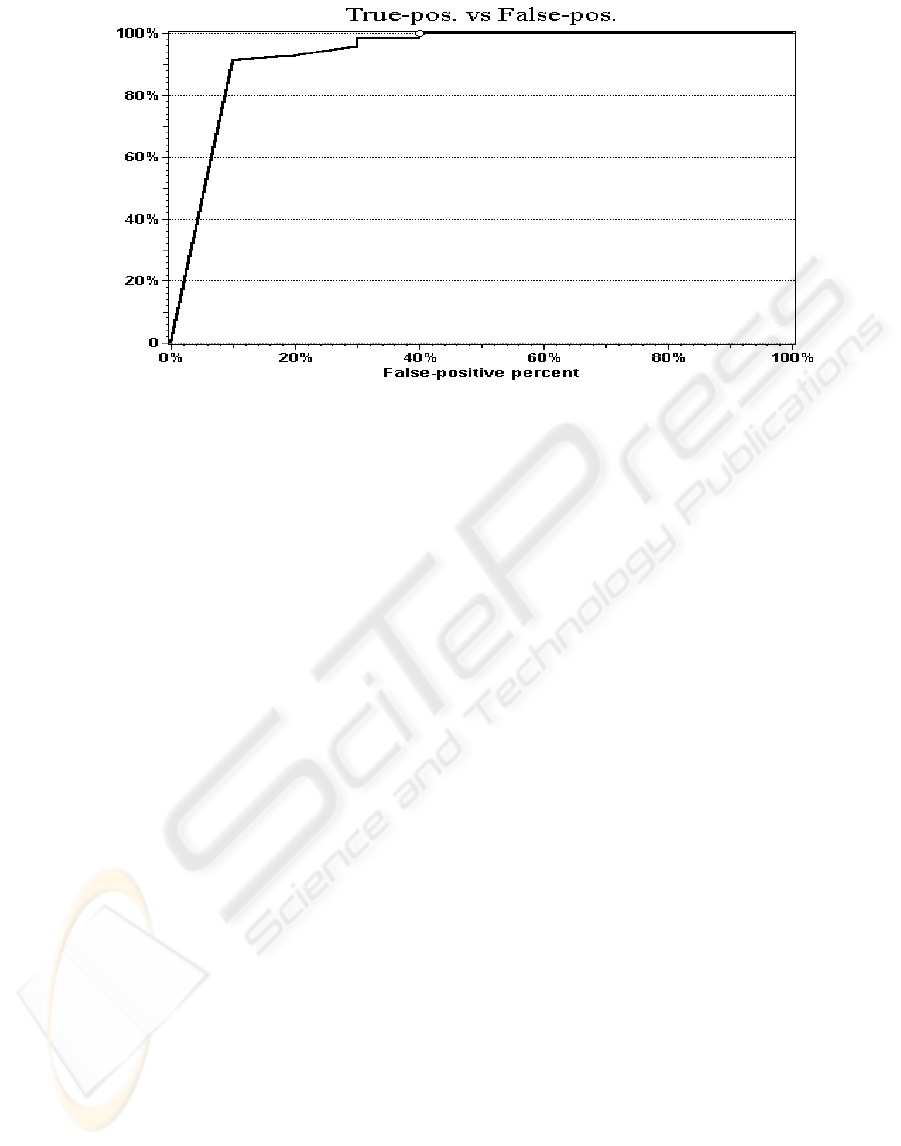
Figure 5: ROC for SATISFIED classification test set
The network was trained using data from
Defoors trained data set; afterwards, the network
was validated by running the network on Moores
Mill test data and observing how efficient the
network was in discriminating between different
output categories. The Moores Mill test dataset has
the same input variables and output variable as
Defoors. There were 80 data rows in the Moores
Mill train dataset. Out of the 80 data rows, 4 rows
were classified incorrectly. When the network was
applied to 80 rows of the data, there were 10 cases
where residents were “NOT SATISFIED”; but the
network classified 4 of those cases as
“SATISFIED”.
The statistics related to the network’s
performance were that there was a 100% chance that
the network will correctly predict a resident is
satisfied. On the other hand, the specificity of the
network for the actual SATISFIED classification
was 60%, which means that there is a 60% chance
that the computer will detect when the resident is not
satisfied. The network’s overall effectiveness in
discriminating between different output categories
when validating the network was 93.07%.
REFERENCES
Bratt, R. G., L.C. Keyes, A. Schwartz, and A.C. Vidal,
1994, Confronting the Management Challenge:
Affordable Housing in the Nonprofit Sector,
Community Development Research Center Graduate
School of Management and Urban Policy New School
for Social Research.
Campbell, A., Converse, P. E., and Rodgers, W. L. , 1976.
The Quality of American Life, Russell Sage
Foundation, New York.
Francescato, G., Weidemann, S., Anderson, J. R., and
Chenoweth, R., 1974. "Evaluating Residents'
Satisfaction In Housing For Low and Moderate
Income Families: A Multi-Method Approach." Man-
Environment Interactions: Evaluation and
Applications, D. H. Carson, ed. Environmental Design
Research Association, Washington, D.C., 285-296.
Francescato, G., Weidemann, S., Anderson, J. R., and
Chenoweth, R., 1979. Residents' Satisfaction in HUD-
Assisted Housing: Design and Management Factors,
U.S. Department of Housing and Urban Development,
Washington, D.C.
Marans, R. (1976). "Perceived Quality of Residential
Environments: Some Methodological Issues."
Perceiving Environmental Quality: Research and
Applications, K. H. Craiks and E. H. Zube, eds.,
Plenum Press, New York, 123-147.
Marans, R., and Rodgers, W. L., 1975). "Toward An
Understanding Of Community Satisfaction."
Metropolitan America In contemporary Perspectives,
A. Hawley and V. Rock, eds., Halsted Press, New
York, 299-352.
Marans, R., and Spreckelmeyer, K. F., 1981. Evaluating
Built Environments: A Behavioral Approach,
University of Michigan, Institute for Social Research
and The Architectural Research Laboratory, Ann
Arbor.
Weidemann, S., Anderson, J. R., Butterfield, D. I., and O'
Donnell, P., 1982. "Residents' Perceptions of
Satisfaction and Safety: A Basis for Change In
Multifamily Housing." Environment and Behavior,
14(6), 695-724.
ICEIS 2005 - ARTIFICIAL INTELLIGENCE AND DECISION SUPPORT SYSTEMS
282
