
PERFORMANCE MEASUREMENT AND CONTROL IN
LOGISTICS SERVICE PROVIDING
Elfriede Krauth, Hans Moonen
Rotterdam School of Management, Department of Decision and Information Sciences
Erasmus University Rotterdam, Burg. Oudlaan
50, P.O.Box 1738, 3000 DR, Rotterdam, The Netherlands
Viara Popova, Martijn Schut
Department of Computer Science, Faculty of Sciences
Vrije Universiteit Amsterdam, De Boelelaan 1081a, 1081 HV, Amsterdam, The Netherlands
Keywords: Key Performance Indicators (KPI), Plann
ing Systems, Logistics Service Providers, System Development
Abstract: Output of a planning process is a set of assigned individual tasks to resources at a certain point in time.
Initially a manual job, however, in the past decades information systems have largely overtaken this role,
especially in industries such as (road-) logistics. This paper focuses on the performance parameters and
objectives that play a role in the planning process. In order to gain insight in the factors which play a role in
designing new software systems for Logistical Service Providers (LSPs). Therefore we study the area of
Key Performance Indicators (KPI). Typically, KPIs are used in a post-ante context: to evaluate a company’s
past performance. We reason that KPIs should be utilized in the planning phase as well; thus ex-ante.
The paper describes the extended literature survey that we performed, and introduces a novel framework
that captures the dynamics of competing KPIs, by positioning them in the practical context of an LSP. This
framework could be valuable input in the design of a future generation of information systems, capable of
incorporating the business dynamics of today’s LSPs.
1 INTRODUCTION
Planning is the process of assigning individual tasks
to resources at a certain point in time. Originally,
planning was a manual task, performed by a human
planner. Over the last decades information systems
have increasingly taken over this role in industries
such as road-logistics; in practice however the
human planner has still a considerable role. In order
to make the transition from planning input to
planning output, a planning system – manual or
computerized – must employ the proper objectives
to derive to an optimal planning. To gain insight in
this area, we consider the Key Performance
Indicators (KPI) literature. KPIs are typically used in
a post-ante context: to evaluate the past performance
of a company. We reason that KPIs could be utilized
in the planning phase as well; ex-ante.
The research question we pursue with this paper
is: Whi
ch are the performance indicators that have
an impact on operational performance of logistics
service providers? We briefly describe the Logistics
Service Providers (LSP) industry and shortly
introduce the KPI field (section 2). Then, we
undertake a literature review in the areas of supply
chain management and LSPs (section 3). Building
upon, we compose a framework for logistical KPIs,
considering a multi-dimensional and multiple
stakeholder perspective (section 4). Section 5 covers
validation. Future research directions and
conclusions are discussed in section 6.
2 LOGISTICS SERVICE
PROVIDERS AND KPI’S
The increasing focus on core competencies opened
up many business opportunities for Logistics Service
Providers (LSPs) (Christopher, 1998). LSPs, often
239
Krauth E., Moonen H., Popova V. and Schut M. (2005).
PERFORMANCE MEASUREMENT AND CONTROL IN LOGISTICS SERVICE PROVIDING.
In Proceedings of the Seventh International Conference on Enterprise Information Systems, pages 239-247
DOI: 10.5220/0002536102390247
Copyright
c
SciTePress

also referred to as Third Party Logistics Service
Providers (3PLs), carry out the logistic activities for
one or more companies within the supply chain;
functioning as an intermediary (Lai et al., 2004). The
functions of 3PLs or LSPs can be divided in:
warehousing, transportation, customer service, and
inventory and logistics management (Sink et al.,
1996), (Vaidyanathan, 2005).
Logistics service providing is an industry under
great pressure. Margins are small, and therefore
LSPs continuously seek for opportunities to make
their business more profitable. That can be, for
example, by scaling up or expanding their activities
outside their home country (Lemoine et al. 2003).
Planning and control is crucial for the operations
of an LSP: both for the day-to-day operations as well
as the more long-term strategic objectives. A good
insight in performance information and therewith
steering mechanisms for planning is important.
Historically, companies concentrated on financial
indicators. Nowadays it is widely recognized that
non-financial and even non-numerical indicators can
give valuable information as well (Brewer et al,
2000, Ittner et al., 2003). Such indicators though are
more difficult to measure and compare.
Selecting the right indicators for measuring (and
steering!) however is rather complicated. A full set
of indicators could result in a huge amount of data
which would require a lot of efforts and high costs
both in acquiring and analyzing. Another difficulty
is that it is not uncommon that the selected
indicators turn out to be conflicting – improving one
may worsen another.
Performance indicators are to a large extent
domain specific. Our research focuses on the area of
third-party logistics. But even here no unique subset
of indicators can be selected. The choice is company
specific and depends on the goals, state and
orientation of the company. Therefore it is
worthwhile to first concentrate efforts on providing
aid in the selection process. The existing literature
on performance measurement in logistics provides a
large number of potentially useful indicators.
3 LITERATURE REVIEW
KPIs are used to evaluate the past performance of a
company: making it possible to compare
performance with previous periods of measurement,
or industry standards or even individual competitors.
Consequently, any logistical system should try to
optimize and steer its decisions to the metrics it later
shall be evaluated upon. A clear insight into the
factors that drive logistical operations provides us
with adequate planning objectives.
In this paper, we review the different theories
and empirical findings known in literature on KPIs
in (road-) logistics. We specifically include elements
such as the multi-dimensionality of companies
(several hierarchical planning levels as well as
relevant business functions per company), general
business performance versus individual order
performance, and the principles of supply chain
management (steering a chain of companies versus
solely steering one’s own company). Note that the
perception of performance is relative: cost efficiency
may be one of the important measures for an LSP,
still this might not be what the shippers and
consignees desire – they would instead prefer high
quality and low price (Lai et al., 2004).
In the literature we identified two major
perspectives. First, there is a clear split between
performance indicator related research that focuses
on internal operations of an individual firm, versus
literature that takes the supply chain perspective and
seeks to optimize inter-organizational performance.
For one exception we refer the reader to Gibson et
al. (2002), which compared how shippers and
carriers rank service. The second perspective relates
to the use of performance indicators; in general the
indicators are used either at the strategic level, for
performance evaluation, or at the highly operational
level, for planning and control. In the next sections
we review the different sources of literature.
3.1 Supply chain performance
LSPs are specialists in supply chain management,
and are generally well aligned with the type of
supply chain they serve. Fisher (1997) makes a split
between efficient and responsive supply chains.
Christopher et al. (2002) make a similar distinction
into lean and agile. Weber (2002) is using a
hierarchical model to measure supply chain agility.
The Supply-Chain Operations Reference-model
(SCOR) offers a model with standards to describe
supply chains (SCOR, 2003). Measurements which
can be used to measure efficiency or leanness of
LSPs include fill rate of delivery plans, empty-to-
loaded backhaul mile index, equipment utilization
rates (hours), equipment utilization rates, vehicle
maintenance costs. Metrics to measure
responsiveness or agility include export shipment
processing time, delivery performance to customer
requested date, customs clearance time.
A strong partnership emphasizes direct, long-
term collaboration, encouraging mutual planning
and problem solving efforts.
Another important point is the use of information
systems (Sander, et al. 2002); as well as the type of
systems. Information systems support the integration
ICEIS 2005 - ARTIFICIAL INTELLIGENCE AND DECISION SUPPORT SYSTEMS
240

of inter-organizational processes (Hammer, 2001).
For an LSP information systems revolve around four
major players: the LSP’s customer, the customer’s
clients, the customer’s suppliers and alliances, and
the LSP provider itself (Vaidyanathan, 2005). Ross
(2002) shows that IT investment can have a positive
impact on market performance as a result of better
coordination in the value chain. However, putting
such a high level of collaboration into practice is not
easy. Both information quality and relationship
commitment play an important role (Moberg et al,
2002). As Kemppainen et al. (2003) suggest; it is
neither feasible nor profitable to have strong
collaboration with all supply chain partners. LSPs
should select key customers and focus on these
relationships. This then might result in different
types of inter-organisational systems: hierarchies
and/or markets (Graham et al., 1994), (Toni et al,
1994), (Lewis et al, 2000).
3.2 Performance management from
an internal company perspective
Whereas supply chain performance evaluation can
take many identities as has been shown above,
researchers agree on internal measurement, cost
calculation and performance evaluation methods.
Company-centred performance management focuses
on the measurement and evaluation of decision
making on company performance.
In the 1990s Van Donselaar et al. (1998)
performed a large-scale study in the transportation
and distribution sector in the Netherlands. They
focused on logistics performance from the
provider’s point of view – where they make a
division between distribution and transportation.
Their findings include the attractiveness of long trips
for long-distance transportation (which might be
influenced in the order-intake process). Furthermore
they show that a lower percentage of empty miles
(of total miles driven) leads to better results. Finally,
combining (international) shipments might be
beneficial, though it consumes more handling time.
UPS executive Peter Bromley (2001) lists the big
five KPIs important for UPS Logistics: on-time
receiving, on-time shipping and delivery, order
accuracy, inventory accuracy, returns cycle time.
Although low costs are important for UPS, the
perfect customer experience (through a perfect
service) seems to direct its business processes; for
other LSPs this may be different.
Similar findings were reported by Menon et al
(1998) who list the most important factors relevant
for customers in their selection of an LSP. Most
important are: speed and reliability, loss and damage
rate and freight rates (tariffs).
Delivery performance can be measured by on-
time delivery. This determines whether a perfect
delivery has taken place or not, it thus measures
customer service. Stewart (1995) identifies the
following as the measures of delivery performance:
delivery-to-request rate, delivery-to-commit date,
order fill lead-time and goods in transit. Quality and
the way the information is exchanged determine the
delivery performance to a large extent; possible
performance indicators are: number of faultless
invoices, flexibility of delivery systems to meet
particular customer needs. Measures of customer
service and satisfaction are flexibility, customer
query time, and post transaction measures of
customer service. See (Fowkes et al. 2004) for a
discussion on the reasons for delay and how
reliability and predictability is valued in industry.
Mentzer et al. (1991) study performance
evaluation in logistics. They identify a list of
performance measures in five sub-areas of logistics.
They differentiate between: labour measures
(loading, driving, general labour), cost measures,
equipment measures, energy and transit-time
measures.
Closely related to performance management, are
modern accounting methods, such as Activity Based
Costing (ABC) (Pirttila et al., 1995; Themido et al.,
2001). ABC differs from traditional cost accounting
by tracing costs to products according to the
activities performed on them. ABC has gained
acceptance within manufacturing; however, most
companies have not yet extended ABC to logistics
operations. In theory, the application of ABC within
an LSP would make it possible to trace costs to
specific orders, customers, or supply channels.
3.3 Planning levels
A company is usually divided into the levels
strategic, tactical and operational. Gunasekaran et al.
(2001) assigned metrics to the appropriate
management level. Van Donselaar et al. (1998)
distinguish between segments, which are marked by
the different services that are offered to customers.
The relevant costs on segment level were variable
costs (fuel, tyres, maintenance, etc.), direct costs
(depreciation, insurance, leasing, etc.) and driver
wages.
Lohman et al. (2004) perceive performance
measurement systems as process control systems. If
there is discrepancy between the actual and desired
value of a metric, knowledge about the behaviour of
the organization is used to modify the process. At
the tactical or strategic level the control loop is used
to evaluate the operational level and adjust its goals.
PERFORMANCE MEASUREMENT AND CONTROL IN LOGISTICS SERVICE PROVIDING
241

3.4 Measuring the un-measurable
It is compelling to note that most literature focuses
on numerical factors such as: cost, time, faults, IT
utilization. Environmental factors, customer
perceptions, employee happiness, et cetera are
hardly covered in logistical performance indicator
literature. An exception is the balanced scorecard
which provides a formalized mechanism to achieve a
balance between non-financial and financial results
across short-term and long-term horizons and is
based on the notion that companies have to aim at a
true integration of marketing, production,
purchasing, sales and logistics (Brewer et al., 2000).
The balanced scorecard distinguishes four main
perspectives (Kaplan et al., 1992): customer,
internal, financial, innovation and learning. The
managers need to create their own version of the
balanced scorecard and concentrate on the most
critical measures.
Knemeyer, et al. (2003) study the perspective of
a customer. If the customer perceives that the LSP
focuses on the interaction between the companies
and is concerned with winning and keeping the
customer, the relationship can be strengthened.
Stank et al. (2003) examine how relational,
operational and cost performance relate to customer
satisfaction, loyalty and market share.
The internal business perspective translates the
customer perspective into what the company must
do in order to meet its customer’s expectations. But
the targets for success keep changing; and thus
innovation is needed. For LSPs innovations can
include additional activities, regions, transport
modes and communication systems e.g. RFID or
WebServices (Chapman et al., 2003, Lemoine et al.,
2003). Financial indicators measure if the
company’s strategy, implementation and execution
contribute to bottom-line improvement.
4 OUR FRAMEWORK
The literature overview presented in the previous
section supports the view that a new framework for
performance indicators can be beneficial in the area
of third party logistics. We consider different points
of view (both internal and external) on the
company’s performance. Figure 1 presents the
general scheme of our framework. On the horizontal
axis we separate the different viewpoints
corresponding to the parties involved. The internal
point of view is represented by the two parties
within the company – management and employees.
The external point of view shows the perspective of
the customer and the society.
The motivation for including four different
points of view comes from the fact that in many
cases they will be conflicting and, in order to
achieve a balance, the management should be aware
of the needs and desires of all parties involved.
Consider for example the prices for the logistics
services the company offers. Increasing the price
will bring more profit which is desirable for the
company. The customer, however, prefers low
prices. The society on the other hand is clearly not
so concerned with prices alone but more with the
economic climate as a whole, e.g. how to increase
the competition, fight monopolies, etc. Employees
are in general not so concerned with the prices but
with their work conditions. Another example would
be labour efficiency. Management is interested in
maximum utilization of labour which, without
applying restrictions, will lead to overexploitation.
This naturally comes in conflict with the point of
view of the employees. The society might be
concerned with cases of overexploitation on a large
scale that leads to drastic increases in accidents,
strikes disrupting traffic or health insurance issues.
The vertical axis in Figure 1 divides the
performance indicators in long-term and short-term.
This distinction has been previously used in other
research (e.g. Gunasekaran et al, 2001) and is
accepted as a meaningful division that the decision
makers find applicable. Short term indicators can
be measured for example within the period of a
month. The final choice of short term indicators
depends on organizational strategy and
measurements costs. For instance, an organization
aiming at maximizing its total number of driven
kilometers would want to report this on a daily basis.
Progress in information and communication
technology might lower costs for more granular
measurements. Long term performance indicators
are measured over longer periods of time.
The classification discussed so far is very
general. It incorporates all relevant points of view
but does not provide structure within these
viewpoints. Thus we extend it in this direction. An
extra extension has been added for the management
point of view, the KPI scheme has been further split
in four categories; see the lower part of Figure 1.
The reason for only enriching the management point
of view is that we expect it to accumulate a richer
collection of indicators where further refinement
will be necessary. We differentiate between the
following four categories:
Effectiveness – Effectiveness measures the
capability of producing an intended result. It thus
concerns the ‘outside’ of the organization – what
results does the organization achieve?
Efficiency – Efficiency is the measurement for
producing results taking into account used resources.
ICEIS 2005 - ARTIFICIAL INTELLIGENCE AND DECISION SUPPORT SYSTEMS
242
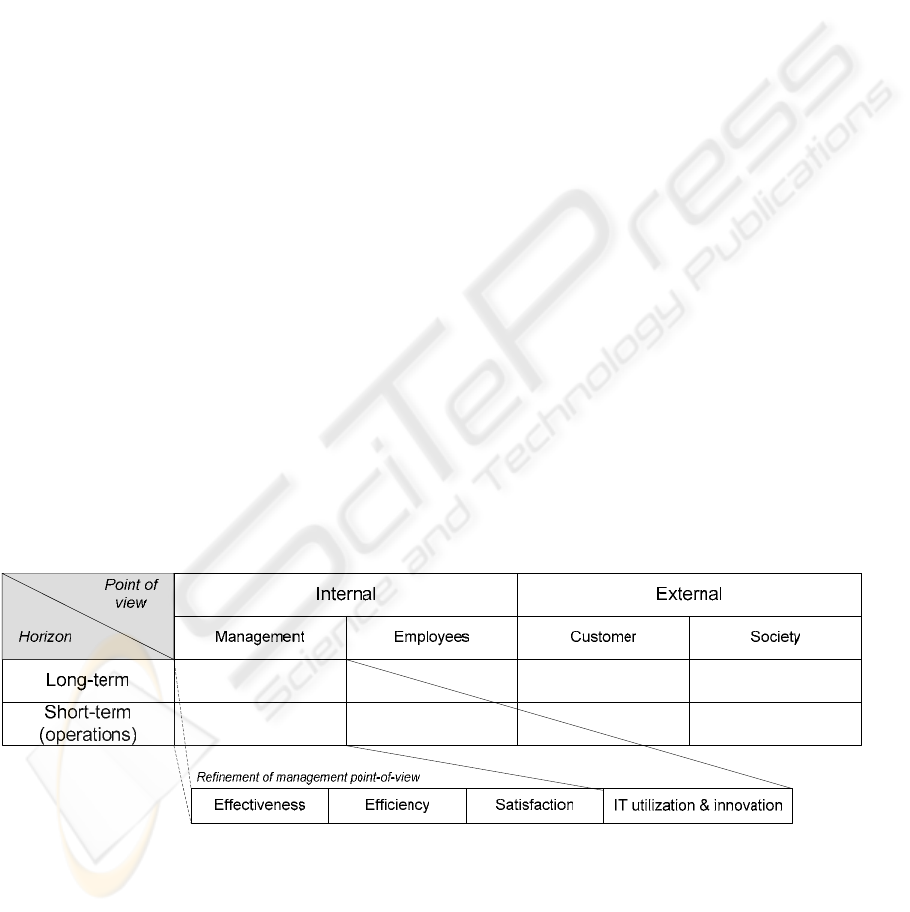
It thus refers to the ‘inside’ of the organization –
how does the organization achieve its results? We
may also say that efficiency measures the ratio
between input and output.
Satisfaction – Satisfaction represents the human
factor in our model. All organizational achievements
may be optimal regarding effectiveness and
efficiency, the people in the organization should still
be able to do their work to some degree of
satisfaction. In this way, it makes the performance
optimization problem of the organization more
constrained.
IT and innovation – An organization must also
be concerned with its future performance. As such,
innovation and IT utilization are indispensable
factors for measuring long term performance. An
organization that is working optimal now may not be
the best tomorrow if it does not take its own
circumstances into reconsideration constantly.
We applied this framework to our extensive
collection of performance indicators; for results see
Table 1.
5 FRAMEWORK EVALUATION
We present here preliminary validation results
although validation is at the time of writing not yet
completed. We conducted an expert interview to
cross-validate our model with feedback from
industry. We plan to conduct field studies with two
LSPs (i.e. with management and planners). After
finishing our evaluation, we intend to use the
framework and its indicators in the development of a
new agent-based software system for road-logistics
planning.
5.1 Expert interview
The interviewee prepared for the interview by
reading a draft version of this article, i.e. the
literature review, and the definition part of the
framework. The semi-structured interview lasted for
one-and-a-half hours. The interviewer started with a
short introduction. He explained in ten minutes what
the purpose was of this interview, what has been
done so far, and what future plans were.
Furthermore he made clear why especially this
interviewee was selected. Over the next seventy-five
minutes, the interviewee gave his vision on
performance measurement and performance
indicators. His thoughts were guided by twenty
years of logistical industry experience. At the end of
the interview, the interviewer used five minutes to
summarize the points discussed in the interview,
which were confirmed by the interviewee. The
results of the interview are presented below, in Table
2; it contains a summary of the most relevant aspects
discussed during the interview; before publication it
was checked with the interviewee.
Figure 1: High-level framework to cluster KPI’s relevant for LSPs
PERFORMANCE MEASUREMENT AND CONTROL IN LOGISTICS SERVICE PROVIDING
243

Table 1: List of clustered performance indicators for LSPs
Internal perspective - Management point of view
Effectiveness
Revenue ↑
Profit margins ↑
Capacity utilization ↑
Km per day ↑
Labour productivity ↑
Price ↑
Turnover per km ↑
Number of deliveries ↑
Benefit per delivery ↑
Trips per period ↑
Perfect order fulfilment ↑
Total number of orders ↑
Number of customers ↑
Number of new customers ↑
Number of regular customers ↑
Number of profitable customers ↑
Continuous improvement, rate ↑
Product range ↑
Plan fulfilment ↑
Total loading capacity (for trucks) ↑
On-time delivery performance ↑
Long term plans availability / development ↑
Market share width ↑
Number of markets that have been penetrated ↑
Successful contacts – % of successful deals out of the initial offers ↑
Effectiveness of distribution planning schedule ↑
% of orders scheduled to customer request ↑
% of supplier contracts negotiated meeting target terms and
conditions for quality, delivery, flexibility and cost ↑
Competitive advantage ↑
Efficiency
Total distribution cost ↓
Labour utilization ↑
Overhead percentage ↓
Overtime hours ↓
% Absent employees ↓
Salaries and benefits ↓
Controllable expenses ↓
Non-controllable expenses ↓
Customer service costs ↓
Order management costs ↓
Inventories ↓
Number of trucks in use ↑
Total delivery costs ↓
Average fuel use per km ↓
Average delivery re-planning time ↓
Marketing costs ↓
Failure costs ↓
Prevention costs ↓
Appraisal/Inspection costs ↓
% of failed orders ↓
% of realized km out of planned km ↑
Performance measurements costs ↓
Human resource costs ↓
Variable asset costs ↓
Fixed asset costs ↓
Information system costs ↓
Overhead/management/administrative costs ↓
Quality of delivery documentation per truck/driver ↑
Effectiveness of delivery invoice methods ↑
% orders / lines received with correct shipping documents ↑
% product transferred without transaction errors ↑
Item/Product/Grade changeover time ↓
Order management costs ↓
Supply chain finance costs
↓
Total supply chain costs ↓
Total time in repair (for trucks) ↓
Ratio of realized orders vs. requested orders ↑
Average delivery planning time ↓
Satisfaction
Attrition of drivers ↓
Morale, motivation of personnel
↑
On-time delivery performance ↑
Number of customer complains ↓
Overall customer satisfaction ↑
% of orders scheduled to customer request ↑
Overall employees satisfaction ↑
Overall society satisfaction ↑
IT and innovation
Information system costs ↓
Up-to-date performance
information availability ↑
Utilization of IT equipment ↑
IT training costs ↓
Number of new products in the range ↑
% of information exchange through IT ↑
% of employees with IT training ↑
Availability of IT equipment ↑
% of information management assets used / production assets ↑
% of invoice receipts and payments generated via EDI ↑
Average time for new products development ↓
Average costs for new product development ↓
Internal perspective – Employee’s point of view
Km per trip ↓
Working conditions ↑
Weight to (un)load per labour hour ↓ Salaries and benefits ↑
External perspective – Customer’s point of view
Transportation price ↓
Insurance price ↓
Primary services price ↓
Goods safety ↑
Product variety ↑
Response time ↓
Transparency for a customer ↑
Possible types of communication ↑
Available types of goods insurance ↑ Order
size flexibility ↑
Timeliness of goods delivery↓
Services variety ↑
Order configuration flexibility ↑
Possibility to change order details ↑
Additional services price (priority transportation) ↓
Contact points (number of people to contact) ↓
External perspective – Society’s point of view:
Level of CO2 emission ↓
Society satisfaction ↑ Wasting
resources ↓
Recycling level ↓
Employees satisfaction ↑
Disaster risk ↓
Solid particles emission ↓
Taxes to the national treasury ↑
Participation in charitable actions ↑
Reputation of a company ↑
Road maintenance costs ↓
Number of available work places ↑
Competition level among similar companies ↑
Care for animals/children around ↑
Use of innovation technologies ↑
Development of innovation technologies ↑
Cooperation with other companies ↑
ICEIS 2005 - ARTIFICIAL INTELLIGENCE AND DECISION SUPPORT SYSTEMS
244

Table 2: Expert Interview
In traditional Operations Research (OR), operations are often rated and optimized upon a small set of parameters only –
sometimes only one single parameter. This results however in non-optimal system behaviour. Consider the example of
empty-kilometer minimization. This optimization often results in trucks standing still, waiting for a next order (preferably
with a starting point equal to the place of waiting). Trucks do not anticipate on the next order (in a more fruitful region).
Often waiting time does cost money as well – the driver needs to be paid and the truck could have been utilized for other
purposes. Reviewing single optimization parameters can hardly be seen separate from other indicators, as the following
indicates: Let us consider an LSP that has a truck driving around with only one small package – so, it uses only 5% of its
carriage capacity – utilizing a very inefficient route, with lots of detours. It is however not driving around empty – so from
an empty-miles perspective this truck operates very effective. Although we do realize that the truck could have carried more
cargo, and the route it took could have been more efficient. However, we do not know yet whether the customer is actually
paying for this trip – because if so, no LSP would mind to have a truck driving around via an inefficient route, with only
little cargo as long as the customer is paying a good price.
Not all indicators do have a direct translation in costs, or financial measurements, but do translate in, for example, extra
appreciation from the customer. An interesting example is Cehave – a Netherlands based organization active in the agri-
business. When delivering feed products to farmers, farmers prefer and value it to be the first farm on the delivery-
roundtrip, since with each extra visit (between Cehave’s plant, and the farm) the risk on animal diseases and infections
rises. The paradox however is that, although farmers prefer the service of being the first customer, they are not willing to
pay for this service.
Agility is more-and-more required for LSPs business operations. It is very important to have a flexible business
infrastructure, capable of quickly reacting and adapting to changes in operations: new orders, re-routing of a truck, or
handling changes in the environment (such as a traffic jam). Therefore quick react capabilities are of true importance;
measuring these however is a complex matter.
Planning systems targeted at such industries could well be build by using agent technology, and dynamic systems
(control) structures; utilizing measurement and reaction mechanisms to derive to smart decisions. [We] believe that smart
local decision making, making the right decisions at the right moment and right place are likely to result in well behaving
planning systems. Feedback plays an important role in such systems. Performance measurement should not only look at the
parameter as such, but also at the way those parameters change (and behave) over time – thus be aware of the first or second
derivative of the function as well.
The framework as presented in this paper is very interesting. It is finally an attempt to have a complete scheme, looking
beyond just financial indicators, and especially dedicated for the logistical industry. It measures more than solely costs, like
it also captures perceptions (of management, customers, employees at different levels, et cetera). A very useful division is
the split between the strategic, tactical, and operational time-domains. It might furthermore help in overcoming problems in
supply chains that want to assess chain wide performance. However, some adjustments and generalizations might be
needed.
Critical notes on the work include: a subdivision/refinement as was made for the classification of the management
point-of-view (see Table 2) should be made for all the categories as mentioned in the framework, thus including employees,
customer and society as well. Therewith the framework becomes three-dimensional. Be aware that optimal, does not mean
the same to all companies. Optimal for one company, can be far from optimal for another company.
Interesting aspect of the presented work is that it could serve as a tool that makes performance indicators, and therewith
system-control a discussable issue in an organization – which would be a real valuable tool to evaluate current systems, and
to design future systems. The true advantage of this approach is that it could be relatively easy translated into an agent-
based software system. With software agents monitoring and controlling single performance indicators, and steering upon
these.
6 CONCLUSIONS
The contribution of this paper is twofold. Firstly, we
present a literature survey on the concept of
performance indicators in logistics. Secondly, we
present a framework capturing the dynamics of
performance indicators for LSPs including an
extensive list of LSP performance indicators.
The literature survey identifies a number of
studies on performance measurement/evaluation for
logistics. However, these studies are mainly on a
particular area or case and are focused on external
and quantitative indicators. Our review has
considered the areas of supply chains, internal
company performance, planning and qualitative
indicators.
The framework that we present is a first step
towards our long term aim to use performance
indicators ex-ante rather than post-ante. The model
considers indicators along two main dimensions. On
PERFORMANCE MEASUREMENT AND CONTROL IN LOGISTICS SERVICE PROVIDING
245

the one hand we look at the perspective: internal
(management, employees) and external (customer,
society); on the other hand we classify indicators as
short-term or long-term. We identify the cost of
measurement of an indicator as essential in choosing
whether an indicator is eligible for pre-ante
monitoring and analysis. We have validated our
framework with a domain expert, and have planned
multiple case-studies and interviews for validation
as future work.
Other directions for future work include
obtaining more insight in the relationships between
the indicators as well as the relationships between
indicators on different aggregation levels. The
knowledge gained will be applied in the DEAL
project – which aims at the development of an
agent-based software system for road-distribution
planning. In such a system we represent the involved
logistical parties as agents operating within a multi-
agent system. In order to give the agents the proper
decision objectives, insight in logistical KPIs is
needed. Finally, we are currently developing a
formal language for expressing the relationships
between the indicators and reasoning about these,
drawing inspiration from the field of requirements
engineering.
ACKNOWLEDGEMENTS
This work is part of DEAL (Distributed Engine for
Advanced Logistics) supported as project
EETK01141 under the Dutch EET programme. For
this particular paper we are very grateful for the
contributions of Jos van Hillegersberg, Peet van
Tooren, Jan Treur, Steef van de Velde, and Pinar
Yolum.
REFERENCES
Brewer, P. C. & Speh, T. W. (2000). Using the balanced
scorecard to measure supply chain performance.
Journal of Business Logistics 21(1):75-93.
Bromley, P. (2001). A Measure of Logistics Success.
Logistics Quarterly 7(3).
Chapman, R. L., C. Soosay, Kandampully, M. (2003).
"Innovation in logistics services and the new business
model." International Journal of Physical Distribution
and Logistics Management 33(7): 630-650.
Christopher, M (1998) Logistics and Supply Chain
Management: strategies for reducing cost and
improving service 2nd Edition. Financial Times /
Prentice-Hall, London.
Christopher, M., & Towill, D. R. (2002). Developing
Market Specific Supply Chain Strategies. International
Journal of Logistics Management, 13(1): 1-14.
Donselaar, K. v., Kokke, K. and Allessie, M. (1998).
Performance measurement in the transportation and
distribution sector. International Journal of Physical
Distribution & Logistics Management 28(6): 434-450.
Fisher, M. L. (1997). What is the Right Supply Chain for
your Product? Harvard Business Review
(March/April): 105-116.
Fowkes, A. S., P. E. Firmin, et al. (2004). How Highly
Does the Freight Transport Industry Value Journey
Time Reliability - and for What Reasons?
International Journal of Logistics - Research and
Applications 7(1): 33-43.
Gibson, B. J., S. M. Rutner, et al. (2002). Shipper-carrier
partnership issues, rankings and satisfaction.
International Journal of Physical Distribution and
Logistics Management 32(8): 669-681.
Graham, T. S., dougherty, P. J., & Dudley, W. N. (1994)
The long term strategic impact of purchasing
partnerships. International Journal of Purchasing and
Materials Management, 32(4): 797-805.
Gunasekaran, A., Patel, C. and Tirtiroglu, E. (2001).
Performance measures and metrics in a supply chain
environment. International Journal of Operations &
Production Management 21(1/2): 71-87.
Hammer, M. (2001). The superefficient company.
Harvard Business Review 79(8): 82.
Ittner, C. D., & Larcker, D. F. (2003) Coming Up Short on
Nonfinancial Performance Measurement. Harvard
Business Review, 81(11): 88-96.
Kaplan, R. S., & Norton, D. P. (1992). The Balanced
Scorecard - Measures that Drive Performance.
Harvard Business Review 75(2): 70-79.
Kemppainen, K. and A. P. J. Vepsaelaeinen (2003).
Trends in industrial supply chains and networks.
International Journal of Physical Distribution and
Logistics Management 33(8): 701-719.
Knemeyer, A. M., Corsi, T. M., & Murphy, P. R. (2003).
Logistics outsourcing relationships: Customer
perspectives. Journal of Business Logistics, 24(1):77-
110.
Lai, K.H., Ngai, E.W.T., Cheng, T.C.E. (2004), An
empirical study of supply chain performance in
transport logistics, International Journal of
Production Economics 87: 321-331.
Lemoine, W. and L. Dagnaes (2003). Globalisation
strategies and business organisation of a network of
logistics service providers. International Journal of
Physical Distribution and Logistics Management
33(3): 209-228.
Lewis, I., Talalayevsky, A. (2000). Third-Party Logistics:
Leveraging Information Technology. Journal of
Business Logistics; 21, 2: 173-185
Lohman, C., Fortuin, L., Wouters, M. (2004). Designing a
performance measurement system: A case study.
ICEIS 2005 - ARTIFICIAL INTELLIGENCE AND DECISION SUPPORT SYSTEMS
246

European Journal of Operational Research 156:267-
286.
Menon, M.K., McGinnis, M.A., Ackerman, K.B. (1998).
Selection Criteria for Providers of Third-Party
Logistics Services: an Exploratory Study, Journal of
Business Logistics 19(1): 121-137
Mentzer, J. T. and Konrad, B. P. (1991). An efficiency /
effectiveness approach to logistics performance
analysis. Journal of Business Logistics 12(1): 33-62.
Moberg, C. R., B. D. Cutler, et al. (2002). Identifying
antecedents of information exchange within supply
chains. International Journal of Physical Distribution
and Logistics Management 32(9): 2002.
Pirttila, T., Hautaniemi, P. (1995). Activity-based costing
and distribution logistics management, International
Journal of Production Economics 41: 327-333.
Ross, A. (2002). A multi-dimensional empirical
exploration of technology investment, coordination
and firm performance. International Journal of
Physical Distribution and Logistics Management
32(7): 591-609.
Sanders, N. R. and R. Premus (2002). IT Applications in
Supply Chain Organizations: a Link between
Competitive Priorities and Organizational Benefits.
Journal of Business Logistics 23(1): 65-83.
Sink, H. L., Langley Jr., C. J., & Gibson, B. J.(1996).
Buyer observations of the US third-party logistics
market. International Journal of Physical Distribution
& Logistics Management, 26(3): 38-46.
SCOR (2003); Supply-Chain Operations Reference Model
– SCOR Version 6.0; April 2003.
Stank, T. P., Goldsby, T. J., et al. (2003). Logistics service
performance: estimating its influence on market share.
Journal of Business Logistics 24(1): 27-55.
Stewart, E. (1995) Supply chain performance
benchmarking study reveals keys to supply chain
excellence, Logistics Information Management, 8(2):
38-44.
Themido, I., Arantes, A., Fernandes, C., Guedes, A.P.
(2000). Logistics costs case study – an ABC approach,
Journal of the Operational Research Society 51:1148-
1157.
Toni, A. D., Nissimbeni, G., & Tonchia, S. (1994). New
trends in supply environment. Logistics Information
Management, 7(4): 41-50.
Vaidyanathan, G. (2005). A Framework for Evaluating
Third-Party Logistics, Communications of the ACM,
January 2005 48, 1: 89-94
Weber, M. M. (2002). Measuring supply chain agility in
the virtual organization. International Journal of
Physical Distribution and Logistics Management
32(7): 557-590.
PERFORMANCE MEASUREMENT AND CONTROL IN LOGISTICS SERVICE PROVIDING
247
