
A METHODOLOGY OF FORECASTING DEMANDS OF THE
COMMUNICATION TRAFFIC
Masayuki Higuma
NEC Corporation
5-7-1 Shiba Minato-KU Tokyo, Japan
Masao J.Matsumoto
Kyusyu Sangyo University, Japan
2-3-1 Shoukoudai Higashi-KU Fukuoka, Japan
Keywords:
Modeling,Framework,Demand forecast,Statistical analysis, society , economy, Simulation.
Abstract:
The Traffic demand of the communication has strong relations to the gross domestic product (GDP). Some
statistical models are well known for the demand forecast. As such models, there are the Linear regression
Model (LM) and the Auto Regression model (AR). However the LM cannot apply analyzing a traffic demand,
because its relations between a GDP and a traffic demand have the non linear shape. Also the AR has problems
,which cannot reflect the impact of social and economical events ,and have big forecasting errors, because a
traffic demand has a trend component. Therefore this study considers new a methodology of forecasting
demands of the communication traffic, which has high quality by resolving the above problems, by modeling
and evaluating social and economical events.
1 INTRODUCTION
In recent years, skills of the demand forecast are more
important for telecommunication operator companies.
The mistake of judgements on their investments can
be made by errors of forecasting. Then we study new
a methodology of forecasting demands of the commu-
nication traffic, for solving such problems.
The traffic demand of the communication has
strong relations to the gross domestic product (GDP).
Some statistical models are well known for the de-
mand forecast. As such models, there are the Lin-
ear regression Model (LM) and the Auto Regression
model (AR)(Nakazawa, 2004). However the LM can-
not apply analyzing traffic demands, because its re-
lations have the non linear shape. Also the AR has
problems ,which cannot reflect the impact of social
and economical events ,and has big forecasting er-
rors, because a traffic demand has a trend component.
Therefore this study considers new a demand forecast
model of traffic demands, which has high quality by
resolving the above problems, by modeling and eval-
uating social and economical events.
Our model has a parameter evaluated impacts of eco-
nomical and social events, and forecasts traffic de-
mands with a GDP and such evaluated parameters.
However our study does not aim at predicting social
and economical events. Also, this study aims at im-
plementing on a system forecasting the traffic demand
with information technologies, however this is only
our private work.
Firstly, this article describes well known models and
merits of this study. Secondly, our “K model” and “K
parameter” is presented. Thirdly, this article analyzes
that traffic demands are driven by the GDP growth
and social and economical events. Fourthly, this ar-
ticle shows that these events can be evaluated with
the content analysis(Janis, 1965)(Krippendorf, 1980),
and an evaluated score has strong correlations to a K
parameter. Finally, conclusions and future study is-
sues are described.
2 WELL KNOWN
METHODOLOGIES
As statistical analyzing correlations between quan-
titative variables, there are the Auto Regression
Model (AR) and the Linear Regression Model
(LM)(Nakazawa, 2004) which can be applied fore-
casting traffic demands. The AR and the LM has the
next weak points for forecasting traffic demands.
1. The AR has the next problems.
(a) There are big errors forecasted traffic demands,
482
Higuma M. and J.Matsumoto M. (2005).
A METHODOLOGY OF FORECASTING DEMANDS OF THE COMMUNICATION TRAFFIC.
In Proceedings of the Seventh International Conference on Enterprise Information Systems, pages 482-485
DOI: 10.5220/0002528104820485
Copyright
c
SciTePress

when targeted variables contain trend compo-
nents.
(b) The impact of social and economical issues can-
not be reflected.
2. The LM has the next problems.
(a) There are big errors forecasted traffic demands
with the LM, because a correlation between the
traffic demand and the Real GDP has a non linear
correlation.
(b) Forecasting with the LM must be computed over
the available section, then a forecasted traffic de-
mand has no reliability.
Whereas, our new methodology can be reflected the
impact of social and economical events, and will have
smaller errors even if traffic demands contain trend
components.
3 PRESENT OUR MODEL FOR
THE DEMAND FORECAST
This section describes our new model of forecasting
communication traffic demands.
Our model for the demand forecast is defined as the
next equations.
x(i) = x(i − 1) + K(i)Z(i) (1)
K(i) =
X
j
G(e
ij
) (2)
i = 1, 2, . . . , n (3)
The above equation (1) is differential equation.
x(i) is a future value of x, x(i − 1) is a 1 order
past values of x(i), and K(i) means the liveliness of
the society, and is reflected the impact of social and
economical events. In the equation(2), the function
G(e
ij
) evaluates social and economical events e
ij
shown every events e
j
on every periods i. Also in the
equation(1), K(i) is called “K parameter”, because
the society in English means “syakai“ in Japanese,
then we get “K” in spelling of “syakai“. And, by the
same reason, this new model shown as the equation(1)
and equation(2) is called “K model”. Also, Z(i) is the
growth of the Real GDP.
In this K model, a future value x(i) is computed with
a 1 order past traffic x(i − 1) and a K parameter K(i)
and an economical growth Z(i). Also, K(i) is com-
puted with the equation(2), and the function G(e
ij
)
evaluates social and economical events. The function
G(e
ij
) is defined as the next formulas.
G(e
ij
) =
X
k
a
k
g
k
(e
ij
) (4)
The g
k
(e
ij
) means evaluating some aspects
1
k of
e
ij
with the content analysis(Janis, 1965)(Krippen-
dorf, 1980) and the text data mining(Hearst, 1999).
Also a
k
means weighted coefficients. The value of
K(i) increases and decreases by happening social and
economical events e
ij
with the equation(2) and the
equation(4). For example, K decrease by happening
fear events (eg.. the terrorism, the remarkable rise of
the crude oil), and increase by happening relief events
(eg..Olympic Games, the stabilization of the society).
4 EVALUATION
This section describes evaluating the above men-
tioned K model. This evaluation is used the telephone
switching traffic data and GDP data in the USA, be-
cause these data can be gotten easily. Such traffic data
is opened on the Internet during past 20 years.
Thus, we analyse a Dial Equipment Minutes
(DEM) of the Incumbent Local Exchange Carriers
(ILEC)(FCC, ) and the Real GDP chosen from the
National Economic Accounts(BEA, ) in the United
States of America (USA), from 1980 to 2002. Also
targeted K model is built on the R(TheR, 2004).(see
the next section)
4.1 Simulation
This section describes a simulation for the equation(1)
of the above mentioned K model on the R(TheR,
2004) shown as the next paragraph. At this simula-
tion, this K model is simulated from 1980 to 2001.
And a K parameter (shown as Fig.1) is computed and
assumed with a Real GDP and a DEM. By using this
K parameter, simulated DEM (shown as Fig.2)with
the R program (shown as the next paragraph) is good
matched to the real DEM. In this figure, the line is
simulated DEM, and the “x“ is the real DEM. Thus
we can describe past trends with this K parameter. It
is important to study relations among this K parame-
ter and events.
> Kmodel < − function(n){
+ for (i in 2:n){
+ Y [i] < − Y [i − 1] + K.ts[i] ∗ dGDP.ts[i]
+ }
+ return(Y )
+ }
4.2 Survey
This section describes surveying relations between
the K parameter and events which contain social and
1
eg..how widespread on the map, how deep impact on
the psychology
A METHODOLOGY OF FORECASTING DEMANDS OF THE COMMUNICATION TRAFFIC
483
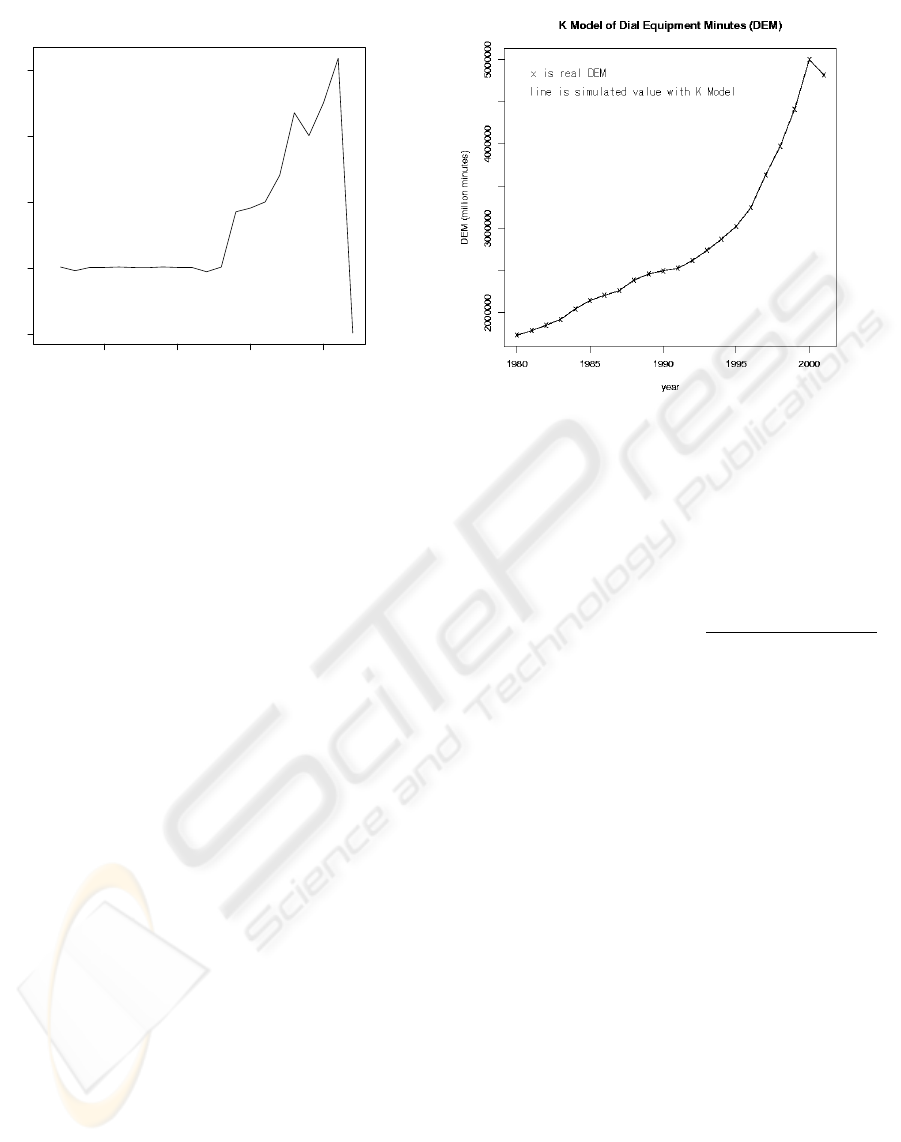
The K parameter on the K model in this evaluating
year
K (minutes/dollars)
1985 1990 1995 2000
−20 0 20 40 60
Figure 1: The assumed K parameter on the K model in this
evaluating.
economical events. On this survey, we focus the rela-
tion among such K parameter and events gotten from
the Wikipedia(Wikipedia, ) at every years (Table.1).
Where, the information of these events is shown from
1982 to 1994, and written as the keyword only, be-
cause there is not enough space left for this article.
Also, dollar amounts of the ∆RealGDP on this ta-
ble is shown in million; ∆ means the differential op-
eration. Similarly, traffic amounts of the ∆DEM is
shown in million minutes, and amounts of the K (this
is K parameter) is shown in minutes per dollars.
By analysing these data, it is discovered that the posi-
tion of the K is moved by the social and economical
events, then the DEM which is a communication traf-
fic demand is moved too.
4.3 Evaluation of social and
economical events
In this section, it is verified that these events can be
evaluated with the content analysis(Janis, 1965)(Krip-
pendorf, 1980), and evaluated score has strong corre-
lations to the above K parameter.
Firstly, it is selected that some news of social
and economical events on the Wikipedia(Wikipedia,
) from 1980 to 2001. Such selected news are labeled
and weighted with two aspects:how wide spread on
the map (SOM), how deep impact on the psychology
(IOP). A SOM is weighted this way: 5 - in the world
wide, 4 - in the EU and USA, 3 - in the USA, 2 - on
the state in the USA, 1 - on the region except in the
USA, 0 - does not impact in the USA. Also, an IOP
is weighted this way: 5 - strong liveliness impacts,
Figure 2: The simulated DEM (shown as “line”) with the K
model in this evaluating.
0 - neutral, -5 deep fearful impacts. Then, the next
equation is evaluated with the score of such SOM and
IOP.
´
K(i) =
X
j
G(e
ij
), G(e
ij
) =
P
k
SOM
kj
· IOP
kj
25
(5)
An evaluated score
´
K(i) (this means a K para-
meter) is computed with equation(5). This results is
shown at Table.1.
Secondly, the correlation between the above evalu-
ated score
´
K(i)) and the assumed K parameter K(i)
statistically. Now the “null hypothesis” is assumed
that the above correlation coefficient is zero. And
it is tested with statistical test method that such null
hypothesis is rejected. As a result, the probability
of the above null hypothesis is 4.958e
−07
, and the
correlation coefficient is 0.87 with the peason test
method(Nakazawa, 2004). Otherwise, the probabil-
ity of the above null hypothesis is 0.002788 , and the
correlation coefficient is 0.64 with the speaman test
method(Nakazawa, 2004). Then the above null hy-
pothesis is rejected.
5 CONSIDERATION
Firstly, as mentioned earlier, it is shown that the po-
sition of the communication traffic demand is moved
by the social and economical events.
Also, some characteristics are distinguished from
the trend of ∆RealGDP , ∆DEM , K, and social
ICEIS 2005 - INFORMATION SYSTEMS ANALYSIS AND SPECIFICATION
484
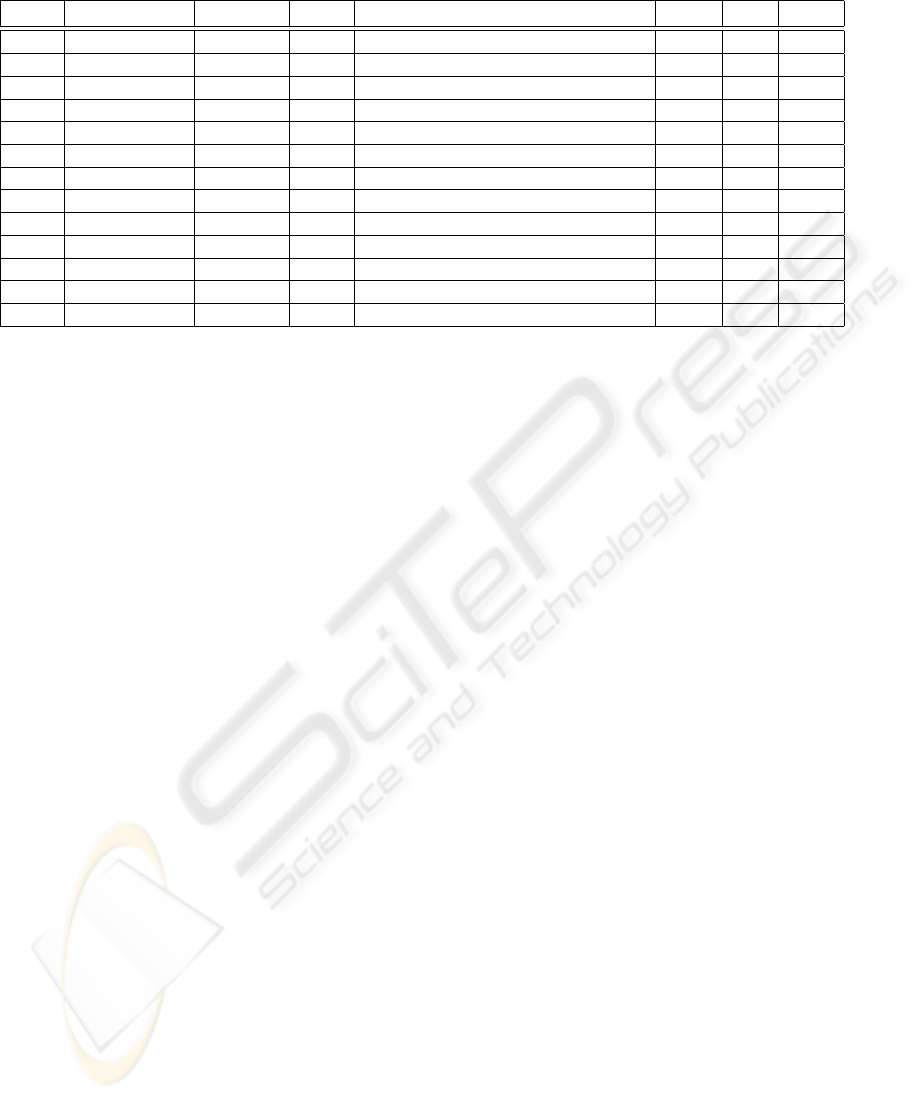
Table 1: Relations among the K parameter and events
year ∆RealGDP ∆DEM K Events SOM IOP
´
K
1982 -100975 65000 -0.46 The Falklands War 1 1 0.48
1983 212421 70000 0.33 the ’Star Wars 4 2 0.32
1984 372930 123000 0.33 Los Angeles Olympic 4 2 0.32
1985 212294 100000 0.47 Creation of Domain Name System 4 3 0.48
1986 195566 61000 0.31 Space Shuttle Challenger explodes 3 -2 -0.24
1987 200284 55000 0.27 Black Monday 4 -3 -0.48
1988 255612 124000 0.49 Canada & US FTA 4 2 0.32
1989 223272 74000 0.33 Tiananmen Square, Peking 1 -5 -0.2
1990 116196 37600 0.32 Iraq invades Kuwait 4 -3 -0.48
1991 -31570 30300 -0.96 Iraq accepts cease-fire 5 3 0.6
1992 203779 90600 0.44 Aid Famine Relief In Somolia 4 3 0.48
1993 182184 121100 0.66 Internet in CBC TV 4 4 0.64
1994 284943 134300 0.47 800,000 Rwandans were killed 1 -3 -0.12
and economical events shown these Tables (Table.1).
Such characteristics are shown the next list.
1. If ∆RealGDP < 0 then If K < 0 then ∆DEM is
increased.
(a) The Falklands War from March to June 1982.
(b) ENDED: Iraq accepts cease-fire 1991.
2. If ∆RealGDP > 0 then ∆DEM is moved by the
K
(a) from 1983 to 1990.
(b) from 1992 to 2000.
3. If ∆RealGDP > 0 then If K < 0 then ∆DEM is
decreased.
(a) Sept. 11 attacks on the World Trade Center.
Hence, we can point out the next issues from the
above results. If relief events have happened, the K
parameter increases. Otherwise, if fear events have
happened, the K parameter decreases.
Secondly, it is shown that the correlation between
an evaluated score
´
K(i) and an assumed K parame-
ter K(i) can be strongly. Consequently, if the above
model (equation(5)) is improved, we can make
´
K ≃
K. And, a K parameter on our K model can be eval-
uated with the content analysis (Janis, 1965)(Krip-
pendorf, 1980) from social and economical events on
news sources (eg..Wikipedia(Wikipedia, )).
6 CONCLUSION
Consequently, it is sure that the position of communi-
cation traffic demands is moved by social and eco-
nomical events. This article analyzes the relation
among traffic demands and social events and eco-
nomical events, and presents a “K model” (shown as
equation(1)) which can improve the reliability of fore-
casted traffic demands with a “K parameter”. This
K parameter can be computed with evaluating so-
cial and economical events (shown as equation(2) and
equation(4)). Also the equation(4) can be realized
with the content analysis(Janis, 1965)(Krippendorf,
1980). Since there are many volumes and kinds in
social and economical events, sampling and coding
of these events should be resolved with the text data
mining(Hearst, 1999).
Finally, automating and improving the K model is
a theme in the next article.
REFERENCES
BEA. Bureau of economic analysis. WEB. URL
http://www.bea.gov/beahome.html.
FCC. Federal communications commission releases statis-
tics of communications common carriers. WEB. URL
http://www.fcc.gov.
Hearst (1999). Untangling text data mining. In the Pro-
ceedings of ACL’99: the 37th Annual Meeting of the
Association for Computational Linguistics. the Asso-
ciation for Computational Linguistics.
Janis (1965). The problem of validating content analysis. In
Language of Plitics. Cambridge: MIT press.
Krippendorf (1980). CONTENT ANALYSYS: An Introduc-
tion to its Methodology. Sage Publication, Inc., USA,
2nd edition.
Nakazawa (2004). An Introduction to Statistical Analysis
with R. Piason Education, Japan, 2nd edition.
TheR (2004). R: A language and environment for statistical
computing. R Development Core Team: R Foundation
for Statistical Computing, Vienna, Austria. ISBN 3-
900051-00-3.
Wikipedia. Wikipedia, the free encyclopedia. WEB. URL
http://en.wikipedia.org/wiki/1982.
A METHODOLOGY OF FORECASTING DEMANDS OF THE COMMUNICATION TRAFFIC
485
