
CLINICAL DECISION SUPPORT BY TIME SERIES
CLASSIFICATION USING WAVELETS
Markus Nilsson, Peter Funk, Ning Xiong
Department of Computer Science and Electronics, M
¨
alardalen University
H
¨
ogskoleplan 1, P.O. Box 832, SE-721 22 V
¨
aster
˚
as, Sweden
Keywords:
Decision support, Case-Based Reasoning, Time series, Biomedical sequences, Classification, Discrete Wavelet
Transformations, Clustering, Respiratory Sinus Arrhythmia.
Abstract:
Clinicians do sometimes need help with diagnoses, or simply need reinsurance that they make the right deci-
sion. This could be provided to the clinician in the form of a decision support system. We have designed and
implemented a decision support system for the classification of time series. The system is called HR3Modul
and is designed to assist clinicians in the diagnosis of respiratory sinus arrhythmia. Two parallel streams of
physiological time series are analysed for the classification task. Patterns are retrieved from one of the time
series by the support of the other time series. These patterns are transformed with wavelets and matched for
similarity by Case-Based Reasoning. Pre-classified patterns are stored and are used as knowledge in the sys-
tem. The amount of patterns that have to be matched for similarity is reduced by a clustering technique. In
this paper, we show that classification of physiological time series by wavelets is a viable option for clinical
decision support.
1 INTRODUCTION
A recurring task in medicine is the classification of
physiological measurements. Correct classification
of the measurements is often vital for a correct diag-
nosis. Analysing long time series of measurements
at a screen or on paper is tedious work. Clinicians
need, in some cases, to identify small and sometimes
rare occurring irregularities in the measurements.
The identification of these irregularities is often
vital for a accurate diagnosis of a patient. A manual
identification of these irregularities requires a certain
amount of expertise in the specific field of medicine,
as with our field of interest, which is the diagnosis
of stress and stress related dysfunctions related to
metabolic processes (von Sch
´
eele, 1999).
Case-Based Reasoning (CBR) (Kolodner, 1993;
Leake, 1996) in combination with wavelet transfor-
mations (explained in sections 2 and 3) has been
shown to be a reliable classification method for the
identification of dysfunctions in patterns, i.e., irreg-
ularities in physiological time series. The classified
patterns are the basis of a diagnosis. We present a de-
sign that uses these features in this paper. We have
also created a system, HR3Modul, with these fea-
tures. HR3Modul helps clinicians with the tedious
work of classifying time series, which often requires
long time and experience to learn. A CBR system,
such as HR3Modul, is able to spread new discov-
eries within the medical field, just by adding new
cases to the case library. For less experienced clin-
icians, a case may also contain references, explana-
tions, recommendations from an experienced clini-
cian and contact information for additional expert ad-
vice. Case libraries may also be used to help iden-
tifying new relations and patterns by researchers and
lead to new recommendations on how to classify the
patterns.
In this paper, we present the design and implemen-
tation of the HR3Modul system. The system classifies
Respiratory Sinus Arrhythmia, which is introduced in
the next section. The section also contains the design
and overall structure of the system. Section 3 contains
the specifics of retrieving cases, i.e., patterns, and how
to measure them for similarity. We do also present a
way to reduce the computational time of the similarity
matching by proposing a clustering technique that re-
duces the number of cases the system has to perform
matches on. Section 4 contains the results of testing
and section 5 concludes the paper with a conclusion.
169
Nilsson M., Funk P. and Xiong N. (2005).
CLINICAL DECISION SUPPORT BY TIME SERIES CLASSIFICATION USING WAVELETS.
In Proceedings of the Seventh International Conference on Enterprise Information Systems, pages 169-175
DOI: 10.5220/0002526201690175
Copyright
c
SciTePress
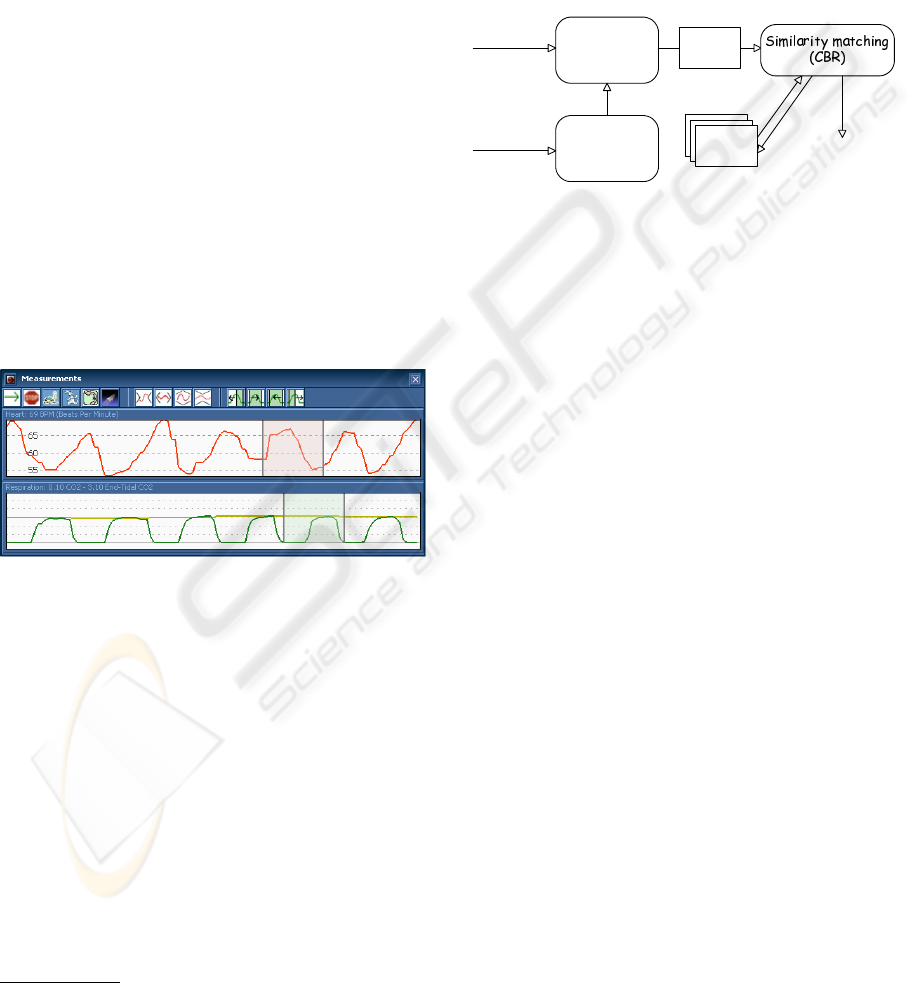
2 CLASSIFICATION SYSTEM
We implemented the ideas in a prototype called
HR3Modul
1
. HR3Modul is a classification system
for Respiratory Sinus Arrhythmia (Grossman et al.,
1990; Dinh et al., 1999). Respiratory Sinus Arrhyth-
mia (RSA) is the respirations affecting the heart rate
(HR) (Malik et al., 1996), see (Nilsson, 2004) for
an in depth explanation of RSA. In short, the heart
beats faster during an inhalation and beats slower
during exhalation, on a normal healthy person, as
can be seen in figure 1. The respiration is measured
by capnography (Landis and Romano, 1998), i.e.,
carbon dioxide (CO
2
) levels in exhaled air. The
levels of CO
2
are low during an inhalation and rise
during an exhalation. The HR is measured by Electro
Cardio Graphy (ECG) and indicates averaged heart
beats per minute.
Persons do sometimes have physiological or psy-
chological disorders that appear as dysfunctions in the
HR or the CO
2
patterns (von Sch
´
eele, 1999; Landis
and Romano, 1998). Stress related disorders are often
detected in these measurements (von Sch
´
eele, 1999).
We concentrate on classifying dysfunctions in the HR
patterns in this paper.
Figure 1: Respiratory Sinus Arrhythmia. The upper graph
indicates the heartbeat and the lower graph indicates the
carbon dioxide levels of exhaled air. A normal (non-
dysfunctional) breathing cycle is marked.
The system uses CBR as the method for classifi-
cation of dysfunctional patterns within the RSA. We
chose CBR because the domain is not fully under-
stood and we want the ability of dynamic introduction
and revision of knowledge. These requirements make
the CBR paradigm a good choice for our classifica-
tion system as the systems knowledge, the cases, may
be altered in the systems memory, the case library, at
any time (Watson, 1997).
The start of a respiration cycle (an inhalation fol-
lowed by an exhalation) is detected by analysing the
CO
2
measurements. The HR samples that correspond
to the same time period as the CO
2
samples are the
1
HR3Modul, a Heart-Rate and Respiratory-Rate classi-
fier.
samples that are to be classified. The HR are classi-
fied one breath at a time. The HR samples are shifted
back in time in figure 1, due to a delay in the capnog-
raphy method. The design of the system is illustrated
in figure 2. The samples in the HR that correspond
to a breath are represented as a new case in the sys-
tem. Previously classified time series of HR samples,
i.e., patterns, are stored in the case library. The new
case is matched against the stored cases and a list of
similar cases is created.
Heart
analysis
Respiration
analysis
RSA
case
New
case
Respiration
period
Ranked
cases
Carbondioxide
measurements
Heart rate
measurements
Case library
Figure 2: The overall design of the classification system.
Heart rate sequences are represented as new cases and clas-
sified with CBR.
2.1 Cases and case library
Information on how to classify HR patters are stored
as cases, as the classification system uses CBR. A
case contains, as earlier mentioned, a previously clas-
sified pattern of HR. The pattern is stored as both raw
samples and a transformed frequency spectrum based
on the samples. A stored case additional contains a
class variable. The class variable indicates the class,
or type of, RSA pattern the case contains.
2.1.1 Case organization through clustering
Reliable function of the developed HR3Modul is
contingent upon a rich storage of experiences for
decision support. Such experiences can be collected
over different measurement sessions and from various
clinics, which results in a possibly very large amount
of classified RSA patterns to enter into the case
base. Retrieval of relevant cases from a large-sized
case library is not a trivial issue. Comparing every
stored case with a query appears an awkward and
time-consuming practice. To foster more effective
retrievals we would like to have an appropriate
structure of the case library such that, given a query
case, only a portion of the stored cases are quickly
located for matching.
The above objective can be approached by a
hierarchical nested organization of cases in the case
library. The roadmap we recommend here is to group
cases by means of recursive usage of the k-means
ICEIS 2005 - ARTIFICIAL INTELLIGENCE AND DECISION SUPPORT SYSTEMS
170

B
A
C
D
Figure 3: A case distribution with two dimensional feature
vectors.
(k=2) clustering algorithm (A. K. Jain and Flynn,
1999). First we divide the whole library of cases
into two groups through 2-means clustering, and
then these two groups undergo 2-means clustering
again resulting in two sub-groups for each, and
so forth. The key herein is that every cluster is
further partitioned with 2-means clustering until
the distance between two newly derived clusters
is below a specified value. In the following we
describe this procedure by a recursive function
Hier() that is applied to a case collection Group
for hierarchical structuring. The function is defined as
Hier(Group)
Step 1: Divide Group into clusters c1 and c2
by 2-means clustering;
Step 2: Compute the distance d(c1, c2) between
c1 and c2;
Step 3: If d(c1, c2) is below a specified threshold,
then return Group and terminate, else:
a) Perform Hier(c1);
b) Perform Hier(c2);
Should the function Hier() be applied to a set
of cases with their feature vectors depicted in figure
3, we would arrive at a hierarchical tree structure
as shown in figure 4. It is started by partitioning
the case library into clusters A and B. Subsequently
cluster A is further divided into sub-clusters C and D,
while cluster B fails to be partitioned into sufficiently
disjoint sub-clusters and thus ends up as a leaf node
in the tree.
Case Library
Cluster A
Cluster B
Cluster C
Cluster D
Figure 4: Hierarchical nested organization of the case li-
brary.
Certainly, a prerequisite to our suggested
clustering-based case organization is the avail-
ability of patterns established from RSA time series
for all cases. Features can be extracted using wavelet
analysis if identical lengthy RSA signals are present
or FFT transformations if variations in signal lengths
are expected, see section 3.
2.2 Retrieval of similar cases
The retrieval process contains several steps, first, the
samples are converted to frequencies by applying a
wavelet transformation, the DWT (Discrete Wavelet
Transformation) in figure 5. Secondly, the number
of cases from the case library the new case has to be
compared to is minimised by creating a reduced case
library. The number of cases is minimised by finding
a suitable cluster of cases, i.e., a subset of cases from
all cases in the case library. All the cases in the cluster
are compared for similarity with the new case. The fi-
nal step is to rank the compared cases in the order
of descending similarity, i.e., having the most simi-
lar case first in a list, and the least similar case last.
Each step is explained in more detail in the following
section.
3 Methodology
3.1 Transforming the samples
Time series, or sequences of samples, often contain
temporal attributes, i.e., time dependent information.
Biomedical signals, as a sequence of HR samples,
often carry important time dependent attributes. Such
temporal attributes are for example if and when
irregularities occur in a signal, like dips and notches
(von Sch
´
eele, 1999), or when a HR sequence is out
of phase with the breathing.
A way of detecting irregularities in signals is to
transform the samples to frequencies, for instance
with Discrete Fourier Transformations (DFT) such as
the popular Fast Fourier Transformation (FFT) (Hip-
penstiel, 2002). DFTs are good for detecting irregu-
larities in signals, but, a limitation with DFTs is that
they loose the temporal aspects, i.e., when in time the
irregularities occur. An interesting way of detecting
these temporal attributes is to transform the time se-
ries in to time-frequencies. That is, to retain both tem-
poral and frequency aspect of the signals. Short Time
Fourier Transformations (SHTF) retain the temporal
attributes, but have often a low resolution for both
time and frequencies (Daubechies, 1990). Discrete
Wavelet Transformations (DWT) overcomes this by
CLINICAL DECISION SUPPORT BY TIME SERIES CLASSIFICATION USING WAVELETS
171

DWT
A new
Case
RSA
case
Case library
RSA
case
Reduced
Case library
A breath
Clustering
Case
Matching
Figure 5: A detailed view of the retrieval process. Time
series of HR samples, which correspond to a breath, are
matched for similarity with pre-classified time series.
staying local in both time and frequencies (Montani
et al., 2003). DWTs have also the benefit of hav-
ing a lower complexity than DFTs (Nilsson, 2005).
Chan and Fu have shown that the Haar transforma-
tion is well suited for retrieving time series (Chan and
Fu, 1999). Nilsson shows that Daubechies D4 DWTs
are more suited for biomedical retrieval in (Nilsson,
2005), due to the D4 DWT overcomes Haar’s limi-
tations with its inability to detect a specific form of
oscillating sequences. Hence we use the D4 in our
classification system. The D4 is described by the fol-
lowing matrix
s0
′
c0
′
s1
′
c1
′
=
h0 h1 h2 h3
h3 −h2 h1 −h0
×
s0
s1
s2
s3
(1)
where s0, s1, s2, s3 are the four required input
samples. c0
′
and c1
′
are the frequency coefficients
for these four samples at a specific frequency band.
s0
′
and s1
′
are the new output samples that are to be
input samples to further iterations of the equation.
h0, h1, h2 and h3 are defined as
h0 =
1+
√
3
4
√
2
; h1 =
3+
√
3
4
√
2
h2 =
3−
√
3
4
√
2
; h3 =
1−
√
3
4
√
2
But a limitation with DWTs, as well as with DFT
based methods, is that they only handle input lengths
of n
2
samples. Sequences with other lengths are
therefore not transformable in their original forms.
These sequences have to be altered to fit the n
2
re-
quirements, preferably without changing the informa-
tion within them. The solution is to pad the sequence
with zeros (zeroes does not carry any frequencies).
But, the original signal, i.e., the HR sequence, has to
be mean averaged to zero, before it can be padded,
i.e., added, to avoid introducing any artefact to the
signal (Nilsson and Funk, 2004). The mean averag-
ing of the sequence eliminates possible low frequency
oscillations padding may introduce. Slower oscilla-
tions, i.e., lower frequencies, spanning the entire HR
sequence are introduced if zeroes are added to a signal
that is not mean averaged to zero. The mean average
is calculated by
sample(i)
n
i=1
= sample(i) −
P
n
j=1
sample(j)
n
(2)
where i represents a HR sample in the sample se-
quence sample(). The sequence is transformable by
the DWT after the mean averaging and padding. We
apply equation 1 to the entire sequence of samples.
As we can see, the D4 requires 4 input samples and
outputs 2 frequency coefficients and 2 intermediate
samples. That translates to the creation of a list of co-
efficients half the size of the input sample sequence,
and a list of intermediate samples also half the size of
the input sample length. The frequency coefficients
are said to belong to a specific frequency band, the in-
termediate samples are iterated further with equation
1 for coefficients in other frequency bands.
3.1.1 Frequency bands
A wavelet transformation creates frequency bands in-
stead of individual frequencies as in a Fourier trans-
formation. Each frequency band in a wavelet trans-
formed signal has one or more frequency coefficients.
The number of coefficients in the transformed signal
is determined by the number of input samples, and the
number of coefficients is in the order of n−1 samples.
The number of frequency bands in a signal is
fb(n) = log
2
(n) (3)
where fb(n) is the number of frequency bands for n
samples.
The first frequency band has half the number of
frequency coefficients as the number of samples in
the input sequence, as mentioned in the previous
section. The next highest frequency band has the
previous frequency bands number of coefficients
divided by two. As an example, 3 frequency bands
are created when we use 8 input samples to a DWT
(log
2
(8) = 3). The highest frequency band has 4
coefficients (8 samples divided by 2). Next highest
band has 2 coefficients, and the lowest has 1 coeffi-
cient. This is illustrated in figure 6.
It is not necessary to fully understand the specifics
of the frequency bands and the coefficients in order to
ICEIS 2005 - ARTIFICIAL INTELLIGENCE AND DECISION SUPPORT SYSTEMS
172

Highest
frequency
band
Mid
band
Lowest
band
Frequency
coefficient
Frequency
coefficient
Frequency
coefficient
Frequency
coefficient
Frequency
coefficient
Frequency
coefficient
Frequency coefficient
Time
Figure 6: An example of 8 input samples to a DWT creating
4 frequency coefficients at the highest frequency band, 2 at
the mid frequency band and 1 at the lowest frequency band.
transform the sequences with DWTs. A more detailed
description of the background and methodology can
be found in (Nilsson, 2005).
3.2 Locating a local cluster
Given a new query case we need to traverse the hi-
erarchical tree structure of the case library to locate
a local cluster, based upon which to perform case re-
trieval. The idea is to pick such a leaf node in the
tree that exhibits most suitable for the query. An ef-
ficient means to do this is to calculate the distance
between the query and centres of both clusters at a
lower level and then move to the node whose centre
is assessed to be closer. The traversal of the tree starts
from a root node representing the whole case library
and goes down to nested clusters level by level un-
til a leaf node is encountered. This final leaf node
reached presents a cluster of cases to be matched with
the query. As a simple illustration we now attempt
to traverse through the binary tree in figure 4. If the
query were closer to the centre of cluster A, first we
move to that node. Then we compare the centres of
clusters C and D with the query. Should the centre of
cluster C appear closer, return C as the local cluster
for case retrieval.
3.3 Similarity measurement
The DWT transformed HR sequences in the cases are
compared for similarity when two cases are matched
for similarity in the HR3Modul system. We have
adapted the slot principle from the D-HS
T
method
(Patterson et al., 2004) for our similarity measurement
method, and we use an automatic weighting method
for the features, i.e., frequency coefficients, when cal-
culating the importance of the features.
The frequency coefficients have to be normalised
before they can be matched for similarity. The coeffi-
cients are normalised in the range of −1 to 1.
3.3.1 Slots
The normalised coefficients are divided in to slots.
A slot represents an interval in the normalised space
for the frequency coefficients, i.e., a smaller interval
within the interval −1 to 1. A slot interval is de-
cided by the number of slots in use. If we use 5 slots,
the intervals for the 5 slots are −1 to −0.6,...,0.6 to
1. Similar features, and therefore patterns, are found
without the need for calculating distances, and with-
out the need of using domain knowledge for each fea-
ture. The principle does also allow some slack be-
tween similar features. The slot a coefficient belongs
to is calculated by
slot(c) =
Θ − 1 iff c = 1
⌊Θc⌋ if f c < 1
(4)
where Θ is the slot the frequency coefficient c is to
be associated with. The HR3Modul system uses 5
slots as it has been shown in (Patterson et al., 2004) to
be a well balanced number of slots for temporal time
series.
3.3.2 Weights
Weights are assigned to each frequency band, and as
we are more interested in smaller oscillations for find-
ing irregularities within signals we assign higher fre-
quency bands higher weights. The weight a frequency
band is assigned is calculated by
weight(ϑ) =
1
2
ϑ
(5)
where weight(ϑ) is the weight for frequency band ϑ.
The highest frequency band is ϑ = 0. Each band
below the highest is incremented by 1, i.e., the mid
band in figure 6 has ϑ = 1 and the weight 0.5 (
1
2
1
).
The lowest band has the weight 0.25 (
1
2
2
).
3.3.3 Similarity
There are two circumstances in which cases may
be compared for similarity, cases with identical
lengths of transformed HR samples, and cases with
dissimilar lengths. We denote the case with HR
transformed sequence with most input samples as
the longer sequence, as it contains more frequency
coefficients; and subsequently the other case’s as the
shorter sequence.
CLINICAL DECISION SUPPORT BY TIME SERIES CLASSIFICATION USING WAVELETS
173
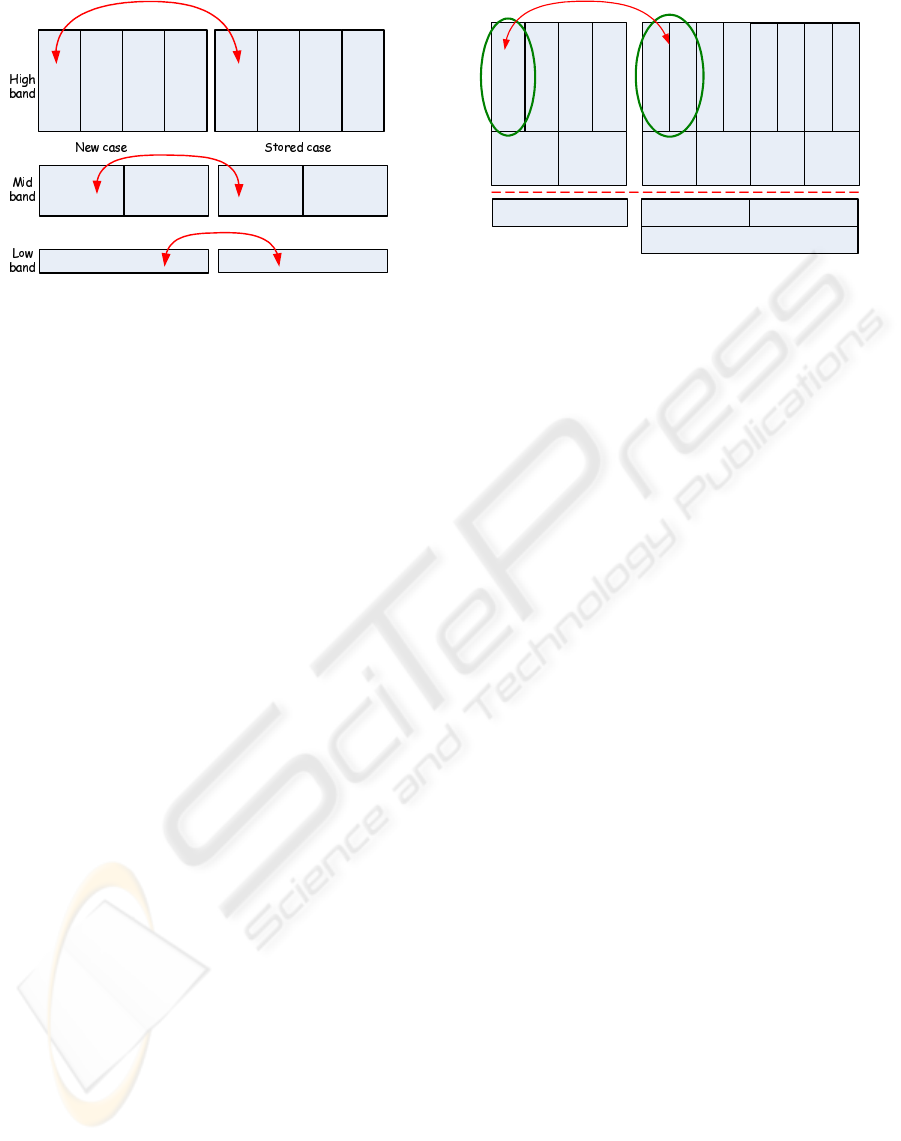
C'6 C''6
(1.0)
(0.25)
C''0 C''1 C''2 C''3C'0 C'1 C'2 C'3
C''4 C''5C'4 C'5
(0.5)
Figure 7: Similarity between two cases. Each frequency
band has its own weight. Matched coeffients add the
weights to the total similarity for the case.
If the two sequences have the same length, each
coefficient in both cases is assigned a slot by using
equation 4, in the HR3Modul system, a slot between
0-4. The first coefficient in the new case is matched
against the first frequency coefficient in a stored case,
the second coefficient in the new case with the second
in the stored case, etc. If two coefficients are assigned
to the same slot, they are said to be a matching pair. If
a pair is a match the weight for that frequency band,
calculated by equation 5, is the similarity value, for
that pair. All pair’s similarity values are added for the
total similarity between the two cases.
If we use figure 7 as an example, lets say that the
new case (see figures 2 and 5) and a case from the
reduced case library has 8 HR samples each. Both
cases will end up with 7 frequency coefficients as
seen in the figure. If the leftmost coefficient matches
the same slot as the leftmost coefficient in the stored
case, the similarity for the entire case is increased
from 0 to 1, as the high frequency band coefficients
have 1 as weight. The other three coefficients in
the high band are compared, and added if they are
a matching pair. We have the total similarity of 4
for a complete similarity on the high frequency band
(4 coefficient × the weight). The mid band has 2
coefficients valued to 0.5 each (equation 5) for a
matching pair. If the low band is matched, the weight
0.25 is added to the similarity for the case.
We have to use another approach if cases have
dissimilar sequence lengths. We apply the best fit
scheme (Nilsson, 2005) where a pair is considered a
match if at least one of the coefficients in the case with
the longer sequence matches the shortest sequence’s
coefficient. That translates to, both C
′′
0
and C
′′
1
are
tested against C
′
0
in figure 8. If either C
′′
0
and/or C
′′
1
are in the same slot as C
′
0
, C
′
0
is said to match C
′′
0
/C
′′
1
and the weight is added to the similarity. There are a
C'0 C'1 C'2 C'3
C'4 C'5
C'6
(1.0)
C''14
C''0 C''1 C''2 C''3
C''8 C''9
C''12
C''4 C''5 C''6 C''7
C''10 C''11
C''13
Figure 8: Similarity between two cases with dissimilar
lengths. Sequence C
′
is based on 8 samples and C
′′
is based
on 16 samples.
maximum of 4 matches in the highest frequency band
in figure 8 as the shortest sequence contains 4 coeffi-
cients in that frequency band. Weights are assigned in
the same manner as with the same-length sequences.
As we can see in figure 8, the shorter sequence lacks
the ability to further divide itself to a fourth band.
Thus, C
′
6
and C
′′
12
do not span the same frequency
band, C
′
6
’s frequency band is a combination of C
′′
12
and C
′′
14
. C
′′
14
has to be added to both C
′′
12
and C
′′
13
to
be able to compare them with C
′
6
.
4 RESULTS
There exists a total of 11 classes of RSA (von Sch
´
eele,
1999), which translate to 11 stereotypical HR pat-
terns. The case library contains several examples,
cases, of each class. The case library is distributed
towards having more examples of more common oc-
curring classes and fewer cases of lesser occurring
classes. We conducted two tests on the system. There
were approximately 50 cases in the first test. We
tested a DFT distance based method for retrieval in
the first. The method is described in (Nilsson and
Funk, 2004). The probability that the system makes
a correct classification in the first attempt is 73.4%,
as seen in figure 9. All attempts beyond the fifth are
summed in the last data point. A correct classification
is defined as; the system is suggesting the same class
of RSA as an expert would. An expert in the field of
classification of RSA was involved in the creation of
the cases and in the evaluation.
We applied the D4 DWT with the best fit scheme as
the retrieval method in the second test. We increased
the retrieval rate by an average of 20% compared with
the DFT based method, as is illustrated in figure 10.
The case library was split in to two parts, a test set
and a case library set. The graph illustrates different
ICEIS 2005 - ARTIFICIAL INTELLIGENCE AND DECISION SUPPORT SYSTEMS
174
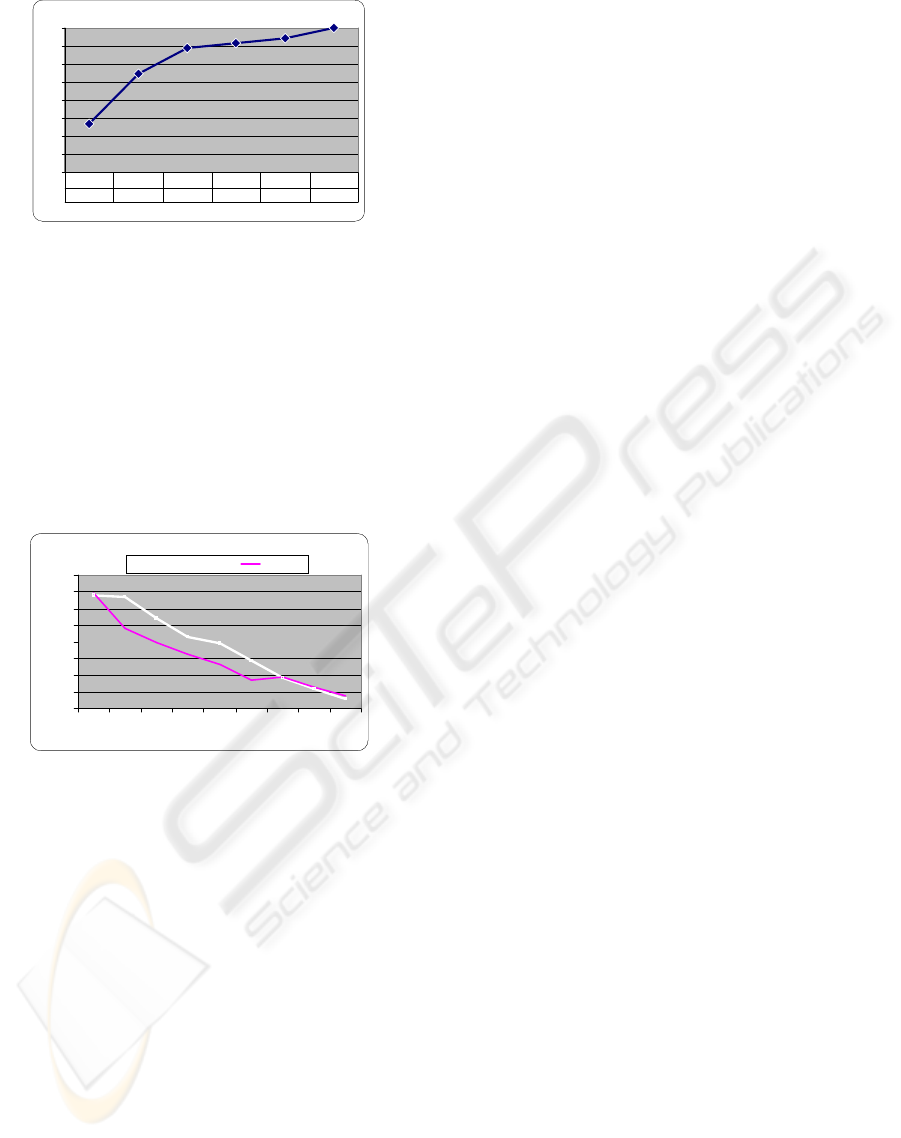
Probability of a correct classification
73,4
87,4
94,4
95,8
97,2
100
60
65
70
75
80
85
90
95
100
Attempt
%
73,4 87,4 94,4 95,8 97,2 100
1 2 3 4 5 >5
Figure 9: Classification accuracy in the HR3Modul system.
number of cases retrieved with the percentual amount
of cases in the case library versus cases in the test set.
That is, if 10% of the cases are assigned to the case
library, the remaining 90% of the available cases were
in the test set. The equal retrieval ratio above 70% is
due to the asymmetric distribution of cases. All cases
of the lesser common classes are probably included in
the case library set, thus only more common occuring
cases are available in both sets for a comparison.
DWT vs DFT
0
20
40
60
80
100
120
140
160
10% 20% 30% 40% 50% 60% 70% 80% 90%
Cases in the library
Correct classified cases
D4 DWT w/ best fit DFT dist.
Figure 10: Applying the D4 DWT with the best fit scheme
compared to a DFT distance retrieval.
The retrieval speed is increased by applying the k-
means clustering technique on the case library to pro-
duce a reduced case library. The case library is re-
clustered (off line) every time the library is changed.
The number of clusters and the size of them are there-
fore different for every run, with an altered case li-
brary, as with the tests.
5 CONCLUSION
We have presented a system called HR3Modul, which
classifies respiratory sinus arrhythmia by classifying
patterns in the heart rate. The system uses contin-
uous physiological time series for the classification.
HR3Modul uses the patients breathing to point out
which samples a pattern contains, and subsequently
needs to be classified. Each pattern is represented as
a case, as the system is CBR based. We have tried
both Fourier and wavelet retrieval methods and have
found that the wavelet based methods performs better.
We have seen an increase in retrieval hits by 20% by
using DWTs compared to DFTs. We have also shown
a k-means method for reducing the number of cases
needed in the retrieval process. This speeds up the
classification, as only a subset of the case library is
needed when making a classification.
REFERENCES
A. K. Jain, M. N. M. and Flynn, P. J. (1999). Data cluster-
ing: A review. ACM Comp. Surv., 31(3):264–323.
Chan, K.-P. and Fu, A. W.-C. (1999). Efficient time series
matching by wavelets. In ICDE, pages 126–133.
Daubechies, I. (1990). The wavelet transform, time-
frequency localization and signal analysis. IEEE
transactions on information theory, 36(5):961–1005.
Dinh, T. P., Perrault, H., and et al (1999). New stati-
cal method for detection and quantification of respi-
ratory sinus arrhytmia. IEEE Trans. on Biomed. Eng.,
46(9):1161–1165.
Grossman, P., Beek, J. V., and et al (1990). A comparison of
three quantification methods for estimation of respira-
tory sinus arrhytmia. Psychophys., 27(6):702–714.
Hippenstiel, R. D. (2002). Detection Theory. CRC Press.
Kolodner, J. (1993). Case-based Reasoning. M. Kaufmann.
Landis, B. and Romano, P. M. (1998). A scoring system for
capnogram biofeedback: Preliminary findings. App.
Psychophysiology and Biofeedback, 23(2):75–91.
Leake, D. B. (1996). Case-based Reasoning: Experiences,
Lessons, and Future Directions. MIT Press.
Malik, M., Camm, J., and et al (1996). Heart rate variability
- standards of measurement, physiological interpreta-
tion, and clinical use. European Heart J., 17:354–381.
Montani, S., Magni, P., and et al (2003). Integrating model-
based decision support in a multi-modal reasoning
system for managing type 1 diabetic patients. AI in
Medicine, 29:131–151.
Nilsson, M. (2004). A Case-Based Approach for Classifica-
tion of Physiological Time-Series. M. Uni. Press.
Nilsson, M. (2005). Retrieving short and dynamic biomed-
ical sequences. FLAIRS’05.
Nilsson, M. and Funk, P. (2004). A case-based classifica-
tion of respiratory sinus arrhythmia. pages 673–685.
ECCBR’04.
Patterson, D., Galushka, M., and Rooney, N. (2004). An
effective indexing and retrieval approach for temporal
cases. pages 190–195. FLAIRS’04.
von Sch
´
eele, B. (1999). Classification Systems for RSA,
ETCO2 and other physiological parameters. PBM
Stressmedicine.
Watson, I. (1997). Applying Case-Based Reasoning: Tech-
niques for Enterprise Systems. Morgan Kaufmann P.
CLINICAL DECISION SUPPORT BY TIME SERIES CLASSIFICATION USING WAVELETS
175
