
TRANSFERRING PROBLEM SOLVING STRATEGIES FROM
THE EXPERT TO THE END USERS
Supporting understanding
Anne Håkansson
Department of Information Science, Computer Science, Uppsala University, Box 513, SE-751 20, Uppsala, Sweden
Keywords: Knowledge Management S
ystems, Knowledge Sharing, Knowledge Dissemination, E-Learning, Reasoning
Strategies, Visualization, Graphical Diagrams and Modeling Formalisms
Abstract: If knowledge sharing between people in an organisation is to be encouraged, new types of systems are
needed to transfer domain knowledge and problem-solving strategies from an expert to the end users and,
thereby, make the knowledge available and applicable in a specific domain. If it is to be possible to apply
the knowledge in the organisation, the systems will need a means of illustrating the reasoning strategies
involved in interpreting the knowledge to arrive at the conclusions drawn. One solution is to incorporate
different diagrams in knowledge management systems to assist the user to comprehend the reasoning
strategies and to better understand the knowledge required and gained. This paper describes the manners by
which knowledge management systems can facilitate transfer of problem-solving strategies from a domain
expert to different kinds of end users. With this objective in mind, we suggest using visualization, graphical
diagrams and simulation in conjunction to support the transfer of problem-solving strategies from a domain
expert to the end users. Visualization can support end users, enabling them to follow the reasoning strategy
of the system more easily. The visualization discussed here includes static and dynamic presentation of the
rules and facts in the knowledge base that are used during execution of the system. The static presentation
illustrates how different rules are related statically in a sequence diagram in the Unified Modeling Language
(UML). The dynamic presentation, in contrast, visualizes rules used and facts relevant to a specific
consultation, i.e., this presentation depends on the input inserted by the users and is illustrated in a
collaboration diagram in the UML. Utilising these diagrams can support the sharing and reuse of the
knowledge and strategies used for handling routine tasks and problems more efficiently and profitably
whilst minimizing potential for loss of knowledge. This is important when experts are not available on the
spot. These diagrams can also be used for the organisation and the disseminating of knowledge by locating
experts in an organisation, which is important when these are to be relocated in large organisations or
geographically distributed.
1 INTRODUCTION
Knowledge management refers to an organisation’s
ability to learn from its environment and to
incorporate knowledge into its business processes
(Laudon & Laudon, 2002). This provides
instruments with which to optimise the control and
the management of crucial production factors and
aims at preventing bottlenecks of the kind that arise
when information is not transferred smoothly within
an organisation. The essence is the organisation of
processes through which knowledge is developed
and distributed to those who need it. It also involves
making knowledge accessible for future use by the
whole organisation and the combining of different
knowledge areas (Liebowitz & Wilcox, 1997).
Knowledge management is embodied by a set of
pr
ocesses developed in an organisation to gather,
organise, refine and disseminate knowledge (Awad
& Ghaziri, 2004). In this, information technology
plays an important role. For example, a knowledge
management system can enable the creation, storage,
maintenance, and dissemination of knowledge, it can
optimise learning and protecting whilst allowing it to
be shared between people in an organisation
(Laudon & Laudon, 2002). It enables people to act
in an informed manner when a new source of
information becomes available and to deal with the
information in a beneficial way.
3
Håkansson A. (2005).
TRANSFERRING PROBLEM SOLVING STRATEGIES FROM THE EXPERT TO THE END USERS - Supporting understanding.
In Proceedings of the Seventh International Conference on Enterprise Information Systems, pages 3-10
DOI: 10.5220/0002526100030010
Copyright
c
SciTePress

When a user is operating a knowledge
management system, the knowledge that should be
transferred is that possessed by an expert, i.e. it is
domain knowledge and will incorporate problem
solving strategies that need to be passed on to the
end users. In knowledge management systems, the
domain knowledge is usually expressed in terms of
facts, rules, concepts, relationships, assumptions and
tasks (Tansley & Hayball, 1993). The problem
solving or so-called reasoning strategy usually
involves deductive or inductive strategies but could
also involve a combination of these (Durkin, 1994).
Knowledge management systems must allow
organisations to store and access information more
efficiently (Awad & Ghaziri, 2004). Moreover, these
systems must document how decisions are reached.
This knowledge needs to be distributed within the
organisation. Therefore, domain knowledge and
reasoning strategies are to be transferred to end users
to support the sharing of knowledge between people.
New types of knowledge management systems
are needed to display the contents of a system; these
can work as knowledge systems with educational
facilities. In that connection, the system has to
provide several different views of the knowledge to
support the different end users. Moreover, the
system has to have a procedure for illustrating the
strategies involved in the interpretation of the
knowledge.
One way of transferring domain knowledge and
reasoning strategies from a domain expert to an end
user via a knowledge management system is by
visualizing the knowledge and the strategies. To this
end, we use conceptualization, i.e., we exploit
concepts and relationships together with
visualization. Concepts correspond to facts, and
relationships are equivalent to rules and heuristics.
Since it concerns strategies, the presentation needs
to be illustrated with by a model showing stepwise
execution. A candidate for this modeling language is
the visual modeling language Unified Modeling
Language (UML) (Booch et al., 1999), particularly
since UML has become a standard for working with
software-intensive systems (Jacobson et al., 1998).
UML provides several types of graphic diagrams
that can be utilised for inserting, modifying and
tutoring the domain knowledge, as well as to
demonstrate reasoning strategies (Håkansson, 2001).
These diagrams can also be used to generate
knowledge about static and dynamic domain
knowledge and to inform the expert and the end
users about the system’s processing (Håkansson,
2003:b).
For static presentation we use the sequence
diagrams of the UML. These illustrate the
interpretation of the knowledge base by displaying
the time sequences conducting the relations between
the rules, or heuristics, i.e., it can demonstrate how
different parts interact with each other. It also
illustrates how different rules are related to other
rules, and how these rules are dependent on each
other.
For dynamic presentation we use the
collaboration diagrams of the UML since these
display how different parts collaborate with each
other. Dynamic presentation depends on the input
the users insert into the diagram, i.e., the diagram is
dynamic in the sense that it changes with the input,
and visualizes the rules and relationships according
to the inserted facts. Thus, it visualizes the system’s
reasoning strategy, which changes with the input.
Dynamic information is relevant since the rules that
are used during an interpretation depend on the
information that is supplied by the end users
(Håkansson 2003:a; Håkansson 2003:b), and it is
usually the case that the end users supply the
additional information in these kinds of systems.
These different diagrams can be used for several
different purposes. For instance, they can be used to
solve tasks or problems when suitable opportunities
of getting support from experts will not arise. This
requires that the diagrams contain all the knowledge
necessary to solve a problem or task.
These diagrams can also be used to locate
experts in large organisations or at different
geographical places who will be needed to solve a
particular task. A combination of the questions
appropriate to a particular task or problem and
comprehensive rules can pinpoint that expert to be
consulted to provide particular support or to find a
solution.
The next section is an overview of related work;
this is followed by a discussion of transferring
problem solving and of the notion of
conceptualization. The following sections contain
descriptions of static and dynamic presentations
where statically related rules are illustrated in
sequence diagrams and dynamically related rules are
illustrated in collaboration diagrams.
2 RELATED WORK
Within knowledge management, knowledge maps
can be used to explore and solve problems
(Liebowitz, 2001). Some of these maps are
organisational maps and semantic networks.
Organisational maps can link people’s interactions
by departments in the organisation, link expertise or
knowledge areas to experts, or relate available
knowledge areas to those that are needed or missing.
The semantic network links different knowledge
areas by means of the relationships between them. In
ICEIS 2005 - ARTIFICIAL INTELLIGENCE AND DECISION SUPPORT SYSTEMS
4

our work, we locate where expertise or knowledge
areas can be found by examining the rules that
pinpoint the expertise that is needed to handle a
problem.
Different kinds of maps can be used to support
analyse and structure knowledge graphically,
examples of these being cognitive maps, inference
networks, flowcharts and decision trees (Durkin,
1994). Cognitive maps present domain knowledge
using nodes for concepts and objects, and links for
relationships between these. Inference networks are
also used to represent domain knowledge through
the production rules in a system, with nodes and
links providing “
AND” and “OR” branches.
Flowcharts, on the other hand, can be used to
represent reasoning strategies since they present
sequences of steps that will be performed. These are
composed of blocks with the execution order being
specified and “
YES” and NO” branches being
presented. Decision trees can represent reasoning
strategies since they use graphic presentations of
problem search spaces, composed with nodes and
arc linking related nodes. The arc can have any
value, e.g., “
LOOSE”, “>12”, and “BAD”. In our
approach, graphic diagrams are used for modeling
domain knowledge and reasoning strategy but since
the maps mentioned above suffer from problems
because they cannot cope with large systems, we
will use the diagrams developed in UML.
UML is usually used for modeling object-
oriented systems, but it can also be used for
modeling other types of systems, such as rule-based,
frames and constraint-based ones (Schreiber et al.,
2001; Håkansson, 2001; Helenius, 2001; Cranefield
et al., 2001; Renker et al., 2002).
UML diagrams are used in CommonKADS to
build knowledge-based systems in an object-oriented
fashion. Diagrams can help to model the state of a
system over a period of time and to model the
dynamic behaviour of the system, providing an
image of the sequence of events and assisting with
the decision-making (Schreiber et al., 2001).
Diagrams are also used to clarify the context, from
which the information has come, for the task
analysis and the structure of objects handled in a
task. Moreover, diagrams can be incorporated to
present the actors and the services (or use-cases) and
to include additional chunks of information that are
difficult to model, e.g., large or complex systems
(Schreiber et al., 2001).
In our approach, however, we will apply UML
diagrams to rule-based knowledge management
systems that have been developed in a declarative
fashion. This affects the UML’s diagrams, since they
cannot be used in their original form as they are to
be used in CommonKADS. In its current form,
UML is not directly applicable for modeling
knowledge in systems that are rule-based, however
UML can easily be adapted to knowledge
management systems by utilising rules in the
knowledge base.
3 TRANSFERRING PROBLEM
SOLVING
If the end users are to be provided with adequate
support, an understanding of how the problem
solving strategies work has to be passed on to the
users. This requires that the domain knowledge,
which is used to construct the system’s reasoning,
and the strategies are explicitly described in the
system.
The domain knowledge can be expressed in the
form of declarative and semantic knowledge, which
in turn can be expressed by using conceptualization.
Conceptualization is the use of concepts and
relationships applied to the domain knowledge
(Håkansson, 2003:c). These concepts and
relationships are then presented as facts and rules or
heuristics in the system to provide the declarative
knowledge. The concepts can also express semantic
knowledge, provided that these concepts are
described with words and used in a well-defined
context.
The expert’s problem-solving strategy is
presented as a reasoning strategy, often in the form
of deductive reasoning and/or inductive reasoning,
both of which are common in these systems. The
reasoning strategy is the interpretation of the
system’s knowledge, and in the process of
interpretation facts, rules and heuristics are
examined to reach the conclusions.
During the interpretation, the system will gather
the specific concepts, including facts, and
relationships between rules and heuristics that led to
the different conclusions. These concepts and
relationships constitute paths with knowledge. These
paths can be considered to be simulation strategies
illustrating how the problem solving is used to solve
a particular problem. Thus, simulation, together with
explicit reasoning strategies and conceptualization
can support different end users to help then to
understand the problem solving strategy and the
domain knowledge (Mayiwar, & Håkansson, 2004).
4 CONCEPTUALIZATION
Some kind of knowledge representation has to be
used to represent the knowledge and strategies in a
system. In this work, we use facts and production
TRANSFERRING PROBLEM SOLVING STRATEGIES FROM THE EXPERT TO THE END USERS - Supporting
understanding
5

rules. However, as contents of the system grow it
becomes difficult to explore the system because
there is too much internal complexity. The
complexity of the production rules can be attributed
to the information in the conclusion-part and to the
internal rules specified in the premises-part. The
premises-part is usually comprised of relationships
to other rules and facts, and thus constitutes a
complex knowledge space. This complexity
influences the way the search of the bases is
performed and affects the information retrieval. If a
small number of rules with little internal content are
used, the processing of the rules is effortless, but
otherwise the processing will be time-consuming
and labour intensive. This needs to be improved and
simplified if one is to be able to handle large bases.
A comprehension of what the rules achieve can
be obtained by examining what happens when it is
executed. This action can be labelled by adding
some semantic information, i.e., a elucidate concept.
Thereby, these concepts can be applied to rules with
the intention of grasping the meaning of the rules.
The users can define their own concepts and then
utilise and apply these self-defined concepts to the
rules. An assigned concept corresponds to drawing a
conclusion about the role of a rule by applying a
semantic meaning to that rule, which corresponds to
gaining an understanding of what the application of
that rule achieves.
The user is the person who develops the
knowledge management system, decides the relevant
similarity between the rules and clusters the rules
(Murphy & Pazzani, 1994; Wiratunga & Craw,
2000) that together accomplish a certain task. The
application of concepts can decrease the search for
rules dealing with similar tasks or topics and, in so
doing, decrease redundancy. Moreover,
conceptualization by using clustering can support
the definition of concepts on a higher level of
abstraction and recognising similar rules at this level
may allow them to be generalised.
5 STATIC AND DYNAMIC
PRESENTATION
When a knowledge management system is consulted
or when its operation needs to be understood, the
order in which the different parts of the sequence
interact with each other needs to be understood. This
specification of the order in which the relevant rules
are applied is called the call sequence. It is important
because the sequence in which the rules are applied
determines time sequence of the execution order,
i.e., when an operation is performed. The structure
of the content will already have been determined
since this is imposed during the development of the
system. One of the challenges of the presentation is
to illustrate how different rules are related. Usually
one single rule is related to several others and,
therefore, becomes dependent on them. Thus, these
connections or relations are also important since the
output depends on them too (Håkansson 2003:a;
Håkansson 2003:b).
The contents of the knowledge base, comprised
of rules and relationships, facts and conclusions are
illustrated to obtain a static picture of the
knowledge. This illustration should be a pure
presentation of the contents of the knowledge base at
a given time without any external influence from the
users. The sequence presentation is used to obtain an
overview of the contents by illustrating the rules and
their relationships in a sequence diagram. The
diagram can be used to check the static relationship
between rules. As mentioned, static information
reveals the manner in which rules are connected to
the other rules in the knowledge base.
A dynamic presentation of the knowledge
incorporates the user-supplied facts in a
collaboration diagram with relations showing the
flows over time as computations are performed. In
this diagram, the dynamic presentation of the rules
depends on the input of the users. It is dynamic in
the sense that it changes with the inputs, and it
visualizes the rules and their relationships in
accordance with the inputs. Since the collaboration
diagrams show how different rules and facts are
invoked, they provide a sequential illustration of the
steps that are involved in the interpretation made to
arrive at a specific conclusion.
The dynamic presentation can show the entire
execution through simulation of the reasoning
strategy of the system. The presentation is a step-by-
step performance of the system’s execution of its
rules. As a starting point, the diagram takes the
inputs as facts into the diagram and then processes
the rules, stepwise, until a conclusion is reached. In
this way, the end users can follow the reasoning
strategy reproduce a particular session. For
educational purposes the end users can carry out
experiments by changing the inputs and then check
the new result. It is possible to simulate strategies as
long as the inputs and rules lead to a conclusion.
Thus end users can comprehend a strategy adopted
and participate in simulations (Håkansson, 2003:c).
Now that we have introduced concepts and
terms, it is possible to examine an example to see
how these ideas work in practice. The example
selected is childhood diseases, which is collected
from a lexicon about diseases and includes measles,
rubella and chicken pox or allergic purpura and
cerebral membrane inflammation.
ICEIS 2005 - ARTIFICIAL INTELLIGENCE AND DECISION SUPPORT SYSTEMS
6
6 STATICALLY RELATED RULES
IN SEQUENCE DIAGRAMS
As mentioned above, sequence diagrams provide a
static image of the rules and the relationships
between rules, thereby revealing how the rules are
connected in the knowledge base. Call sequences
reveal the order in which the different parts of the
sequence interact with each other, thereby
facilitating interpretation.
The order in which the rules and facts are
incorporated within each rule is irrelevant. This
means that the rules do not necessarily have to be
described first as they have been in this example.
Facts are obtained from the end user’s input and
each fact is the answer to a specific question being
answered. Of course, when it is known relevant facts
may already have been implemented in the system.
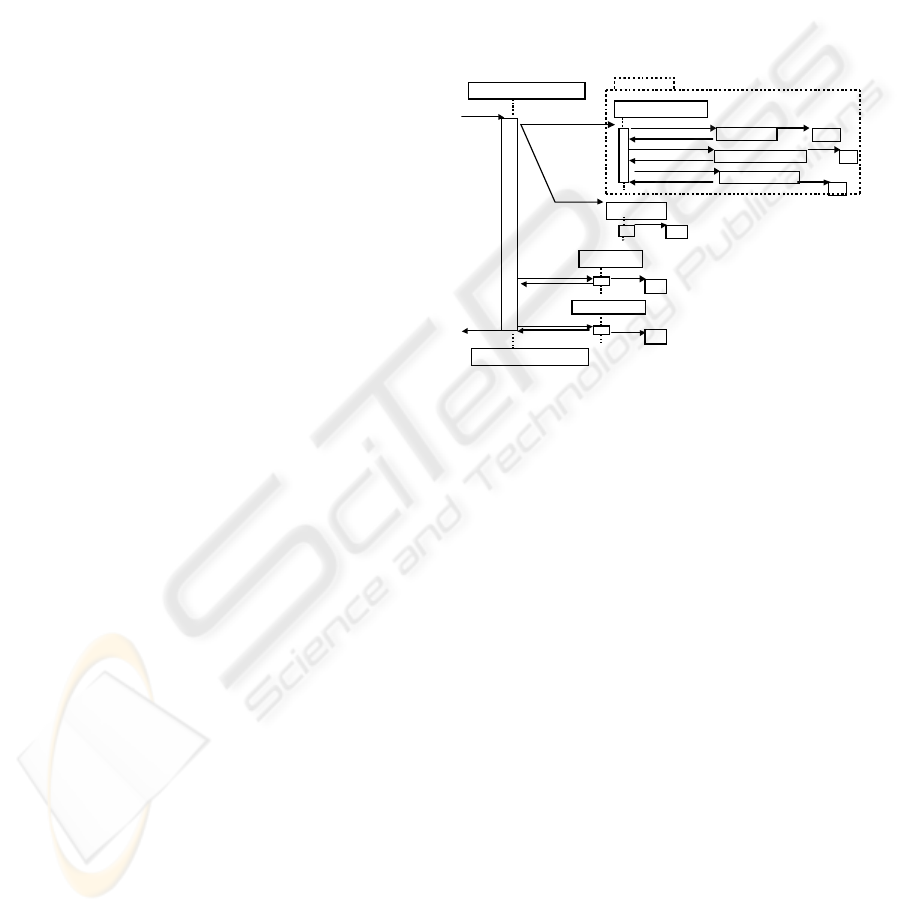
A sequence diagram presents the interpretation
by displaying time sequences between the rules, and,
as can be seen in figure 1, it demonstrates how
different parts interact with each other. It illustrates
how different rules are related to other rules, and
how these rules are dependent on each other. Thus,
the sequence diagram can be utilised to determine
the behaviour of the system by investigating its
performance.
However, displaying all rules in a system, in
which, typically, there will be usually several
hundreds, would be uncontrollable. Therefore,
instead of only visualizing rules at the lowest and
most concrete level, the diagrams can allow the
visualization of the rules’ structures at different
levels of abstraction.
The rules in a knowledge base for childhood
diseases are used to illustrate the employment of
concepts and their relations. The following rules are
to be implemented in the system, which is the formal
modeling of the domain knowledge:
rule(3, symptoms _object, symptoms_text):-
reply(size_rash, =, ‘Yes'),
reply(several_ symptoms, =,'No' ),
reply(swelling_back, =,'No' ).
rule(7,non_conclusion_object,contact_doctor_
text):-
(check(symptoms _object, symptoms_text);
reply(size_rash, =, ‘No)),
reply(rash_blister, =,'No'),
reply(one_red_spot, =,'No').
This example illustrates two different rules. The
rule “symptoms_object” (rule 3) contains three
different facts (replies): the “size_rash” with the
value “Yes” (the meaning of this value is that the
answer is yes to the question concerning the size of
the rash), the “several_symptoms” with the value
“No” and the “swelling_back” that has the value
“No”. In the other rule, “non_conclusion_object”
(rule 7) uses another rule (check in line 2) by
referring to the rule “symptoms_object” (i.e., rule 3).
It also has the facts “size_rash” where the value is
“No” meaning that there is no rash of the size
specified, “rash_blister” with the value “No” and
“one red spot” which has also the value “No”. As
can be seen in this case, the rule includes an “or-
clause” (i.e., a “;” at the end of line 2), which means
that either the rule “symptoms_object” or the fact
“size_rash” can be used during the consultation.
check rule
r: Non conclusion object
reply fact
check rule
q: Several symptoms
Present
conclusi on
q:Size rash
q:Swelling ba ck
No
reply fact
or
reply fact
reply fact
Yes
No
No
q: Size rash
No
No
q: R ash bl is ter
re ply fac t
q: One r ed spot
r: Symptoms object
Rule 3
reply fact
c: Contact doctor object
Figure 1: A sequence diagram including concepts applied
to a knowledge base.
A problem arises when using UML’s sequence
diagrams because there is a clumsy facility for
presenting the rules containing or-clauses, and or-
clauses are often found in rules. Because of this, the
diagram needs to be modified to support these
clauses and, in Figure 1, the or-clauses are marked
with arrows together with the word “or” labelling
the branches. In addition, the diagrams do not
support not-clauses. The not-clause is illustrated as a
cross in the figure to mark the box that cannot be
satisfied, i.e., “Not reply fact” or “Not check rule”
meaning that the response to the question or rule is
negative.
Moreover, the “Contact doctor text” is a
conclusion that is to be presented to the end users on
occasions where this conclusion is reached, the
system fetches the corresponding text from a
conclusion base. The text presented in this case is:
“If you cannot make any diagnosis by using this
schema, you should contact a doctor”.
In a sequence diagram, each object (illustrated as
a square) is an instance of a class. To mark this the
name of the object is underscored. Sometimes the
initial of the name of the class is also used. In this
diagram, the rules, facts and conclusion can also be
seen as objects since they are either the class
TRANSFERRING PROBLEM SOLVING STRATEGIES FROM THE EXPERT TO THE END USERS - Supporting
understanding
7

question (facts), the class rule or the class
conclusion. The underscore is omitted, but the
initials (q, r and c in figure 1) are used to make the
information in the diagram more easily digestible.
By using the diagrams it is possible to identify
the expertise that is required for a particular
problem. The conclusion of the session points out
where in the organisation one should search for the
expertise.
6.1 Packages
As the complexity of the diagrams is to great, steps
need to be taken to reduce it. The approach adopted
uses the notion of packages can be utilised in the
system as a means for encapsulating several rules
and facts included in a rule. The package facility,
which is also a UML notation for organising
elements into groups, facilitates folding knowledge
that is not currently relevant and unfolding packages
containing knowledge that is. These packages are
only used for rules since it is unlikely that packages
for facts will have any substantial impact on the
screen space. Moreover, the packages can be nested
within other packages, which means that a system
may be represented by a single high-level package.
In folding the rule, the user who is developing
the system must be confident of the contents of that
rule, unless automatic verification or validation tools
are implemented in the system. That is, the user
must be aware if automatic verification or validation
tools have been implemented in the system because
folding a rule in which they have been implemented
could be at the expense of introducing verification
and validating problems.
6.2 Change the Execution Order of
the Rules
The adoption of different strategies generally has a
marked effect upon the performance characteristics
of programs. The strategies determine the manner in
which a program searches for a solution. By
visualizing the interpretation, the reasoning strategy
of the system becomes more perceptible. With the
help of a diagram showing the rules, it should be
possible to change the execution order of the rules
and, thereby, examine the reasoning strategy but also
experiment with the execution order.
A domain expert might prefer not to reason by
starting with a conclusion and working backwards to
find a solution, as one does in backward chaining.
Instead, the expert may start with several facts in an
attempt to find a solution through forward chaining,
or, more probably, it might be decided to use a
mixed reasoning strategy. The reasoning may start
out with some facts and then use a hypothesis or
theory to find a solution. For instance, it is possible
to form a theory about a project and start to check
whether the premises that would be required to
satisfy the theory (or hypothesis) are valid. The
result would be displayed as a sequence diagram, a
diagram that allows both facts and rules to be
inserted, yielding different strategies.
With aid of such a diagrams, end users can be
able to learn how to solve a problem. The diagrams
can make it possible to experiment with the strategy
by placing the facts and rules at the lifeline
corresponding to the strategy and then moving them
back and forth. Changing the strategy will affect the
reasoning, which will give different results, because
of the different application of the facts and rules.
7 DYNAMICALLY RELATED
RULES IN COLLABORATION
DIAGRAMS
Instead of using one sequence diagram for several
purposes, dynamic knowledge can be presented in
what is known as a collaboration diagram by
incorporating user-supplied facts in the diagram.
This collaboration diagram can be used to modify
the execution order or the reasoning strategy of the
system by illustrating how these rules are related
dynamically.
Dynamic information is important since the rules
that are used during an execution depend on the
information that is supplied by the end users. User-
supplied facts are incorporated in a collaboration
diagram in which the relations show the flows that
are made over time to perform computations, and
that, therefore, illustrate the dynamic changes. In
such a diagram, the dynamic presentation of the
rules depends on the inputs the users insert into the
diagram. It is dynamic in the sense that it changes
with the inputs, and it visualizes the rules and their
relationships according to the inputs. Since
collaboration diagrams show how different rules and
facts are invoked, they give a sequential
demonstration of the steps that are involved in
arriving at a specific conclusion.
It is difficult to control and gain an overview of
relations between different parts: between the input,
the output and the rules. As demonstrated in Figure
2, the interrelation between these parts shows how
they are linked. For example, to reach the conclusion
“Contact doctor text”, the inputs, “No rash blister”,
“No rash size” and “No one red spot”, have been
inserted into the diagram. Then the rules, “Non
ICEIS 2005 - ARTIFICIAL INTELLIGENCE AND DECISION SUPPORT SYSTEMS
8

conclusion object” (Rule 7) and “Symptoms object”
(Rule 3) are used with the facts “Size rash”= “No”,
“Rash blister”= “No” and “One red spot” = ”No”.
call
1:check rule
r: Non conclusion object
2:check answer
r: Symptoms object
“Size rash” is “No”
5:present conclusion
c: Contact doctor text
no rash blister
no rash size
not one red spot
“Rash blister” is “No”
3:check answer
4:check answer
“One red spot” is “No”
Figure 2: A dynamic presentation of rules
In this diagram, the initials corresponding to the
name of the class have not been displayed for the
questions because these questions are displayed with
an alternative answer. This can, of course, be
included if the users prefer to use the initials.
Since the collaboration is dynamic, it is possible
to check the result against the input being changed.
By using collaboration diagrams, it may be easier to
get an overview of the entities in the sets.
A collaboration diagram makes it quite easy to
see where the rules or facts do not satisfy the inputs.
By changing the inputs until a particular fact is
satisfied, the end users can experiment with inputs to
the system and use the diagram to assist in learning.
Of course, the end users can change other inputs as
well. It should be noted that another way to present
this diagram is to display the complete diagram, as
in the first case, but to mark the non-satisfied box.
An analogy to company reports can demonstrate
difference between static and dynamic. In annual
reports there are two parts: the cashflow statement
and balance sheet. The cashflow statement shows
the movement of cash throughout the year and,
therefore, enables one to see what changes have
taken place, how the company runs, how the core
business is operating, and so on. The balance sheet
gives a frozen image of the state of the company at
one point in time and which, because companies are
obliged to produce these accounts annually, enables
one to compare the situation with previous years’
figures.
8 CONCLUDING REMARKS
Transferring problem solving strategies from an
expert to end users via a knowledge management
system is accomplished by conceptualization and by
visualization in the form of graphical diagrams.
Conceptualization is applied to on top of rules to
cope with the domain knowledge and the reasoning
strategy. The internal contents of the system are
dealt with by applying concepts in diagram-form, in
addition to which, including relationships facilitates
the handling of reasoning strategies. To transfer the
knowledge, it is necessary to include visualization
for presenting and understanding the problem
solving strategy to ensure that the end users
comprehend where the knowledge comes from.
The diagrams use concepts that correspond to the
rules. Thus, instead of presenting a rule’s physical
structure, a concept with semantic meaning is
applied to a rule. In these systems, the notion of a
concept is expected to grasp the semantics of a rule
and to convey a meaning of the operation it brings
about. Such semantics can be utilised to change how
the end users’ comprehension of the knowledge,
enabling them to understand the result of following
the different paths from a semantic meaning point of
view. Thus, diagrams can be used to explain how the
order the interpreter traverses the knowledge base to
reach a particular conclusion.
Utilising concepts and visualizing these in a
sequence and collaboration diagrams can illustrate
the rules and their relationships, in a static and
dynamic manner. Static presentation refers to the
visualization of the actual contents of the system,
here, a system promote understanding of the
reasoning strategy. Dynamic presentation, in
contrast, depends on the input the user makes to the
diagram, and thus, it is dynamic in the sense that it is
changes with the input, and is visualizes the
concepts and relationships corresponding to a
particular conclusion. Thus, it is visualizing the
system’s reasoning strategy that is visualized and
this changes depending on the particular situation or
task to be solved.
Domain knowledge and problem solving
strategies are of great importance for improving
domain knowledge and clarifying the strategies.
Each advance in the understanding of problem
solving and learning processes provides new insights
about the ways in which a learner can usefully be
supported. The systems under investigation here
simulate human reasoning and judging capabilities
by accepting knowledge from an external source and
accessing stored knowledge, applying a reasoning
process to solve problems.
If a transfer of knowledge is to be realized,
knowledge not only needs to be sent to a recipient,
but also to be absorbed and put to use (Andersson,
2000). Thus, if the knowledge and the strategies,
extracted from a system, can satisfy the users’
different learning styles then the knowledge can be
absorbed. By visualizing static reasoning strategies,
such as deductive reasoning of declarative
knowledge through the use of concepts, we believe
that people can learn to understand the problem
solving strategies. Declarative knowledge, such as
TRANSFERRING PROBLEM SOLVING STRATEGIES FROM THE EXPERT TO THE END USERS - Supporting
understanding
9

statements, is provided in the diagrams as well as
semantic knowledge, such as meanings, since the
diagram uses concepts to capture semantic notions at
different levels of abstraction. The declarative
knowledge and semantic knowledge can be used by
end users, who learn in different ways, for example,
verbal-linguistic intelligence, semantic knowledge
for logical-mathematical intelligence and
visualization with concepts for visual-spatial
intelligence (Mayiwar, & Håkansson, 2004).
Simulation of the dynamic behavior of an
interactive execution (or session) with the system is
another means of providing support to end users.
Visualizing procedural knowledge, i.e., step-by-step
execution, together with building student models can
support the types of intelligence mentioned above.
More work is needed to analyse the extent to
which the sequence and collaboration diagrams can
be supportive during learning and when changing of
the reasoning strategy. This may require illustration
of the relationships between certain rules by
simulating the execution order that is used to reach a
specific conclusion. Simulation will show how the
rules and facts contribute to the reasoning and,
thereby, support the development as well as the
consultation with the system.
Finally, more work is needed to analyse the
degree to which the end users can benefit from these
diagrams since they can learn to use a the strategy
by examining the reasoning followed. Moreover, it
is important to check whether they are able to
experiment with the facts and rules used by the
reasoning strategy to reach alternative conclusions.
REFERENCES
Andersson, K., 2000. Knowledge Technology Applications
for Knowledge Management, PhD thesis, Department
of Information Science, Computer Science Division,
Uppsala University, Sweden.
Awad, E.M., & Ghaziri H.M., 2004. Knowledge
Management. Pearson Education, Inc., Upper Saddle
River, New Jersey.
Booch, G., Rumbaugh, J., & Jacobson, I., 1999. The
Unified Modeling Language User Guide. Addison
Wesley Longman, Inc.
Durkin, J., 1994. Expert System Design and Development.
Prentice Hall International Editions. Macmillian
Publishing Company, New Jersey.
Helenius, E., 2001. UML and Knowledge Engineering of
Frame Based Knowledge Systems. Master Thesis,
Department of Information Science, Computer
Science Division, Uppsala University, Sweden.
Håkansson A., 2001. UML as an approach to Modelling
Knowledge in Rule-based Systems. (ES2001) The
Twenty-first SGES International Conference on
Knowledge Based Systems and Applied Artificial
Intelligence. Peterhouse College, Cambridge, UK
December 10
th
-12
th
.
Håkansson, A., 2003:a. Graphic Representation and
Visualisation as Modelling Support for the Knowledge
Acqusition Process. PhD thesis, Department of
Information Science, Computer Science Division,
Uppsala University, Sweden. ISBN 91-506-1727-3.
Håkansson, A., 2003:b. Supporting Illustration and
Modification of the Reasoning Strategy by
Visualisation. (SCAI’03) The Eighth Scandinavian
Conference on Artificial Intelligence, Bergen,
Norway, November 2
nd
-4
nd
.
Håkansson, A., 2003:c. Visual Conceptualisation for
Knowledge Acquisition in Knowledge Based Systems.
Accepted in: Frans Coenen (ed.): Expert Update
(SGAI) Specialist Group on Artificial Intelligence,
ISSN 1465-4091.
Jacobson, I. Rumbaugh, J. & Booch, G., 1998. The
Unified Modeling Language User Guide. Addison-
Wesley, USA.
Laudon, K., & Laudon, J., 2002. Management Information
Systems: Managing the Digital Firm. Prentice-Hall,
Inc., Upper Saddle River, New Jersey, 7
nd
edition.
Liebowitz J., & Wilcox, L., 1997. Knowledge
Management and Its Integrative Elements. CRC Press,
LLC 2000 Corporate Blvd., N.W., Boca Raton,
Florida.
Liebowitz J., 2001. Knowledge Management: Learning
from Knowledge Engineering. CRC Press, LLC 2000
Corporate Blvd., N.W., Boca Raton, Florida.
Mayiwar, N. & Håkansson, A., 2004. Considering
Different Learning Styles when Transferring Problem
Solving Strategies from Expert to End Users.
(KES'2004) 8th International Conference on
Knowledge-Based Intelligent Information &
Engineering Systems, Wellington, New Zealand,
September 22
th
-24
th
.
Murphy, P. & Pazzani, M., 1994. Revision of Production
System Rule-Bases, Machine Learning: Proceedings
of the Tenth International Workshop.
Schreiber, G., Akkermans, H., Anjewierden, A., de Hoog,
R., Shadbolt, N., Van de Velde, W., & Wielinga B.,
2001. Knowledge Engineering and Management – the
CommonKADS Methodology. The MIT Press,
Cambridge, Massachusetts, London, England.
Tansley, D.S.W., & Hayball, C.C., 1993. Knowledge-
Based Systems Analysis and Design - A KADS
Developer’s Handbook. Prentice Hall, UK.
Wiratunga, N. & Craw, S., 2000. Informed Selection of
Training Examples for Knowledge Refinement,
Proceedings of the EKAW2000, 233—248.
ICEIS 2005 - ARTIFICIAL INTELLIGENCE AND DECISION SUPPORT SYSTEMS
10
